| Param | Original file | Final file |
|---|---|---|
| Filename | modeM0/AS1A13_037T01_9000006256cztM0_level2.fits | modeM0/AS1A13_037T01_9000006256cztM0_level2_quad_clean.evt |
| Size (bytes) | 882,446,400 | 983,782,080 |
| Size | 841.6 MB | 938.2 MB |
| Events in quadrant A | 5,102,764 | 5,928,074 |
| Events in quadrant B | 5,052,050 | 6,036,189 |
| Events in quadrant C | 5,178,742 | 5,690,965 |
| Events in quadrant D | 4,408,682 | 5,164,448 |
| Mode M0 | |||
|---|---|---|---|
| Quadrant | BADHDUFLAG | Total packets | Discarded packets |
| A | 0 | 362982 | 0 |
| B | 0 | 228568 | 0 |
| C | 0 | 233165 | 0 |
| D | 0 | 281578 | 0 |
| Mode SS | |||
|---|---|---|---|
| Quadrant | BADHDUFLAG | Total packets | Discarded packets |
| A | 0 | 1979 | 0 |
| B | 0 | 1978 | 0 |
| C | 0 | 1980 | 0 |
| D | 0 | 1978 | 0 |
| Mode M9 | |||
|---|---|---|---|
| Quadrant | BADHDUFLAG | Total packets | Discarded packets |
| A | 0 | 114 | 0 |
| B | 0 | 114 | 0 |
| C | 0 | 114 | 0 |
| D | 0 | 114 | 0 |
| Quadrant | Total seconds | Saturated seconds | Saturation percentage |
|---|---|---|---|
| A | 101997 | 4320 | 4.235419% |
| B | 102078 | 2441 | 2.391309% |
| C | 102079 | 2988 | 2.927145% |
| D | 102061 | 6186 | 6.061081% |
Noise dominated data is calculated using 1-second bins in cleaned event files. If a bin has >2000 counts, and if more than 50% of those come from <1% of pixels, then it is considered to be noise-dominated and hence unusable.
| Quadrant | # 1 sec bins | Bins with >0 counts | Bins with >2000 counts | High rate bins dominated by noise | Noise dominated (total time) | Noise dominated (detector-on time) | Marked lightcurve |
|---|---|---|---|---|---|---|---|
| A | 134318 | 102143 | 0 | 0 | 0.00% | 0.00% |  |
| B | 134319 | 102230 | 0 | 0 | 0.00% | 0.00% | 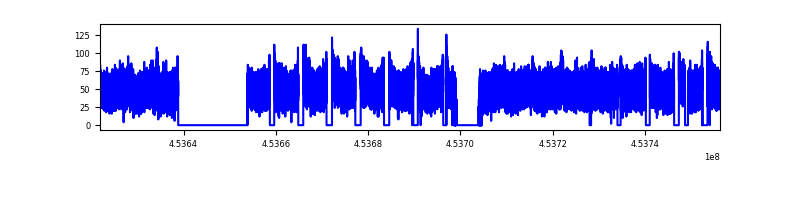 |
| C | 134319 | 102083 | 0 | 0 | 0.00% | 0.00% |  |
| D | 134319 | 102047 | 0 | 0 | 0.00% | 0.00% |  |
Top three noisy pixels from each quadrant. If the there are fewer than three noisy pixels in the level2.evt file, extra rows are filled as -1
| Pixel properties | Quadrant properties | ||||||
|---|---|---|---|---|---|---|---|
| Quadrant | DetID | PixID | Counts | Sigma | Mean | Median | Sigma |
| A | 7 | 110 | 4233 | 8.65 | 1332 | 1240 | 346.2 |
| A | 0 | 29 | 3964 | 7.87 | 1332 | 1240 | 346.2 |
| A | 14 | 95 | 3843 | 7.52 | 1332 | 1240 | 346.2 |
| B | 2 | 9 | 4922 | 14.12 | 1336 | 1269 | 258.8 |
| B | 2 | 8 | 3861 | 10.02 | 1336 | 1269 | 258.8 |
| B | 3 | 17 | 3648 | 9.19 | 1336 | 1269 | 258.8 |
| C | 3 | 202 | 4003 | 7.75 | 1371 | 1272 | 352.1 |
| C | 1 | 81 | 3978 | 7.68 | 1371 | 1272 | 352.1 |
| C | 1 | 80 | 3810 | 7.21 | 1371 | 1272 | 352.1 |
| D | 3 | 14 | 3249 | 5.96 | 1266 | 1146 | 353.0 |
| D | 12 | 6 | 3199 | 5.82 | 1266 | 1146 | 353.0 |
| D | 10 | 189 | 3190 | 5.79 | 1266 | 1146 | 353.0 |
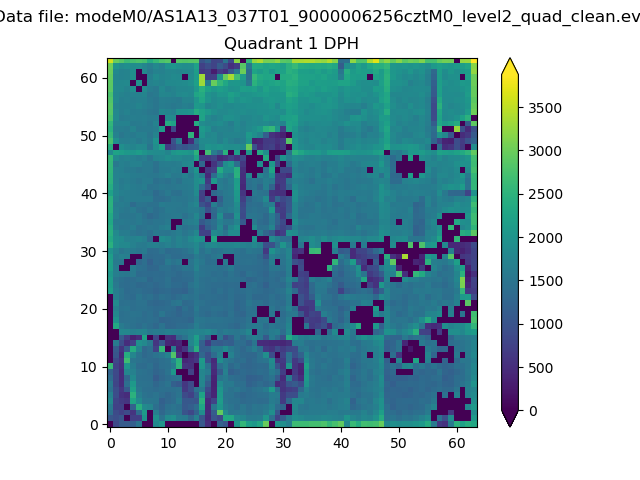
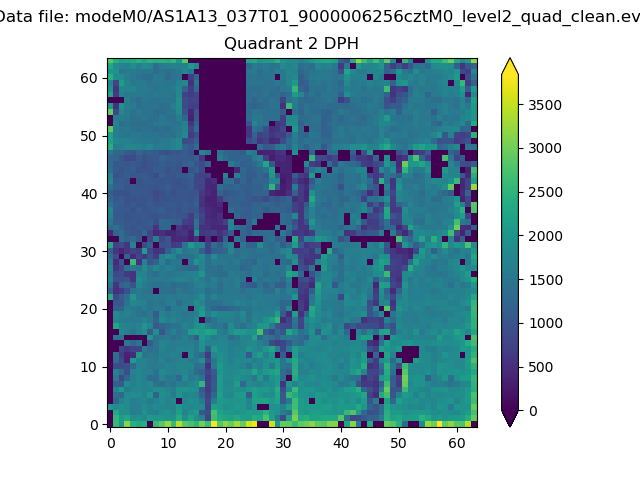
Histogram calculated using DETX and DETY for each event in the final _common_clean file
| Quadrant A |  |
 |
Quadrant B |
|---|---|---|---|
| Quadrant D |  |
 |
Quadrant C |
| Plot type | Count rate plots | Images |
|---|---|---|
| Comparison with Poisson distribution Blue bars denote a histogram of data divided into 1 sec bins. Red curve is a Poisson curve with rate = median count rate of data. |
 |
 |
| Quadrant-wise count rates Data is divided into 100 sec bins |
 |
|
| Module-wise count rates for Quadrant A Data is divided into 100 sec bins |
 |
 |
| Module-wise count rates for Quadrant B Data is divided into 100 sec bins |
 |
 |
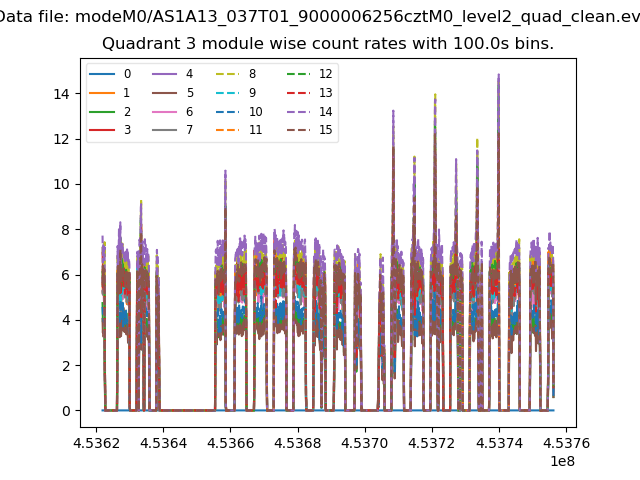
| Module-wise count rates for Quadrant C Data is divided into 100 sec bins |
 |
 |
| Module-wise count rates for Quadrant D Data is divided into 100 sec bins |
 |
 |
| Parameter | Plot |
|---|---|
| CZT HV Monitor |  |
| D_VDD | 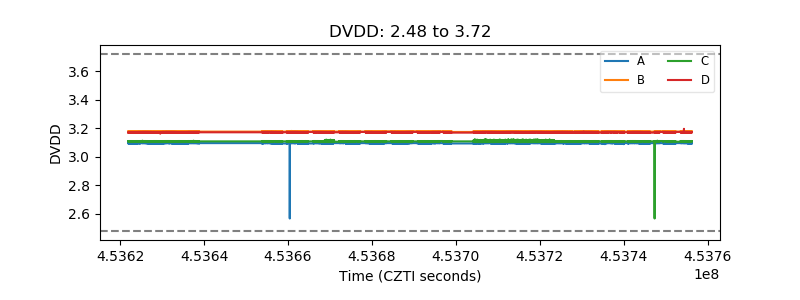 |
| Temperature 1 |  |
| Veto HV Monitor |  |
| Veto LLD |  |
| Alpha Counter |  |
| _CPM_Rate |  |
| CZT Counter | 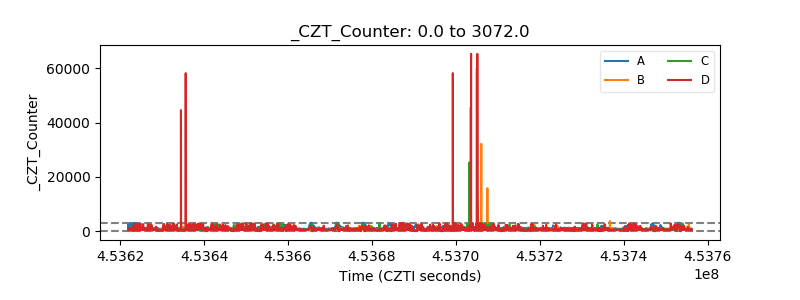 |
| +2.5 Volts monitor |  |
| +5 Volts monitor |  |
| _ROLL_ROT | 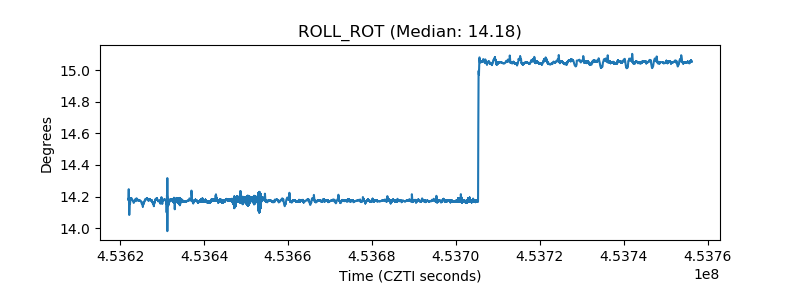 |
| _Roll_DEC | 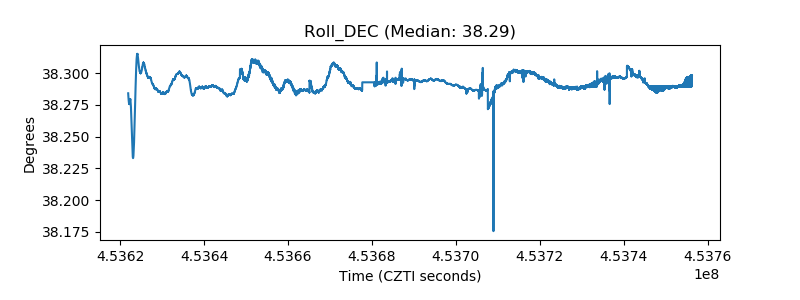 |
| _Roll_RA | 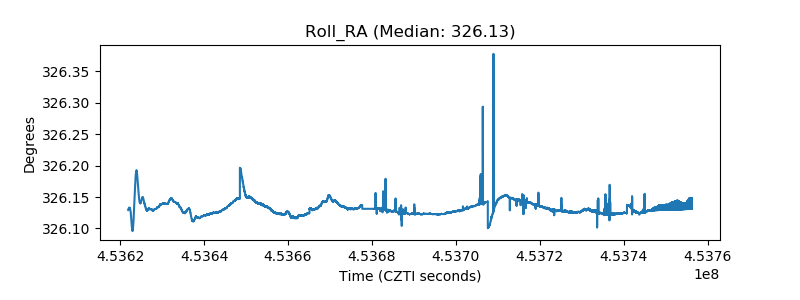 |
| Veto Counter | 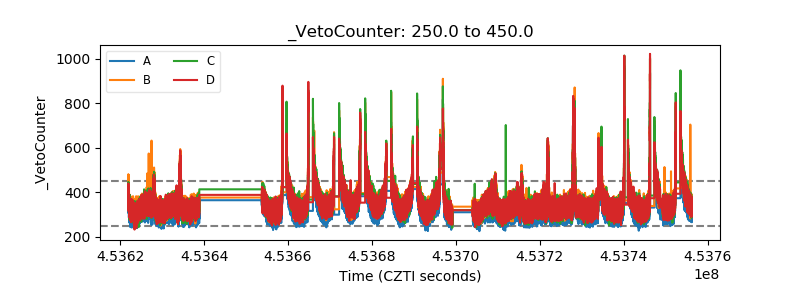 |