| Param | Original file | Final file |
|---|---|---|
| Filename | modeM0/AS1A13_092T09_9000006258cztM0_level2.fits | modeM0/AS1A13_092T09_9000006258cztM0_level2_quad_clean.evt |
| Size (bytes) | 605,586,240 | 594,576,000 |
| Size | 577.5 MB | 567.0 MB |
| Events in quadrant A | 3,495,740 | 3,410,352 |
| Events in quadrant B | 3,453,598 | 3,510,377 |
| Events in quadrant C | 3,598,270 | 3,386,316 |
| Events in quadrant D | 2,986,194 | 2,896,504 |
| Mode M0 | |||
|---|---|---|---|
| Quadrant | BADHDUFLAG | Total packets | Discarded packets |
| A | 0 | 246189 | 0 |
| B | 0 | 159567 | 0 |
| C | 0 | 147349 | 0 |
| D | 0 | 202101 | 0 |
| Mode M9 | |||
|---|---|---|---|
| Quadrant | BADHDUFLAG | Total packets | Discarded packets |
| A | 0 | 85 | 0 |
| B | 0 | 85 | 0 |
| C | 0 | 85 | 0 |
| D | 0 | 85 | 0 |
| Mode SS | |||
|---|---|---|---|
| Quadrant | BADHDUFLAG | Total packets | Discarded packets |
| A | 0 | 1426 | 0 |
| B | 0 | 1426 | 0 |
| C | 0 | 1424 | 0 |
| D | 0 | 1426 | 0 |
| Quadrant | Total seconds | Saturated seconds | Saturation percentage |
|---|---|---|---|
| A | 69992 | 2615 | 3.736141% |
| B | 70023 | 1814 | 2.590577% |
| C | 70032 | 658 | 0.939570% |
| D | 70030 | 4890 | 6.982722% |
Noise dominated data is calculated using 1-second bins in cleaned event files. If a bin has >2000 counts, and if more than 50% of those come from <1% of pixels, then it is considered to be noise-dominated and hence unusable.
| Quadrant | # 1 sec bins | Bins with >0 counts | Bins with >2000 counts | High rate bins dominated by noise | Noise dominated (total time) | Noise dominated (detector-on time) | Marked lightcurve |
|---|---|---|---|---|---|---|---|
| A | 78704 | 70069 | 0 | 0 | 0.00% | 0.00% | 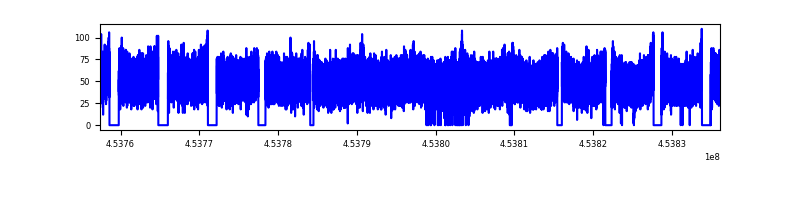 |
| B | 78704 | 70060 | 0 | 0 | 0.00% | 0.00% |  |
| C | 78704 | 70074 | 0 | 0 | 0.00% | 0.00% | 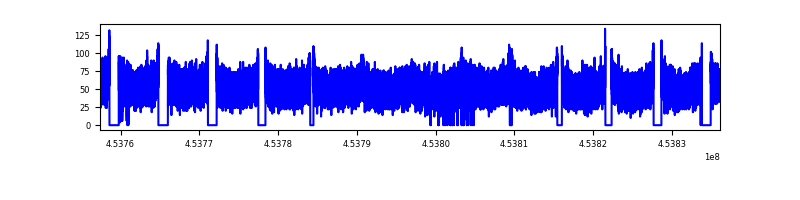 |
| D | 78704 | 69998 | 0 | 0 | 0.00% | 0.00% | 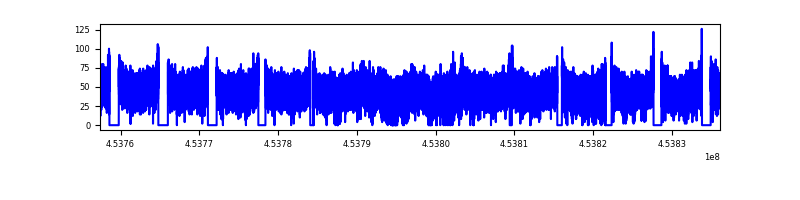 |
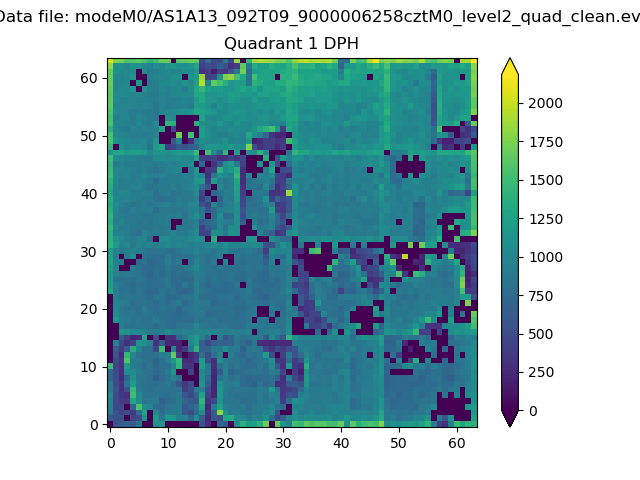
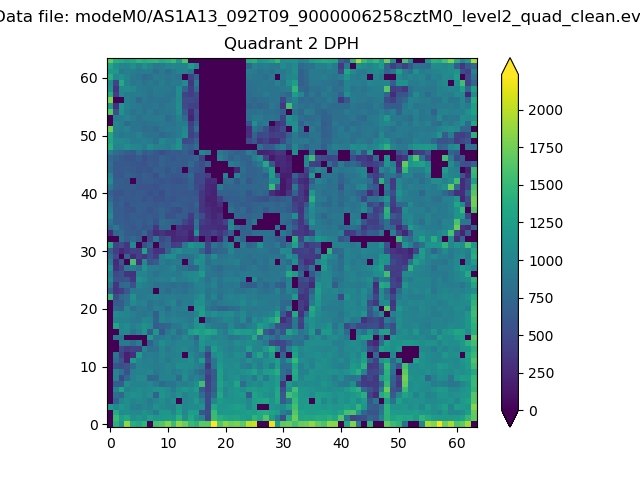
Top three noisy pixels from each quadrant. If the there are fewer than three noisy pixels in the level2.evt file, extra rows are filled as -1
| Pixel properties | Quadrant properties | ||||||
|---|---|---|---|---|---|---|---|
| Quadrant | DetID | PixID | Counts | Sigma | Mean | Median | Sigma |
| A | 7 | 110 | 2875 | 8.68 | 910 | 848 | 233.7 |
| A | 14 | 95 | 2707 | 7.96 | 910 | 848 | 233.7 |
| A | 0 | 29 | 2650 | 7.71 | 910 | 848 | 233.7 |
| B | 2 | 9 | 3300 | 13.46 | 912 | 867 | 180.8 |
| B | 2 | 8 | 2600 | 9.59 | 912 | 867 | 180.8 |
| B | 3 | 17 | 2591 | 9.54 | 912 | 867 | 180.8 |
| C | 3 | 202 | 2810 | 7.81 | 951 | 878 | 247.4 |
| C | 3 | 203 | 2685 | 7.3 | 951 | 878 | 247.4 |
| C | 1 | 80 | 2572 | 6.85 | 951 | 878 | 247.4 |
| D | 15 | 63 | 2186 | 5.89 | 858 | 776 | 239.4 |
| D | 10 | 189 | 2172 | 5.83 | 858 | 776 | 239.4 |
| D | 7 | 3 | 2163 | 5.79 | 858 | 776 | 239.4 |
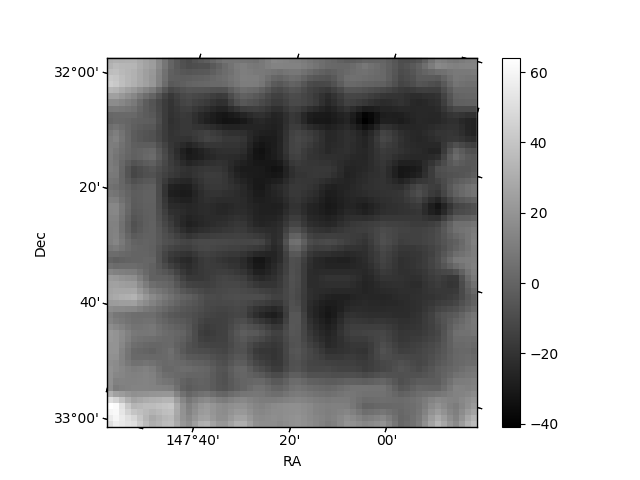
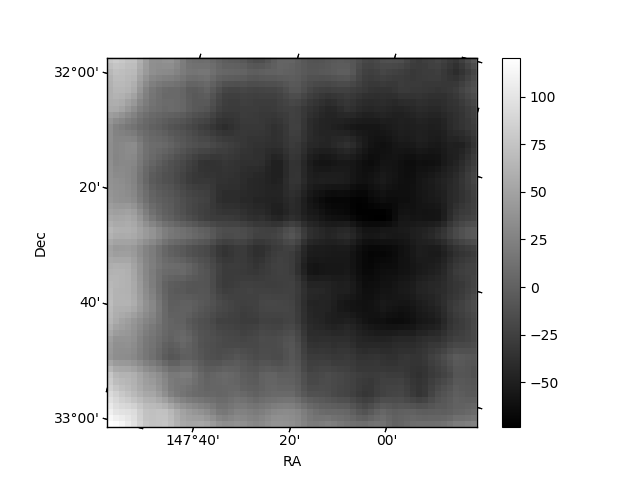
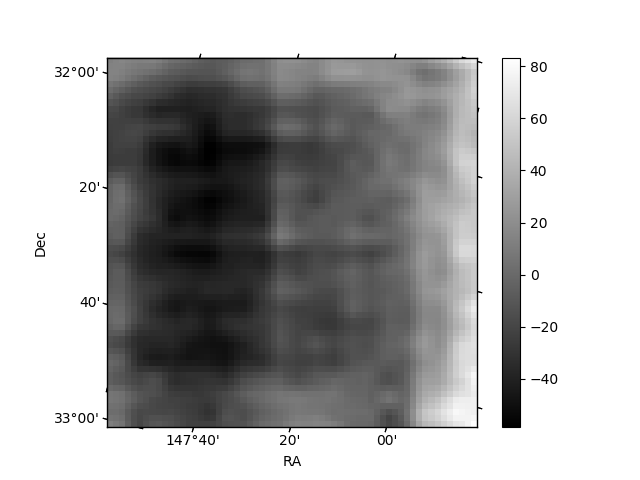
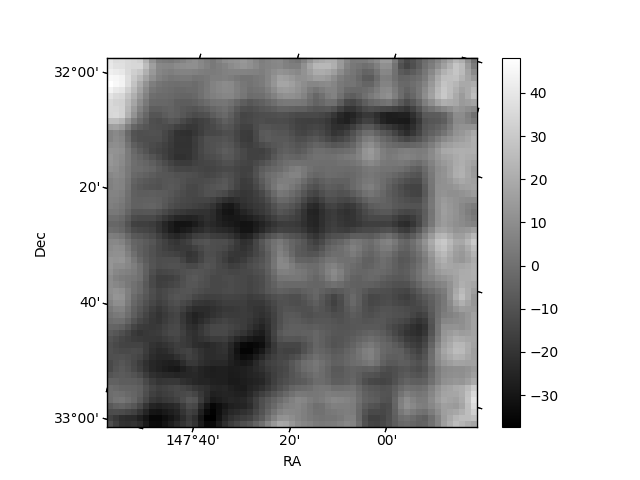
Histogram calculated using DETX and DETY for each event in the final _common_clean file
| Quadrant A | 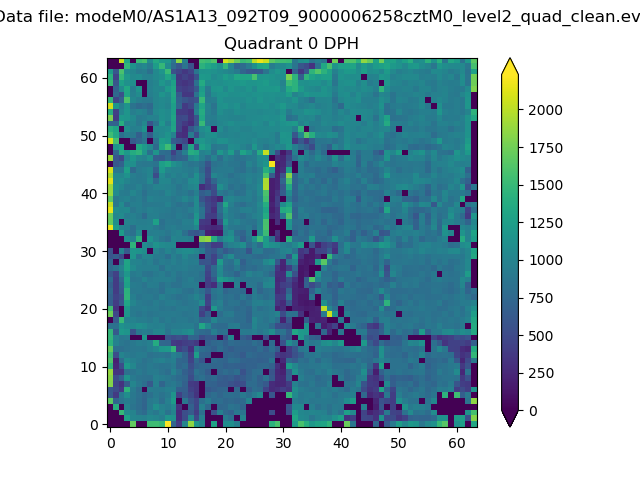 |
 |
Quadrant B |
|---|---|---|---|
| Quadrant D | 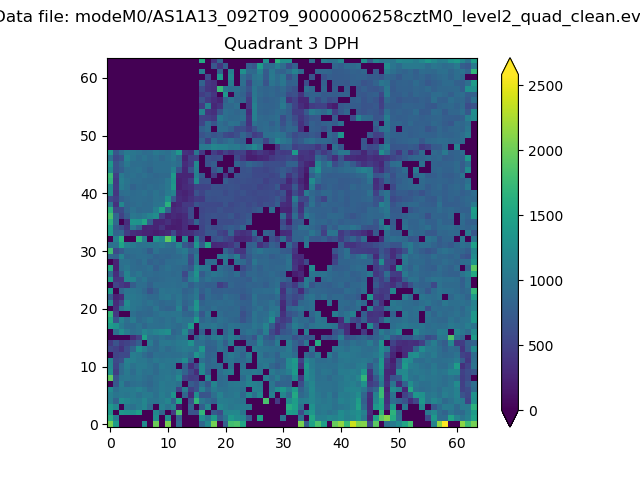 |
 |
Quadrant C |
| Plot type | Count rate plots | Images |
|---|---|---|
| Comparison with Poisson distribution Blue bars denote a histogram of data divided into 1 sec bins. Red curve is a Poisson curve with rate = median count rate of data. |
 |
 |
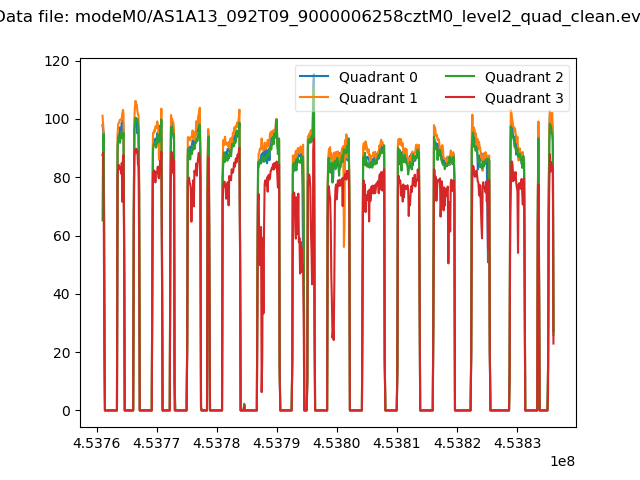
| Quadrant-wise count rates Data is divided into 100 sec bins |
 |
|
| Module-wise count rates for Quadrant A Data is divided into 100 sec bins |
 |
 |
| Module-wise count rates for Quadrant B Data is divided into 100 sec bins |
 |
 |
| Module-wise count rates for Quadrant C Data is divided into 100 sec bins |
 |
 |
| Module-wise count rates for Quadrant D Data is divided into 100 sec bins |
 |
 |
| Parameter | Plot |
|---|---|
| CZT HV Monitor | 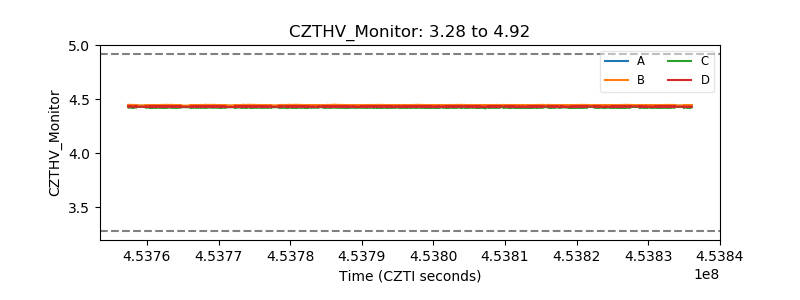 |
| D_VDD | 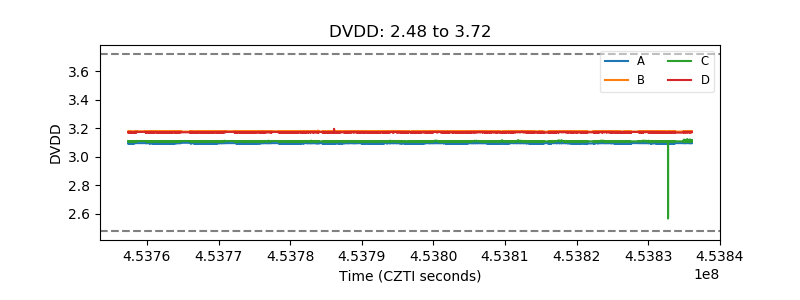 |
| Temperature 1 | 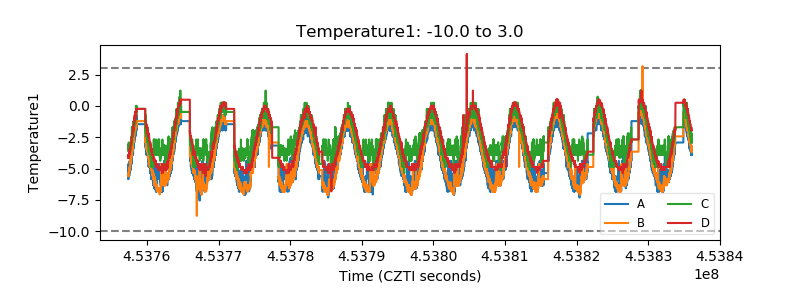 |
| Veto HV Monitor |  |
| Veto LLD | 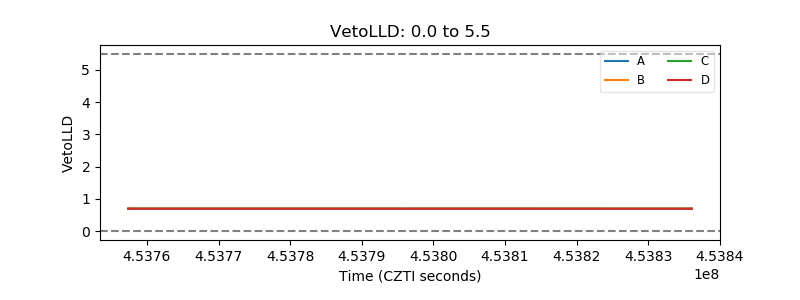 |
| Alpha Counter |  |
| _CPM_Rate | 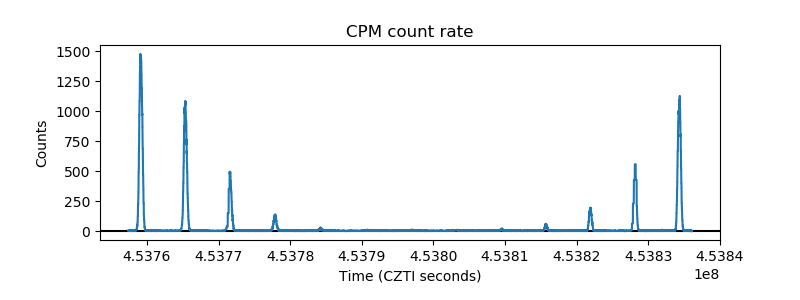 |
| CZT Counter | 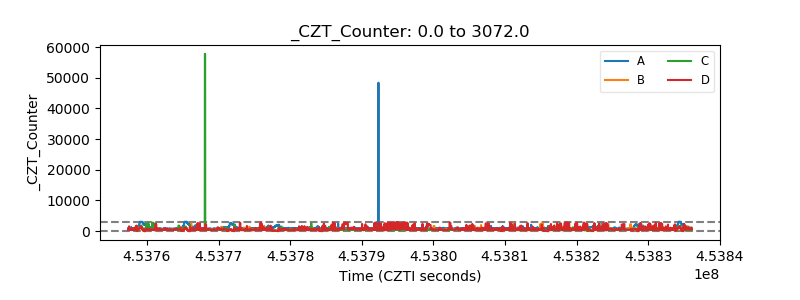 |
| +2.5 Volts monitor | 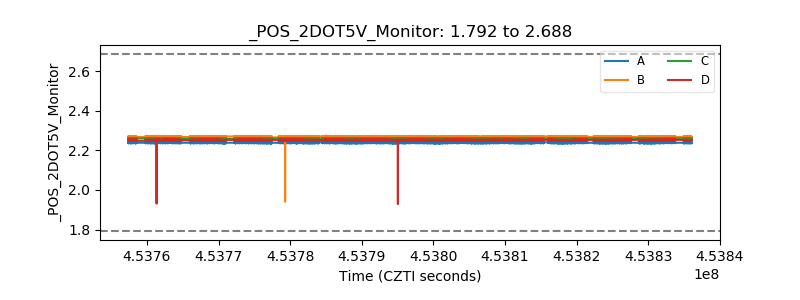 |
| +5 Volts monitor |  |
| _ROLL_ROT | 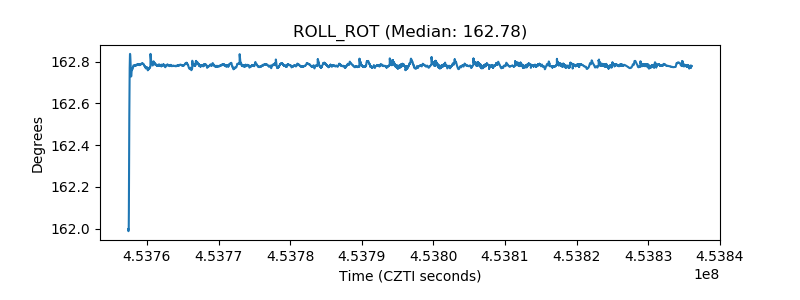 |
| _Roll_DEC | 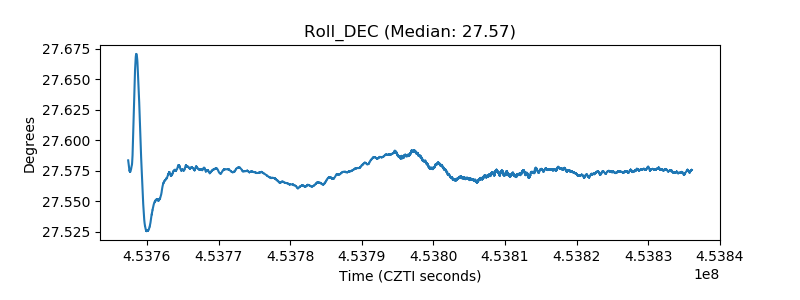 |
| _Roll_RA | 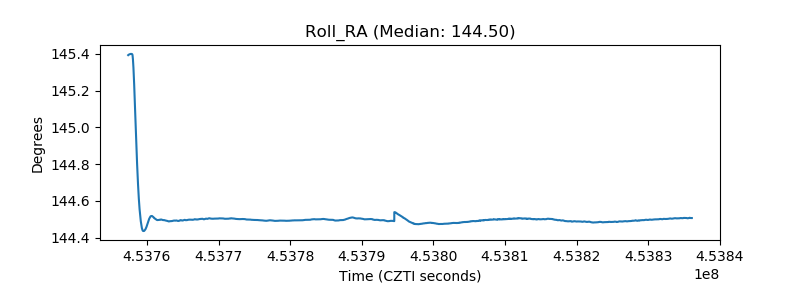 |
| Veto Counter | 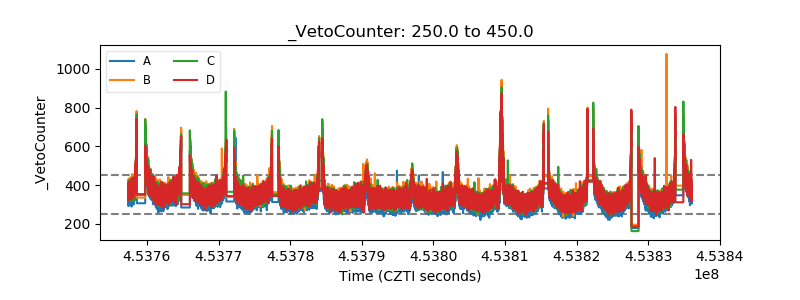 |