| Param | Original file | Final file |
|---|---|---|
| Filename | modeM0/AS1T05_205T01_9000006260cztM0_level2.fits | modeM0/AS1T05_205T01_9000006260cztM0_level2_quad_clean.evt |
| Size (bytes) | 510,209,280 | 512,544,960 |
| Size | 486.6 MB | 488.8 MB |
| Events in quadrant A | 2,953,098 | 2,949,296 |
| Events in quadrant B | 2,900,608 | 3,042,998 |
| Events in quadrant C | 3,045,028 | 2,920,704 |
| Events in quadrant D | 2,508,376 | 2,568,144 |
| Mode M9 | |||
|---|---|---|---|
| Quadrant | BADHDUFLAG | Total packets | Discarded packets |
| A | 0 | 61 | 0 |
| B | 0 | 61 | 0 |
| C | 0 | 61 | 0 |
| D | 0 | 61 | 0 |
| Mode SS | |||
|---|---|---|---|
| Quadrant | BADHDUFLAG | Total packets | Discarded packets |
| A | 0 | 1192 | 0 |
| B | 0 | 1192 | 0 |
| C | 0 | 1192 | 0 |
| D | 0 | 1192 | 0 |
| Mode M0 | |||
|---|---|---|---|
| Quadrant | BADHDUFLAG | Total packets | Discarded packets |
| A | 0 | 199511 | 0 |
| B | 0 | 147841 | 0 |
| C | 0 | 124115 | 0 |
| D | 0 | 166221 | 0 |
| Quadrant | Total seconds | Saturated seconds | Saturation percentage |
|---|---|---|---|
| A | 58912 | 2102 | 3.568034% |
| B | 58912 | 2190 | 3.717409% |
| C | 58914 | 590 | 1.001460% |
| D | 58908 | 4822 | 8.185645% |
Noise dominated data is calculated using 1-second bins in cleaned event files. If a bin has >2000 counts, and if more than 50% of those come from <1% of pixels, then it is considered to be noise-dominated and hence unusable.
| Quadrant | # 1 sec bins | Bins with >0 counts | Bins with >2000 counts | High rate bins dominated by noise | Noise dominated (total time) | Noise dominated (detector-on time) | Marked lightcurve |
|---|---|---|---|---|---|---|---|
| A | 64934 | 58911 | 0 | 0 | 0.00% | 0.00% |  |
| B | 64934 | 58904 | 0 | 0 | 0.00% | 0.00% |  |
| C | 64934 | 58909 | 0 | 0 | 0.00% | 0.00% |  |
| D | 64934 | 58695 | 0 | 0 | 0.00% | 0.00% |  |
Top three noisy pixels from each quadrant. If the there are fewer than three noisy pixels in the level2.evt file, extra rows are filled as -1
| Pixel properties | Quadrant properties | ||||||
|---|---|---|---|---|---|---|---|
| Quadrant | DetID | PixID | Counts | Sigma | Mean | Median | Sigma |
| A | 7 | 110 | 2416 | 8.42 | 770 | 716 | 201.9 |
| A | 0 | 29 | 2251 | 7.6 | 770 | 716 | 201.9 |
| A | 14 | 95 | 2210 | 7.4 | 770 | 716 | 201.9 |
| B | 2 | 9 | 2741 | 13.26 | 764 | 724 | 152.1 |
| B | 2 | 8 | 2111 | 9.12 | 764 | 724 | 152.1 |
| B | 3 | 17 | 2080 | 8.92 | 764 | 724 | 152.1 |
| C | 1 | 81 | 2356 | 7.58 | 803 | 744 | 212.7 |
| C | 1 | 80 | 2257 | 7.11 | 803 | 744 | 212.7 |
| C | 3 | 203 | 2229 | 6.98 | 803 | 744 | 212.7 |
| D | 15 | 47 | 1826 | 5.87 | 718 | 650 | 200.2 |
| D | 3 | 14 | 1807 | 5.78 | 718 | 650 | 200.2 |
| D | 4 | 16 | 1785 | 5.67 | 718 | 650 | 200.2 |
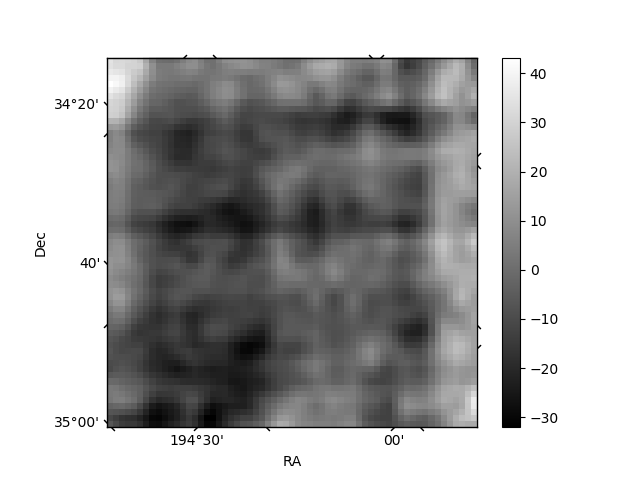
Histogram calculated using DETX and DETY for each event in the final _common_clean file
| Quadrant A | 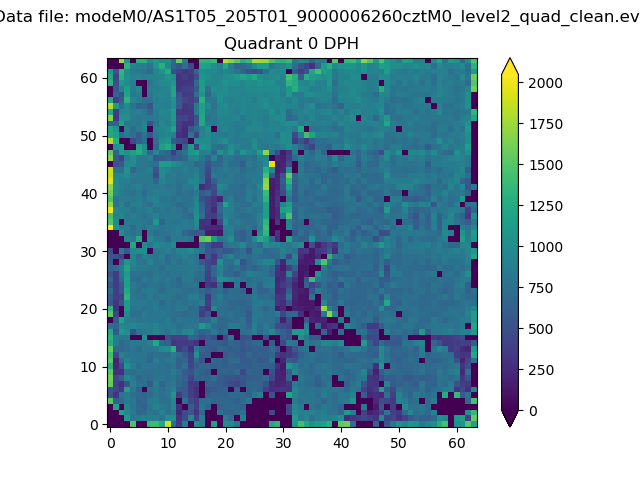 |
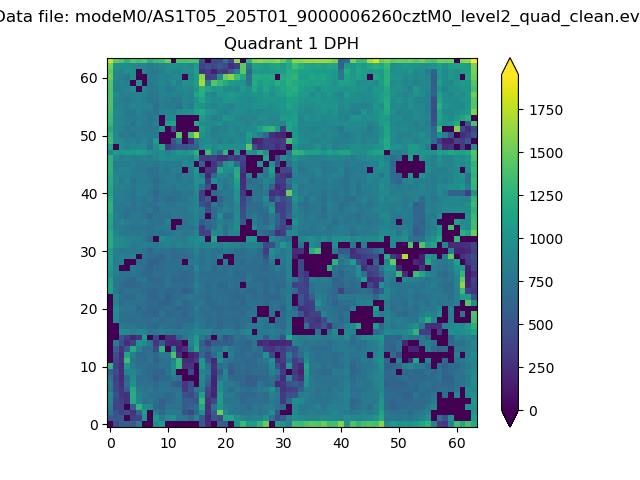 |
Quadrant B |
|---|---|---|---|
| Quadrant D | 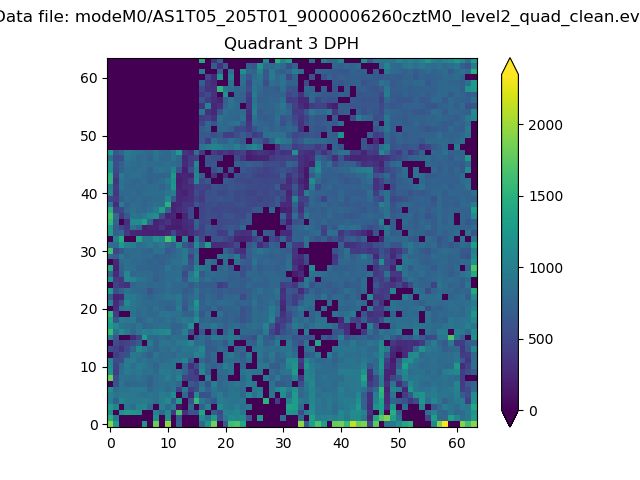 |
 |
Quadrant C |
| Plot type | Count rate plots | Images |
|---|---|---|
| Comparison with Poisson distribution Blue bars denote a histogram of data divided into 1 sec bins. Red curve is a Poisson curve with rate = median count rate of data. |
 |
 |
| Quadrant-wise count rates Data is divided into 100 sec bins |
 |
|
| Module-wise count rates for Quadrant A Data is divided into 100 sec bins |
 |
 |
| Module-wise count rates for Quadrant B Data is divided into 100 sec bins |
 |
 |
| Module-wise count rates for Quadrant C Data is divided into 100 sec bins |
 |
 |
| Module-wise count rates for Quadrant D Data is divided into 100 sec bins |
 |
 |
| Parameter | Plot |
|---|---|
| CZT HV Monitor |  |
| D_VDD |  |
| Temperature 1 |  |
| Veto HV Monitor |  |
| Veto LLD | 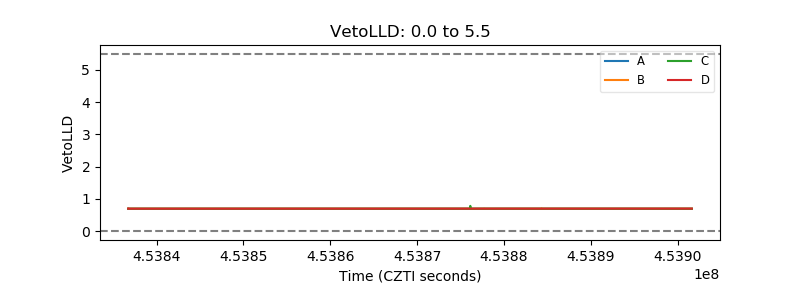 |
| Alpha Counter |  |
| _CPM_Rate |  |
| CZT Counter |  |
| +2.5 Volts monitor |  |
| +5 Volts monitor |  |
| _ROLL_ROT |  |
| _Roll_DEC |  |
| _Roll_RA | 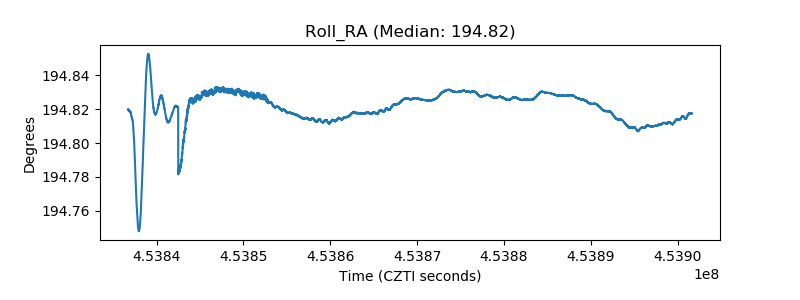 |
| Veto Counter | 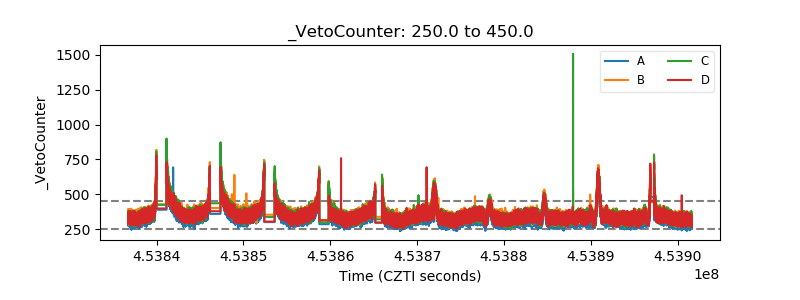 |