| Param | Original file | Final file |
|---|---|---|
| Filename | modeM0/AS1A13_034T01_9000006264cztM0_level2.fits | modeM0/AS1A13_034T01_9000006264cztM0_level2_quad_clean.evt |
| Size (bytes) | 215,737,920 | 209,681,280 |
| Size | 205.7 MB | 200.0 MB |
| Events in quadrant A | 1,225,934 | 1,191,557 |
| Events in quadrant B | 1,223,438 | 1,221,701 |
| Events in quadrant C | 1,269,164 | 1,157,265 |
| Events in quadrant D | 1,068,326 | 1,033,701 |
| Mode M0 | |||
|---|---|---|---|
| Quadrant | BADHDUFLAG | Total packets | Discarded packets |
| A | 0 | 93924 | 0 |
| B | 0 | 58997 | 0 |
| C | 0 | 53147 | 0 |
| D | 0 | 67907 | 0 |
| Mode SS | |||
|---|---|---|---|
| Quadrant | BADHDUFLAG | Total packets | Discarded packets |
| A | 0 | 516 | 0 |
| B | 0 | 520 | 0 |
| C | 0 | 520 | 0 |
| D | 0 | 518 | 0 |
| Mode M9 | |||
|---|---|---|---|
| Quadrant | BADHDUFLAG | Total packets | Discarded packets |
| A | 0 | 27 | 0 |
| B | 0 | 27 | 0 |
| C | 0 | 27 | 0 |
| D | 0 | 27 | 0 |
| Quadrant | Total seconds | Saturated seconds | Saturation percentage |
|---|---|---|---|
| A | 25290 | 1270 | 5.021748% |
| B | 25447 | 827 | 3.249892% |
| C | 25366 | 430 | 1.695183% |
| D | 25351 | 1510 | 5.956373% |
Noise dominated data is calculated using 1-second bins in cleaned event files. If a bin has >2000 counts, and if more than 50% of those come from <1% of pixels, then it is considered to be noise-dominated and hence unusable.
| Quadrant | # 1 sec bins | Bins with >0 counts | Bins with >2000 counts | High rate bins dominated by noise | Noise dominated (total time) | Noise dominated (detector-on time) | Marked lightcurve |
|---|---|---|---|---|---|---|---|
| A | 28880 | 25374 | 0 | 0 | 0.00% | 0.00% |  |
| B | 28880 | 25558 | 0 | 0 | 0.00% | 0.00% |  |
| C | 28880 | 25481 | 0 | 0 | 0.00% | 0.00% |  |
| D | 28874 | 25411 | 0 | 0 | 0.00% | 0.00% |  |
Top three noisy pixels from each quadrant. If the there are fewer than three noisy pixels in the level2.evt file, extra rows are filled as -1
| Pixel properties | Quadrant properties | ||||||
|---|---|---|---|---|---|---|---|
| Quadrant | DetID | PixID | Counts | Sigma | Mean | Median | Sigma |
| A | 0 | 29 | 975 | 7.97 | 320 | 299 | 84.8 |
| A | 14 | 95 | 965 | 7.86 | 320 | 299 | 84.8 |
| A | 0 | 30 | 936 | 7.51 | 320 | 299 | 84.8 |
| B | 2 | 9 | 1250 | 14.55 | 322 | 307 | 64.8 |
| B | 2 | 8 | 986 | 10.48 | 322 | 307 | 64.8 |
| B | 3 | 17 | 929 | 9.6 | 322 | 307 | 64.8 |
| C | 1 | 81 | 1011 | 7.94 | 335 | 310 | 88.3 |
| C | 3 | 202 | 978 | 7.57 | 335 | 310 | 88.3 |
| C | 3 | 203 | 954 | 7.3 | 335 | 310 | 88.3 |
| D | 3 | 14 | 823 | 6.19 | 306 | 275 | 88.5 |
| D | 4 | 16 | 771 | 5.6 | 306 | 275 | 88.5 |
| D | 15 | 47 | 763 | 5.51 | 306 | 275 | 88.5 |
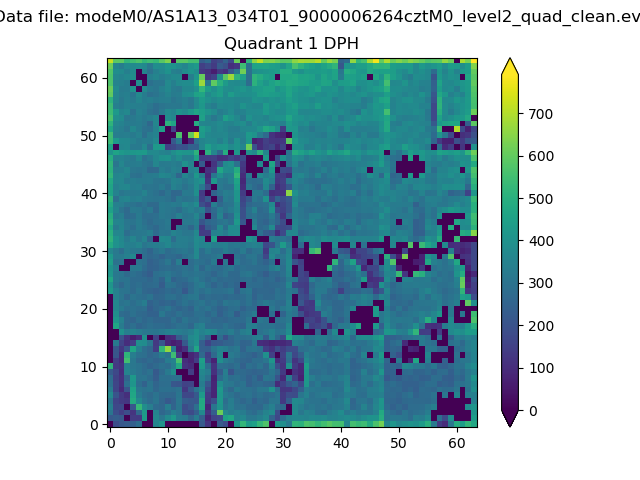
Histogram calculated using DETX and DETY for each event in the final _common_clean file
| Quadrant A |  |
 |
Quadrant B |
|---|---|---|---|
| Quadrant D |  |
 |
Quadrant C |
| Plot type | Count rate plots | Images |
|---|---|---|
| Comparison with Poisson distribution Blue bars denote a histogram of data divided into 1 sec bins. Red curve is a Poisson curve with rate = median count rate of data. |
 |
 |
| Quadrant-wise count rates Data is divided into 100 sec bins |
 |
|
| Module-wise count rates for Quadrant A Data is divided into 100 sec bins |
 |
 |
| Module-wise count rates for Quadrant B Data is divided into 100 sec bins |
 |
 |
| Module-wise count rates for Quadrant C Data is divided into 100 sec bins |
 |
 |
| Module-wise count rates for Quadrant D Data is divided into 100 sec bins |
 |
 |
| Parameter | Plot |
|---|---|
| CZT HV Monitor |  |
| D_VDD | 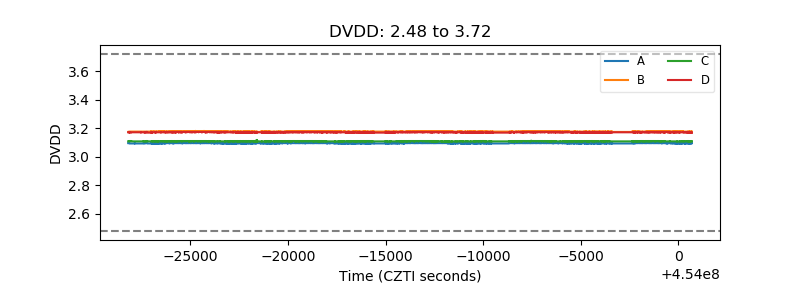 |
| Temperature 1 |  |
| Veto HV Monitor |  |
| Veto LLD |  |
| Alpha Counter |  |
| _CPM_Rate |  |
| CZT Counter |  |
| +2.5 Volts monitor |  |
| +5 Volts monitor |  |
| _ROLL_ROT |  |
| _Roll_DEC |  |
| _Roll_RA |  |
| Veto Counter |  |