| Param | Original file | Final file |
|---|---|---|
| Filename | modeM0/AS1A13_068T13_9000006268cztM0_level2.fits | modeM0/AS1A13_068T13_9000006268cztM0_level2_quad_clean.evt |
| Size (bytes) | 327,251,520 | 400,559,040 |
| Size | 312.1 MB | 382.0 MB |
| Events in quadrant A | 1,863,628 | 2,427,628 |
| Events in quadrant B | 1,868,223 | 2,520,254 |
| Events in quadrant C | 1,926,332 | 2,415,122 |
| Events in quadrant D | 1,620,347 | 2,138,187 |
| Mode M0 | |||
|---|---|---|---|
| Quadrant | BADHDUFLAG | Total packets | Discarded packets |
| A | 0 | 130769 | 0 |
| B | 0 | 81552 | 0 |
| C | 0 | 80618 | 0 |
| D | 0 | 104693 | 0 |
| Mode SS | |||
|---|---|---|---|
| Quadrant | BADHDUFLAG | Total packets | Discarded packets |
| A | 0 | 775 | 0 |
| B | 0 | 774 | 0 |
| C | 0 | 776 | 0 |
| D | 0 | 776 | 0 |
| Mode M9 | |||
|---|---|---|---|
| Quadrant | BADHDUFLAG | Total packets | Discarded packets |
| A | 0 | 15 | 0 |
| B | 0 | 16 | 0 |
| C | 0 | 16 | 0 |
| D | 0 | 17 | 0 |
| Quadrant | Total seconds | Saturated seconds | Saturation percentage |
|---|---|---|---|
| A | 38088 | 1176 | 3.087587% |
| B | 38323 | 726 | 1.894424% |
| C | 38391 | 472 | 1.229455% |
| D | 38299 | 2115 | 5.522337% |
Noise dominated data is calculated using 1-second bins in cleaned event files. If a bin has >2000 counts, and if more than 50% of those come from <1% of pixels, then it is considered to be noise-dominated and hence unusable.
| Quadrant | # 1 sec bins | Bins with >0 counts | Bins with >2000 counts | High rate bins dominated by noise | Noise dominated (total time) | Noise dominated (detector-on time) | Marked lightcurve |
|---|---|---|---|---|---|---|---|
| A | 41435 | 38460 | 0 | 0 | 0.00% | 0.00% |  |
| B | 41435 | 38687 | 0 | 0 | 0.00% | 0.00% |  |
| C | 41435 | 38741 | 0 | 0 | 0.00% | 0.00% |  |
| D | 41435 | 38598 | 0 | 0 | 0.00% | 0.00% |  |
Top three noisy pixels from each quadrant. If the there are fewer than three noisy pixels in the level2.evt file, extra rows are filled as -1
| Pixel properties | Quadrant properties | ||||||
|---|---|---|---|---|---|---|---|
| Quadrant | DetID | PixID | Counts | Sigma | Mean | Median | Sigma |
| A | 7 | 110 | 1524 | 8.35 | 486 | 454 | 128.1 |
| A | 14 | 95 | 1444 | 7.73 | 486 | 454 | 128.1 |
| A | 0 | 29 | 1415 | 7.5 | 486 | 454 | 128.1 |
| B | 2 | 9 | 1753 | 13.22 | 491 | 467 | 97.3 |
| B | 2 | 8 | 1465 | 10.26 | 491 | 467 | 97.3 |
| B | 3 | 17 | 1373 | 9.31 | 491 | 467 | 97.3 |
| C | 1 | 81 | 1552 | 8.04 | 509 | 472 | 134.2 |
| C | 3 | 202 | 1529 | 7.87 | 509 | 472 | 134.2 |
| C | 1 | 80 | 1491 | 7.59 | 509 | 472 | 134.2 |
| D | 3 | 14 | 1232 | 6.19 | 464 | 419 | 131.3 |
| D | 10 | 189 | 1204 | 5.98 | 464 | 419 | 131.3 |
| D | 3 | 159 | 1166 | 5.69 | 464 | 419 | 131.3 |
Histogram calculated using DETX and DETY for each event in the final _common_clean file
| Quadrant A |  |
 |
Quadrant B |
|---|---|---|---|
| Quadrant D | 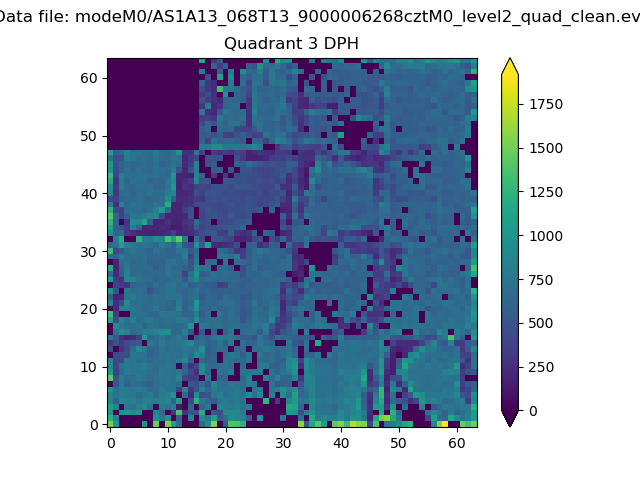 |
 |
Quadrant C |
| Plot type | Count rate plots | Images |
|---|---|---|
| Comparison with Poisson distribution Blue bars denote a histogram of data divided into 1 sec bins. Red curve is a Poisson curve with rate = median count rate of data. |
 |
 |
| Quadrant-wise count rates Data is divided into 100 sec bins |
 |
|
| Module-wise count rates for Quadrant A Data is divided into 100 sec bins |
 |
 |
| Module-wise count rates for Quadrant B Data is divided into 100 sec bins |
 |
 |
| Module-wise count rates for Quadrant C Data is divided into 100 sec bins |
 |
 |
| Module-wise count rates for Quadrant D Data is divided into 100 sec bins |
 |
 |
| Parameter | Plot |
|---|---|
| CZT HV Monitor |  |
| D_VDD | 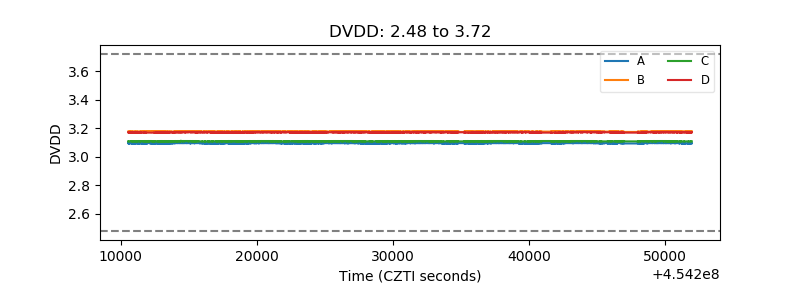 |
| Temperature 1 |  |
| Veto HV Monitor |  |
| Veto LLD |  |
| Alpha Counter |  |
| _CPM_Rate |  |
| CZT Counter |  |
| +2.5 Volts monitor |  |
| +5 Volts monitor |  |
| _ROLL_ROT |  |
| _Roll_DEC |  |
| _Roll_RA |  |
| Veto Counter |  |