| Param | Original file | Final file |
|---|---|---|
| Filename | modeM0/AS1C07_001T10_9000006272cztM0_level2.fits | modeM0/AS1C07_001T10_9000006272cztM0_level2_quad_clean.evt |
| Size (bytes) | 944,827,200 | 1,183,311,360 |
| Size | 901.1 MB | 1.1 GB |
| Events in quadrant A | 5,435,682 | 7,226,614 |
| Events in quadrant B | 5,336,822 | 7,304,477 |
| Events in quadrant C | 5,661,774 | 7,407,104 |
| Events in quadrant D | 4,685,488 | 6,412,724 |
| Mode SS | |||
|---|---|---|---|
| Quadrant | BADHDUFLAG | Total packets | Discarded packets |
| A | 0 | 2214 | 0 |
| B | 0 | 2214 | 0 |
| C | 0 | 2214 | 0 |
| D | 0 | 2214 | 0 |
| Mode M9 | |||
|---|---|---|---|
| Quadrant | BADHDUFLAG | Total packets | Discarded packets |
| A | 0 | 109 | 0 |
| B | 0 | 109 | 0 |
| C | 0 | 109 | 0 |
| D | 0 | 109 | 0 |
| Mode M0 | |||
|---|---|---|---|
| Quadrant | BADHDUFLAG | Total packets | Discarded packets |
| A | 0 | 379846 | 0 |
| B | 0 | 272188 | 0 |
| C | 0 | 226252 | 0 |
| D | 0 | 308610 | 0 |
| Quadrant | Total seconds | Saturated seconds | Saturation percentage |
|---|---|---|---|
| A | 109275 | 3828 | 3.503089% |
| B | 109275 | 3791 | 3.469229% |
| C | 109275 | 796 | 0.728437% |
| D | 109275 | 6027 | 5.515443% |
Noise dominated data is calculated using 1-second bins in cleaned event files. If a bin has >2000 counts, and if more than 50% of those come from <1% of pixels, then it is considered to be noise-dominated and hence unusable.
| Quadrant | # 1 sec bins | Bins with >0 counts | Bins with >2000 counts | High rate bins dominated by noise | Noise dominated (total time) | Noise dominated (detector-on time) | Marked lightcurve |
|---|---|---|---|---|---|---|---|
| A | 120169 | 109271 | 0 | 0 | 0.00% | 0.00% |  |
| B | 120170 | 109267 | 0 | 0 | 0.00% | 0.00% |  |
| C | 120170 | 109268 | 0 | 0 | 0.00% | 0.00% |  |
| D | 120170 | 109196 | 0 | 0 | 0.00% | 0.00% |  |
Top three noisy pixels from each quadrant. If the there are fewer than three noisy pixels in the level2.evt file, extra rows are filled as -1
| Pixel properties | Quadrant properties | ||||||
|---|---|---|---|---|---|---|---|
| Quadrant | DetID | PixID | Counts | Sigma | Mean | Median | Sigma |
| A | 7 | 110 | 4440 | 8.48 | 1420 | 1328 | 366.9 |
| A | 0 | 29 | 4272 | 8.02 | 1420 | 1328 | 366.9 |
| A | 14 | 95 | 4112 | 7.59 | 1420 | 1328 | 366.9 |
| B | 2 | 9 | 5077 | 13.77 | 1410 | 1347 | 270.8 |
| B | 2 | 8 | 4157 | 10.38 | 1410 | 1347 | 270.8 |
| B | 3 | 17 | 3790 | 9.02 | 1410 | 1347 | 270.8 |
| C | 1 | 81 | 4428 | 7.74 | 1497 | 1391 | 392.3 |
| C | 3 | 202 | 4421 | 7.72 | 1497 | 1391 | 392.3 |
| C | 1 | 80 | 4374 | 7.6 | 1497 | 1391 | 392.3 |
| D | 10 | 189 | 3478 | 6.05 | 1345 | 1221 | 373.2 |
| D | 15 | 47 | 3470 | 6.02 | 1345 | 1221 | 373.2 |
| D | 6 | 38 | 3423 | 5.9 | 1345 | 1221 | 373.2 |
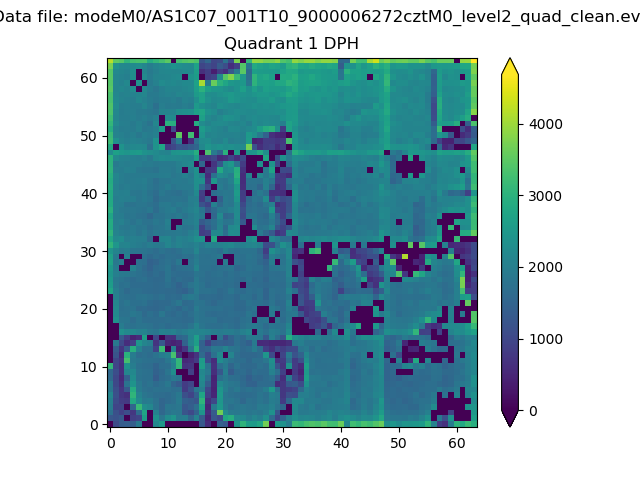
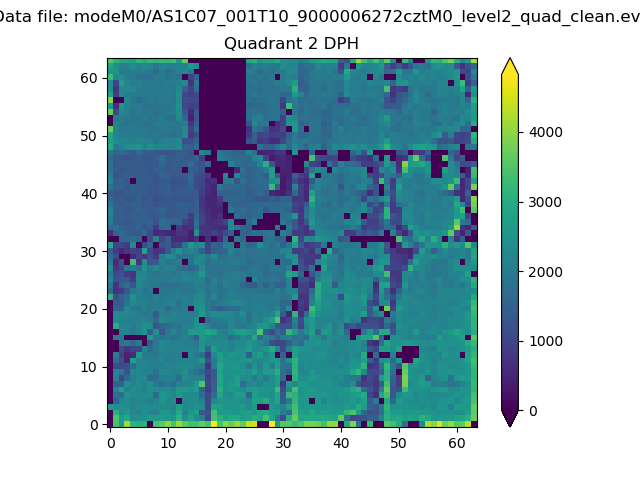
Histogram calculated using DETX and DETY for each event in the final _common_clean file
| Quadrant A |  |
 |
Quadrant B |
|---|---|---|---|
| Quadrant D |  |
 |
Quadrant C |
| Plot type | Count rate plots | Images |
|---|---|---|
| Comparison with Poisson distribution Blue bars denote a histogram of data divided into 1 sec bins. Red curve is a Poisson curve with rate = median count rate of data. |
 |
 |
| Quadrant-wise count rates Data is divided into 100 sec bins |
 |
|
| Module-wise count rates for Quadrant A Data is divided into 100 sec bins |
 |
 |
| Module-wise count rates for Quadrant B Data is divided into 100 sec bins |
 |
 |
| Module-wise count rates for Quadrant C Data is divided into 100 sec bins |
 |
 |
| Module-wise count rates for Quadrant D Data is divided into 100 sec bins |
 |
 |
| Parameter | Plot |
|---|---|
| CZT HV Monitor |  |
| D_VDD |  |
| Temperature 1 |  |
| Veto HV Monitor |  |
| Veto LLD |  |
| Alpha Counter |  |
| _CPM_Rate |  |
| CZT Counter |  |
| +2.5 Volts monitor |  |
| +5 Volts monitor |  |
| _ROLL_ROT |  |
| _Roll_DEC |  |
| _Roll_RA |  |
| Veto Counter |  |