| Param | Original file | Final file |
|---|---|---|
| Filename | modeM0/AS1A13_053T01_9000006274cztM0_level2.fits | modeM0/AS1A13_053T01_9000006274cztM0_level2_quad_clean.evt |
| Size (bytes) | 2,521,716,480 | 2,684,125,440 |
| Size | 2.3 GB | 2.5 GB |
| Events in quadrant A | 14,822,570 | 16,061,065 |
| Events in quadrant B | 14,377,658 | 16,321,941 |
| Events in quadrant C | 14,929,658 | 15,492,996 |
| Events in quadrant D | 12,521,342 | 13,717,432 |
| Mode M0 | |||
|---|---|---|---|
| Quadrant | BADHDUFLAG | Total packets | Discarded packets |
| A | 0 | 970875 | 0 |
| B | 0 | 721402 | 0 |
| C | 0 | 629647 | 0 |
| D | 0 | 811231 | 0 |
| Mode M9 | |||
|---|---|---|---|
| Quadrant | BADHDUFLAG | Total packets | Discarded packets |
| A | 0 | 376 | 0 |
| B | 0 | 376 | 0 |
| C | 0 | 376 | 0 |
| D | 0 | 376 | 0 |
| Mode SS | |||
|---|---|---|---|
| Quadrant | BADHDUFLAG | Total packets | Discarded packets |
| A | 0 | 5842 | 0 |
| B | 0 | 5842 | 0 |
| C | 0 | 5842 | 0 |
| D | 0 | 5842 | 0 |
| Quadrant | Total seconds | Saturated seconds | Saturation percentage |
|---|---|---|---|
| A | 287640 | 9975 | 3.467877% |
| B | 287642 | 10318 | 3.587098% |
| C | 287634 | 5526 | 1.921192% |
| D | 287637 | 22384 | 7.782031% |
Noise dominated data is calculated using 1-second bins in cleaned event files. If a bin has >2000 counts, and if more than 50% of those come from <1% of pixels, then it is considered to be noise-dominated and hence unusable.
| Quadrant | # 1 sec bins | Bins with >0 counts | Bins with >2000 counts | High rate bins dominated by noise | Noise dominated (total time) | Noise dominated (detector-on time) | Marked lightcurve |
|---|---|---|---|---|---|---|---|
| A | 325293 | 287641 | 0 | 0 | 0.00% | 0.00% |  |
| B | 325293 | 287603 | 0 | 0 | 0.00% | 0.00% |  |
| C | 325293 | 287363 | 0 | 0 | 0.00% | 0.00% |  |
| D | 325293 | 287017 | 0 | 0 | 0.00% | 0.00% |  |
Top three noisy pixels from each quadrant. If the there are fewer than three noisy pixels in the level2.evt file, extra rows are filled as -1
| Pixel properties | Quadrant properties | ||||||
|---|---|---|---|---|---|---|---|
| Quadrant | DetID | PixID | Counts | Sigma | Mean | Median | Sigma |
| A | 7 | 110 | 11858 | 8.35 | 3867 | 3611 | 987.4 |
| A | 0 | 29 | 11392 | 7.88 | 3867 | 3611 | 987.4 |
| A | 14 | 95 | 11026 | 7.51 | 3867 | 3611 | 987.4 |
| B | 2 | 9 | 13705 | 13.8 | 3803 | 3629 | 730.3 |
| B | 2 | 8 | 10903 | 9.96 | 3803 | 3629 | 730.3 |
| B | 3 | 17 | 10441 | 9.33 | 3803 | 3629 | 730.3 |
| C | 1 | 81 | 11344 | 7.52 | 3952 | 3675 | 1019.6 |
| C | 3 | 202 | 11331 | 7.51 | 3952 | 3675 | 1019.6 |
| C | 1 | 80 | 11046 | 7.23 | 3952 | 3675 | 1019.6 |
| D | 10 | 189 | 9156 | 5.97 | 3587 | 3253 | 989.1 |
| D | 3 | 14 | 9070 | 5.88 | 3587 | 3253 | 989.1 |
| D | 6 | 38 | 8991 | 5.8 | 3587 | 3253 | 989.1 |
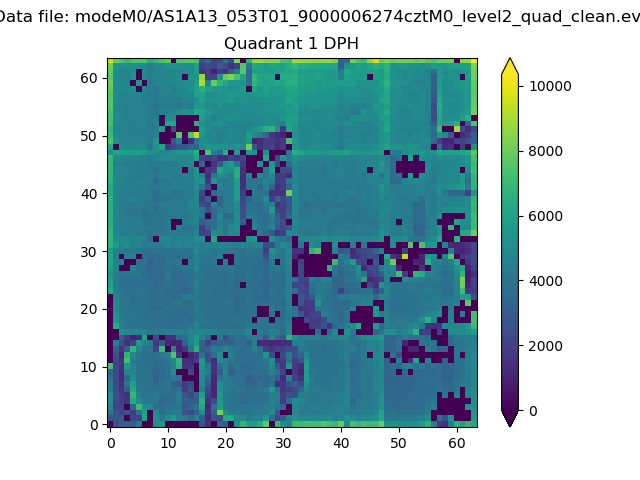
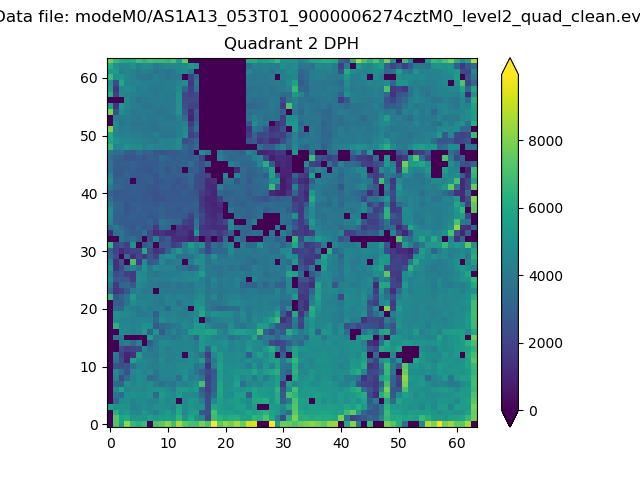
Histogram calculated using DETX and DETY for each event in the final _common_clean file
| Quadrant A |  |
 |
Quadrant B |
|---|---|---|---|
| Quadrant D |  |
 |
Quadrant C |
| Plot type | Count rate plots | Images |
|---|---|---|
| Comparison with Poisson distribution Blue bars denote a histogram of data divided into 1 sec bins. Red curve is a Poisson curve with rate = median count rate of data. |
 |
 |
| Quadrant-wise count rates Data is divided into 100 sec bins |
 |
|
| Module-wise count rates for Quadrant A Data is divided into 100 sec bins |
 |
 |
| Module-wise count rates for Quadrant B Data is divided into 100 sec bins |
 |
 |
| Module-wise count rates for Quadrant C Data is divided into 100 sec bins |
 |
 |
| Module-wise count rates for Quadrant D Data is divided into 100 sec bins |
 |
 |
| Parameter | Plot |
|---|---|
| CZT HV Monitor |  |
| D_VDD |  |
| Temperature 1 |  |
| Veto HV Monitor |  |
| Veto LLD |  |
| Alpha Counter |  |
| _CPM_Rate |  |
| CZT Counter |  |
| +2.5 Volts monitor |  |
| +5 Volts monitor |  |
| _ROLL_ROT |  |
| _Roll_DEC |  |
| _Roll_RA |  |
| Veto Counter | 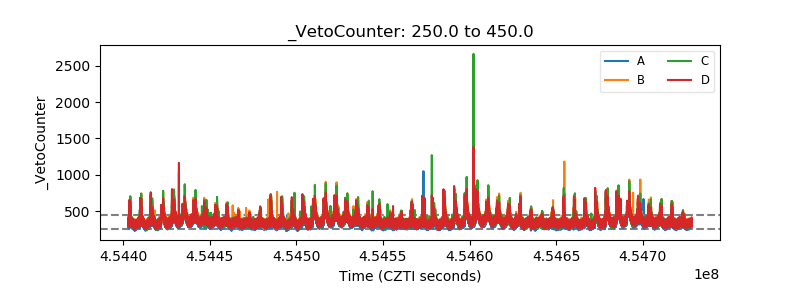 |