| Param | Original file | Final file |
|---|---|---|
| Filename | modeM0/AS1A13_068T05_9000006280cztM0_level2.fits | modeM0/AS1A13_068T05_9000006280cztM0_level2_quad_clean.evt |
| Size (bytes) | 420,367,680 | 421,640,640 |
| Size | 400.9 MB | 402.1 MB |
| Events in quadrant A | 2,508,752 | 2,666,640 |
| Events in quadrant B | 2,122,110 | 1,881,502 |
| Events in quadrant C | 2,567,714 | 2,615,426 |
| Events in quadrant D | 2,120,796 | 2,201,685 |
| Mode SS | |||
|---|---|---|---|
| Quadrant | BADHDUFLAG | Total packets | Discarded packets |
| A | 0 | 1002 | 0 |
| B | 0 | 1002 | 0 |
| C | 0 | 1002 | 0 |
| D | 0 | 1002 | 0 |
| Mode M9 | |||
|---|---|---|---|
| Quadrant | BADHDUFLAG | Total packets | Discarded packets |
| A | 0 | 34 | 0 |
| B | 0 | 34 | 0 |
| C | 0 | 34 | 0 |
| D | 0 | 34 | 0 |
| Mode M0 | |||
|---|---|---|---|
| Quadrant | BADHDUFLAG | Total packets | Discarded packets |
| A | 0 | 167661 | 0 |
| B | 0 | 219295 | 0 |
| C | 0 | 104871 | 0 |
| D | 0 | 145882 | 0 |
| Quadrant | Total seconds | Saturated seconds | Saturation percentage |
|---|---|---|---|
| A | 49578 | 1473 | 2.971076% |
| B | 49579 | 13771 | 27.775873% |
| C | 49579 | 512 | 1.032695% |
| D | 49578 | 4377 | 8.828513% |
Noise dominated data is calculated using 1-second bins in cleaned event files. If a bin has >2000 counts, and if more than 50% of those come from <1% of pixels, then it is considered to be noise-dominated and hence unusable.
| Quadrant | # 1 sec bins | Bins with >0 counts | Bins with >2000 counts | High rate bins dominated by noise | Noise dominated (total time) | Noise dominated (detector-on time) | Marked lightcurve |
|---|---|---|---|---|---|---|---|
| A | 58400 | 49576 | 0 | 0 | 0.00% | 0.00% |  |
| B | 58400 | 49478 | 0 | 0 | 0.00% | 0.00% |  |
| C | 58400 | 49573 | 0 | 0 | 0.00% | 0.00% |  |
| D | 58400 | 49457 | 0 | 0 | 0.00% | 0.00% |  |
Top three noisy pixels from each quadrant. If the there are fewer than three noisy pixels in the level2.evt file, extra rows are filled as -1
| Pixel properties | Quadrant properties | ||||||
|---|---|---|---|---|---|---|---|
| Quadrant | DetID | PixID | Counts | Sigma | Mean | Median | Sigma |
| A | 7 | 110 | 2121 | 8.8 | 655 | 609 | 171.8 |
| A | 14 | 95 | 1927 | 7.67 | 655 | 609 | 171.8 |
| A | 0 | 29 | 1913 | 7.59 | 655 | 609 | 171.8 |
| B | 2 | 9 | 1971 | 12.63 | 560 | 530 | 114.1 |
| B | 2 | 8 | 1639 | 9.72 | 560 | 530 | 114.1 |
| B | 3 | 17 | 1549 | 8.93 | 560 | 530 | 114.1 |
| C | 3 | 202 | 1960 | 7.47 | 678 | 627 | 178.5 |
| C | 1 | 81 | 1908 | 7.18 | 678 | 627 | 178.5 |
| C | 1 | 80 | 1884 | 7.04 | 678 | 627 | 178.5 |
| D | 10 | 189 | 1599 | 6.1 | 608 | 549 | 172.1 |
| D | 15 | 47 | 1575 | 5.96 | 608 | 549 | 172.1 |
| D | 12 | 6 | 1536 | 5.73 | 608 | 549 | 172.1 |
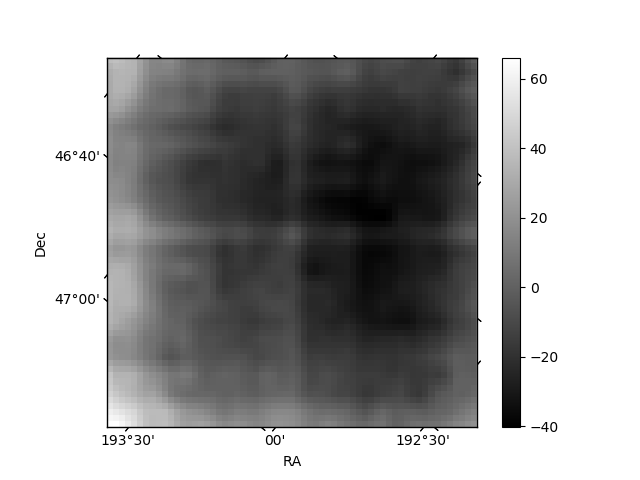
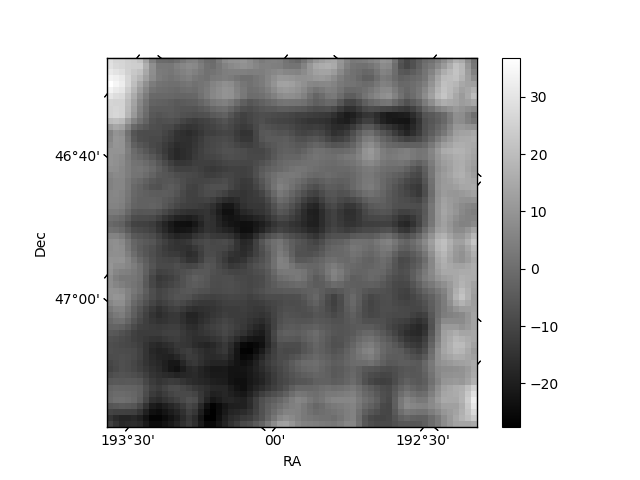
Histogram calculated using DETX and DETY for each event in the final _common_clean file
| Quadrant A | 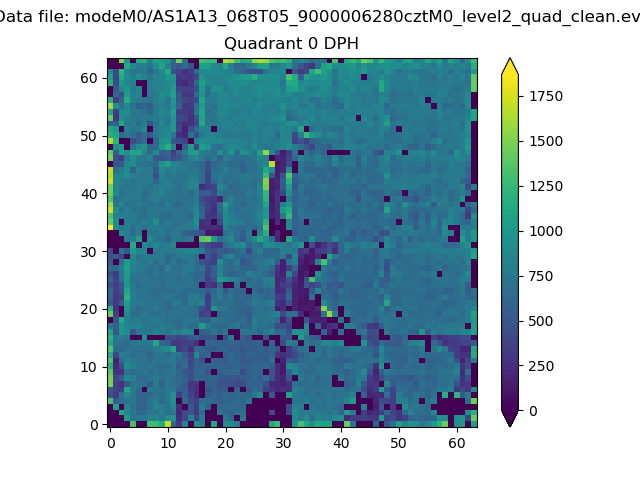 |
 |
Quadrant B |
|---|---|---|---|
| Quadrant D | 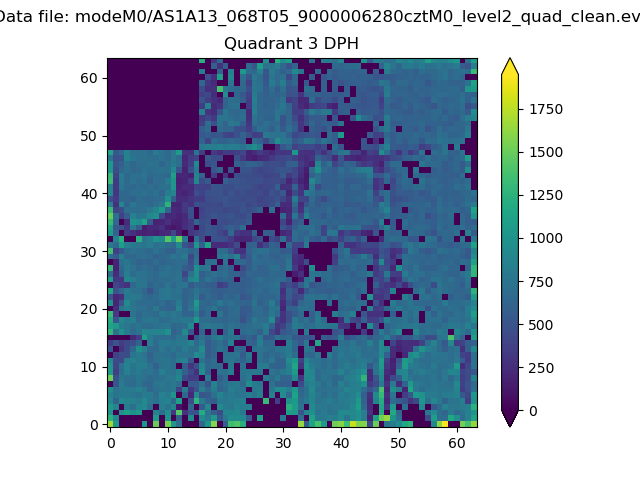 |
 |
Quadrant C |
| Plot type | Count rate plots | Images |
|---|---|---|
| Comparison with Poisson distribution Blue bars denote a histogram of data divided into 1 sec bins. Red curve is a Poisson curve with rate = median count rate of data. |
 |
 |
| Quadrant-wise count rates Data is divided into 100 sec bins |
 |
|
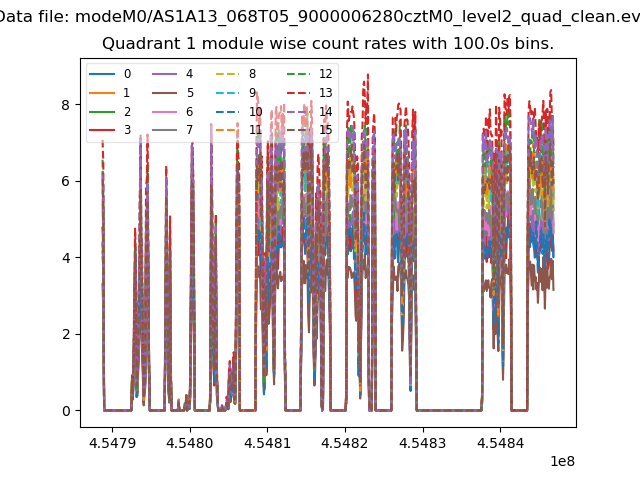
| Module-wise count rates for Quadrant A Data is divided into 100 sec bins |
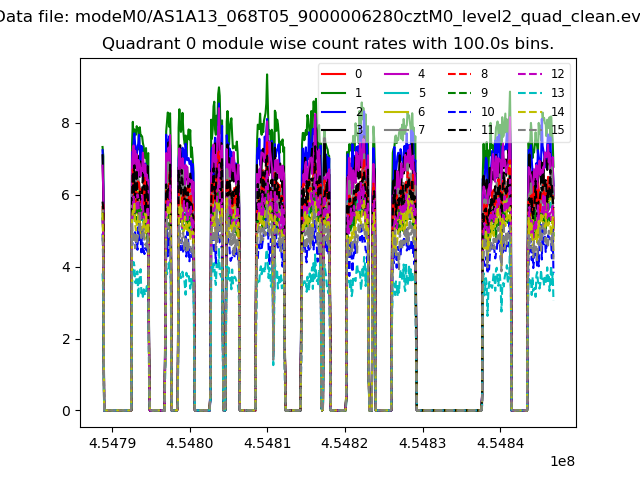 |
 |
| Module-wise count rates for Quadrant B Data is divided into 100 sec bins |
 |
 |
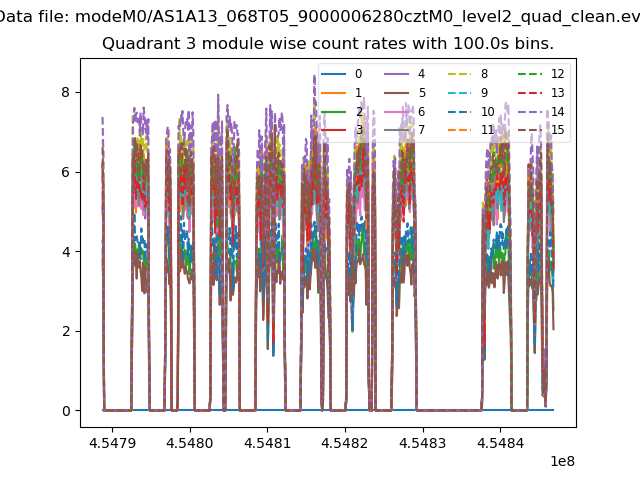
| Module-wise count rates for Quadrant C Data is divided into 100 sec bins |
 |
 |
| Module-wise count rates for Quadrant D Data is divided into 100 sec bins |
 |
 |
| Parameter | Plot |
|---|---|
| CZT HV Monitor | 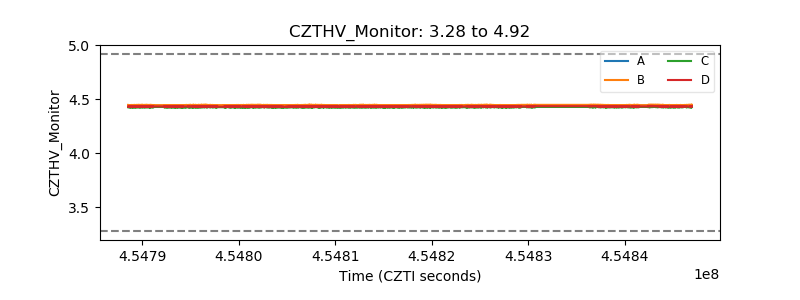 |
| D_VDD | 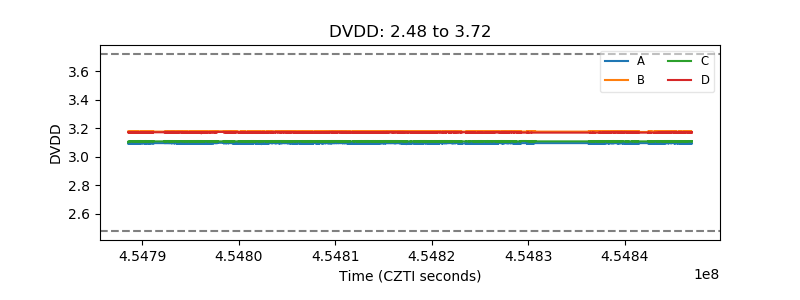 |
| Temperature 1 |  |
| Veto HV Monitor |  |
| Veto LLD |  |
| Alpha Counter |  |
| _CPM_Rate | 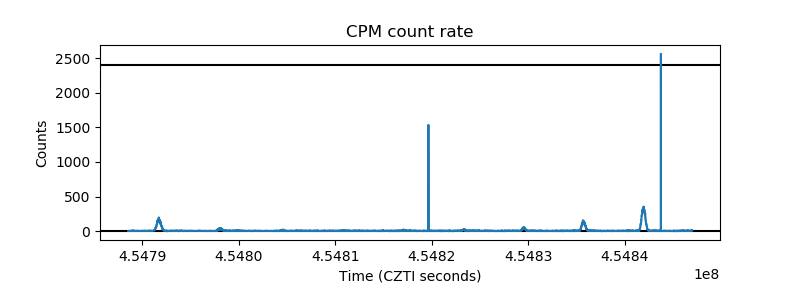 |
| CZT Counter |  |
| +2.5 Volts monitor |  |
| +5 Volts monitor | 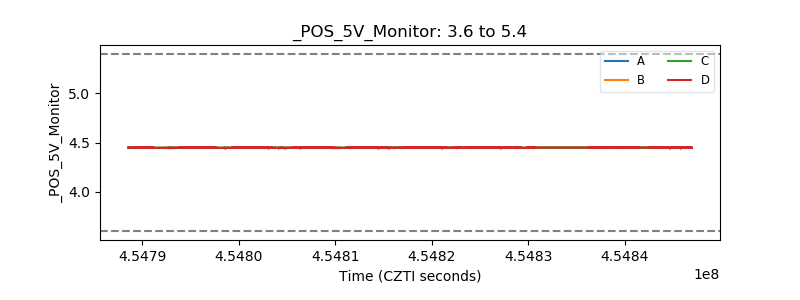 |
| _ROLL_ROT | 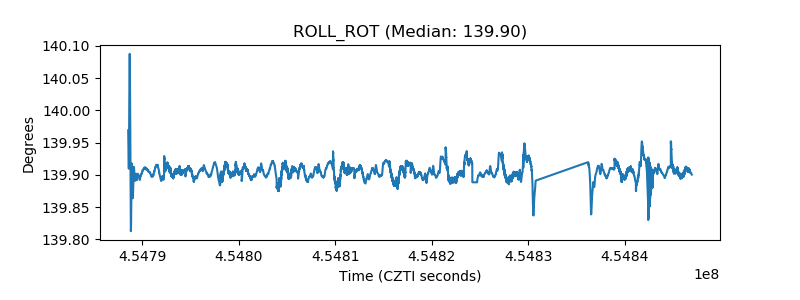 |
| _Roll_DEC |  |
| _Roll_RA | 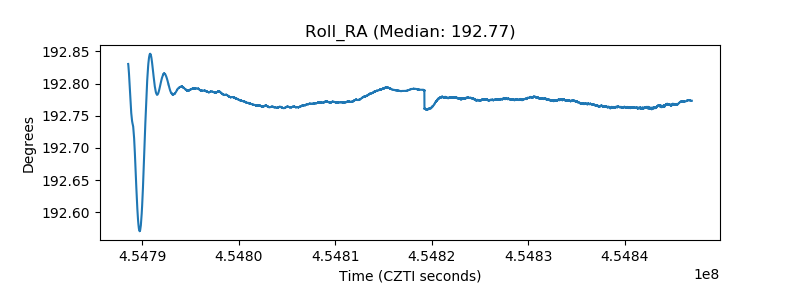 |
| Veto Counter | 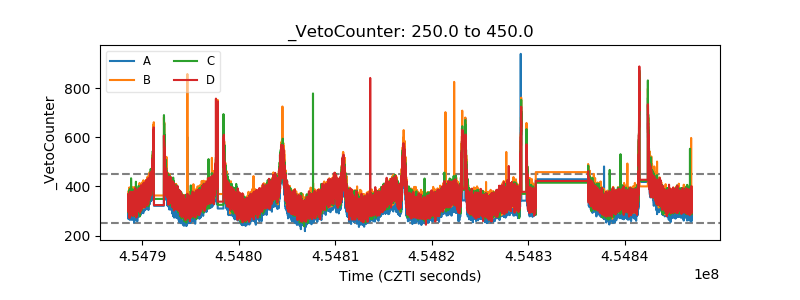 |