| Param | Original file | Final file |
|---|---|---|
| Filename | modeM0/AS1T05_206T01_9000006276cztM0_level2.fits | modeM0/AS1T05_206T01_9000006276cztM0_level2_quad_clean.evt |
| Size (bytes) | 138,493,440 | 134,619,840 |
| Size | 132.1 MB | 128.4 MB |
| Events in quadrant A | 819,194 | 837,753 |
| Events in quadrant B | 710,212 | 558,077 |
| Events in quadrant C | 833,250 | 823,468 |
| Events in quadrant D | 697,224 | 725,048 |
| Mode M0 | |||
|---|---|---|---|
| Quadrant | BADHDUFLAG | Total packets | Discarded packets |
| A | 0 | 53741 | 0 |
| B | 0 | 72720 | 0 |
| C | 0 | 34609 | 0 |
| D | 0 | 43840 | 0 |
| Mode SS | |||
|---|---|---|---|
| Quadrant | BADHDUFLAG | Total packets | Discarded packets |
| A | 0 | 332 | 0 |
| B | 0 | 332 | 0 |
| C | 0 | 332 | 0 |
| D | 0 | 332 | 0 |
| Mode M9 | |||
|---|---|---|---|
| Quadrant | BADHDUFLAG | Total packets | Discarded packets |
| A | 0 | 5 | 0 |
| B | 0 | 5 | 0 |
| C | 0 | 5 | 0 |
| D | 0 | 5 | 0 |
| Quadrant | Total seconds | Saturated seconds | Saturation percentage |
|---|---|---|---|
| A | 16407 | 575 | 3.504602% |
| B | 16407 | 4418 | 26.927531% |
| C | 16407 | 246 | 1.499360% |
| D | 16407 | 1139 | 6.942159% |
Noise dominated data is calculated using 1-second bins in cleaned event files. If a bin has >2000 counts, and if more than 50% of those come from <1% of pixels, then it is considered to be noise-dominated and hence unusable.
| Quadrant | # 1 sec bins | Bins with >0 counts | Bins with >2000 counts | High rate bins dominated by noise | Noise dominated (total time) | Noise dominated (detector-on time) | Marked lightcurve |
|---|---|---|---|---|---|---|---|
| A | 16912 | 16405 | 0 | 0 | 0.00% | 0.00% | 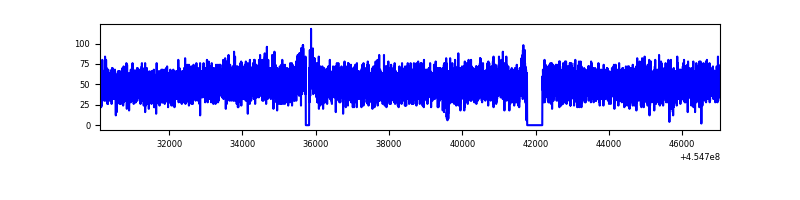 |
| B | 16912 | 16401 | 0 | 0 | 0.00% | 0.00% | 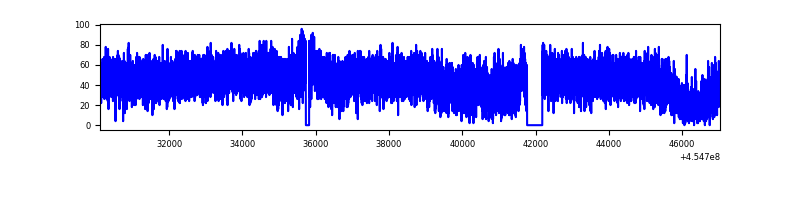 |
| C | 16912 | 16408 | 0 | 0 | 0.00% | 0.00% | 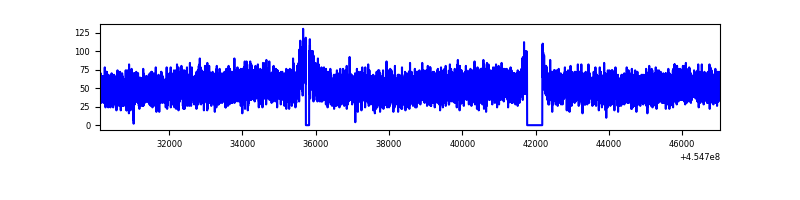 |
| D | 16911 | 16378 | 0 | 0 | 0.00% | 0.00% | 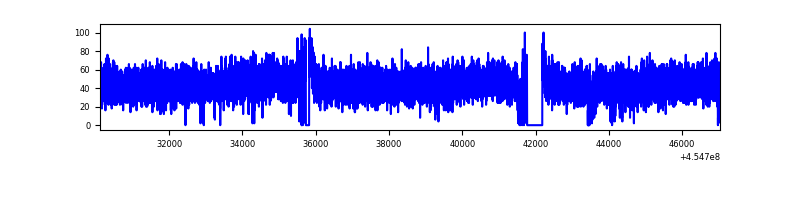 |
Top three noisy pixels from each quadrant. If the there are fewer than three noisy pixels in the level2.evt file, extra rows are filled as -1
| Pixel properties | Quadrant properties | ||||||
|---|---|---|---|---|---|---|---|
| Quadrant | DetID | PixID | Counts | Sigma | Mean | Median | Sigma |
| A | 7 | 110 | 661 | 7.99 | 213 | 198 | 57.9 |
| A | 14 | 95 | 623 | 7.33 | 213 | 198 | 57.9 |
| A | 15 | 174 | 592 | 6.8 | 213 | 198 | 57.9 |
| B | 2 | 9 | 695 | 13.21 | 186 | 177 | 39.2 |
| B | 2 | 8 | 549 | 9.49 | 186 | 177 | 39.2 |
| B | 3 | 17 | 497 | 8.16 | 186 | 177 | 39.2 |
| C | 3 | 202 | 637 | 7.23 | 220 | 204 | 59.9 |
| C | 3 | 203 | 616 | 6.88 | 220 | 204 | 59.9 |
| C | 1 | 81 | 603 | 6.66 | 220 | 204 | 59.9 |
| D | 15 | 47 | 514 | 5.83 | 199 | 181 | 57.1 |
| D | 4 | 16 | 500 | 5.58 | 199 | 181 | 57.1 |
| D | 15 | 63 | 497 | 5.53 | 199 | 181 | 57.1 |
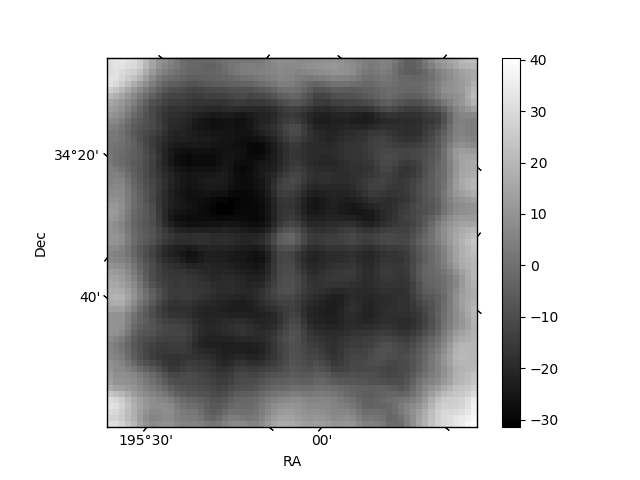
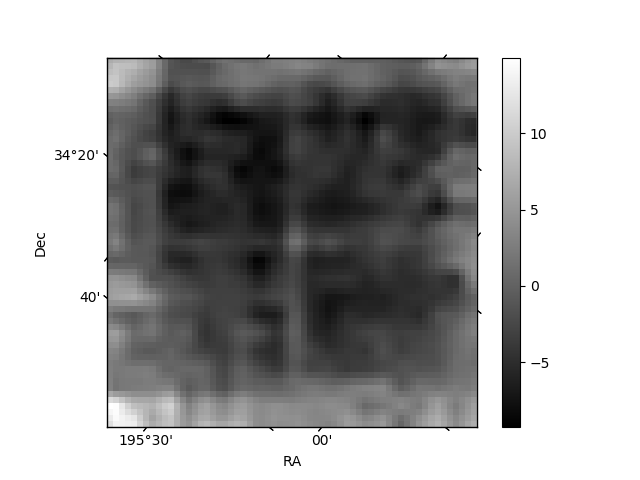
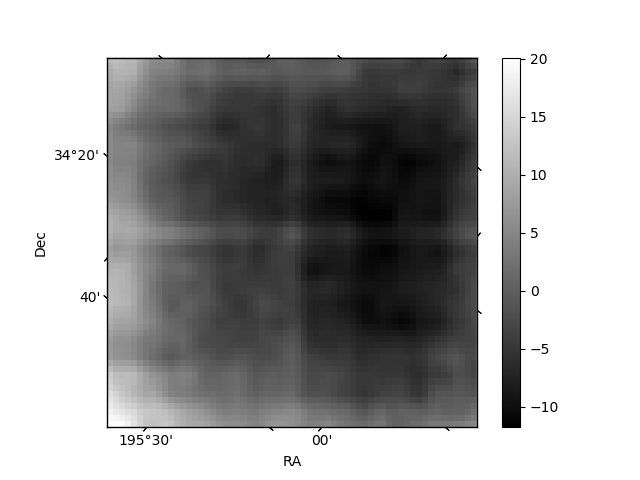
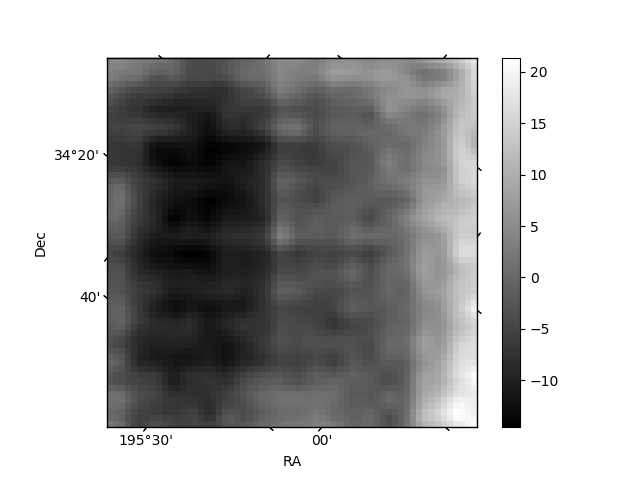
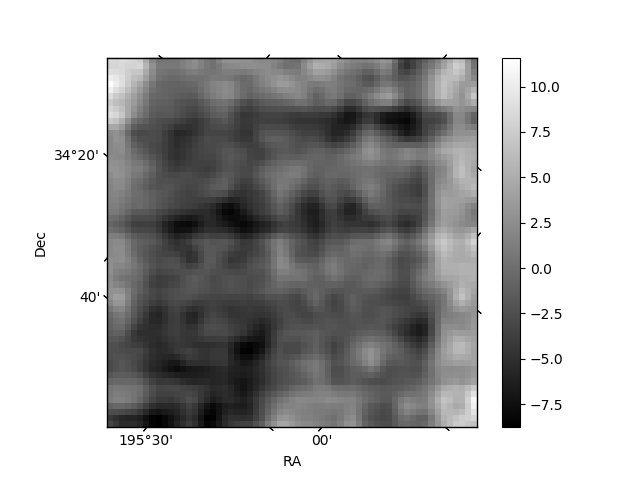
Histogram calculated using DETX and DETY for each event in the final _common_clean file
| Quadrant A | 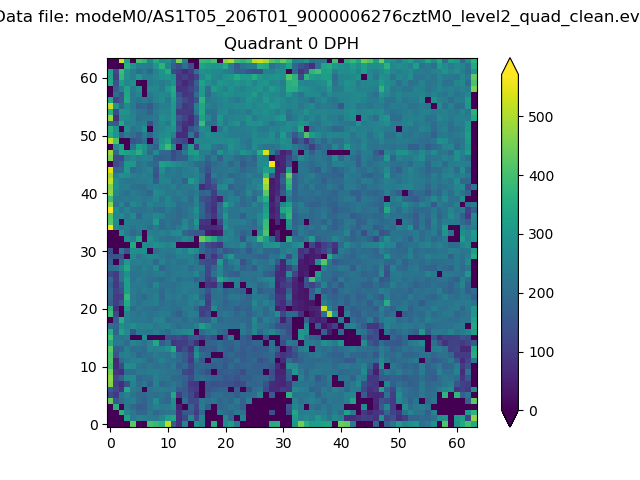 |
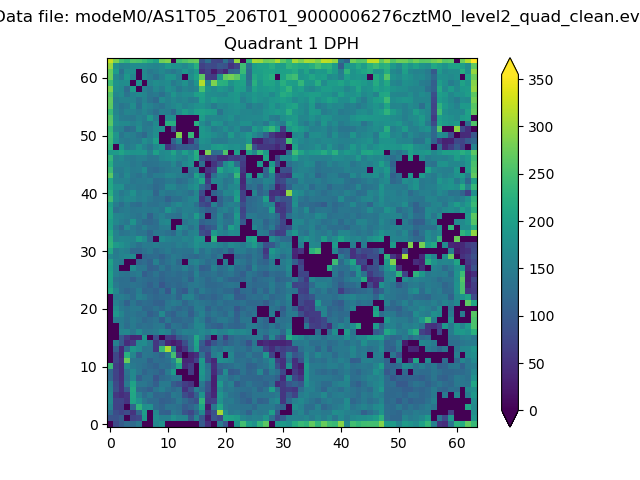 |
Quadrant B |
|---|---|---|---|
| Quadrant D | 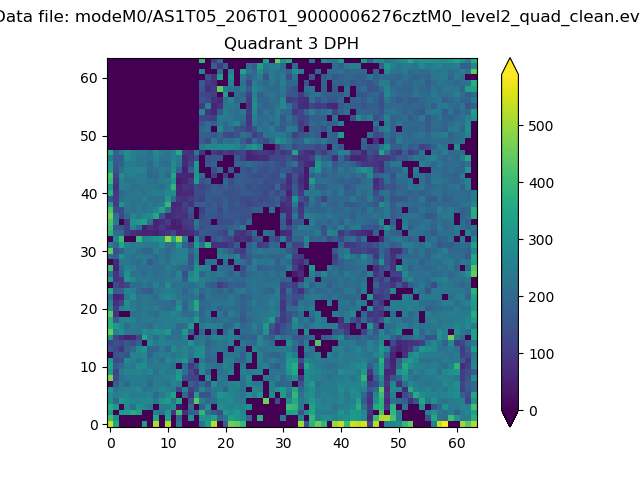 |
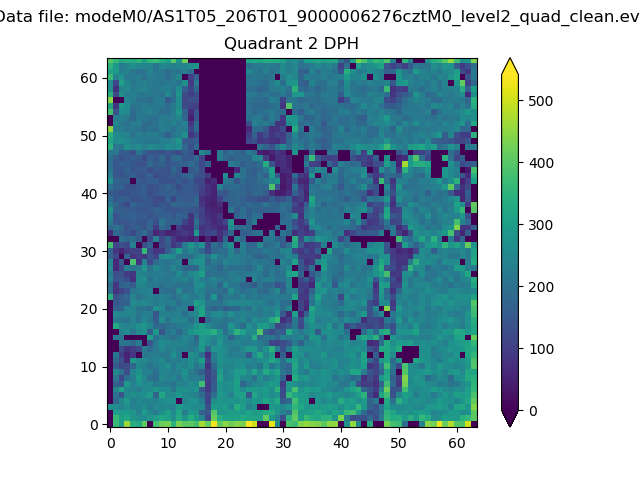 |
Quadrant C |
| Plot type | Count rate plots | Images |
|---|---|---|
| Comparison with Poisson distribution Blue bars denote a histogram of data divided into 1 sec bins. Red curve is a Poisson curve with rate = median count rate of data. |
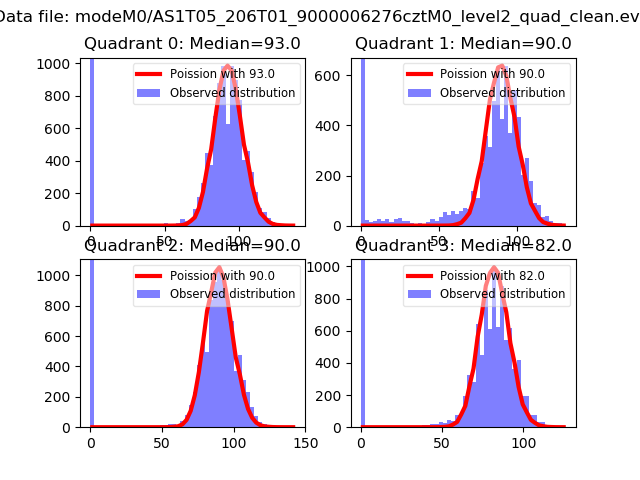 |
 |
| Quadrant-wise count rates Data is divided into 100 sec bins |
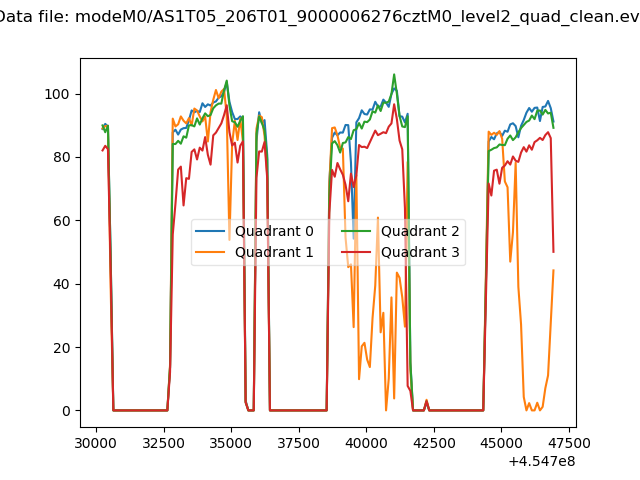 |
|
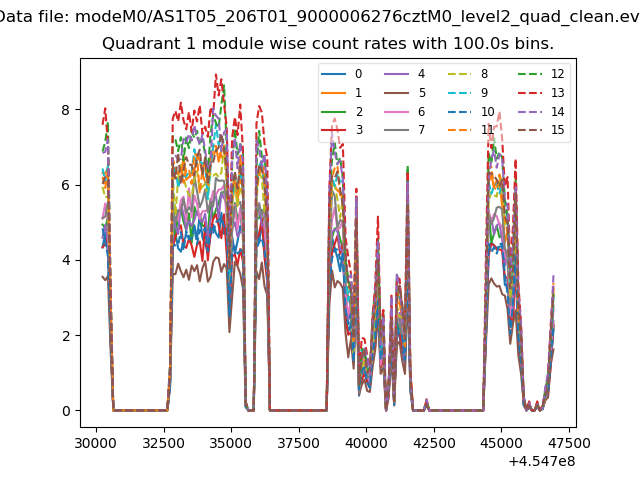
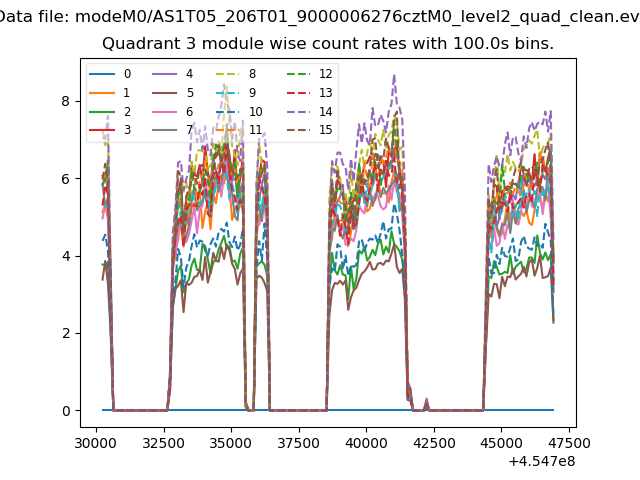
| Module-wise count rates for Quadrant A Data is divided into 100 sec bins |
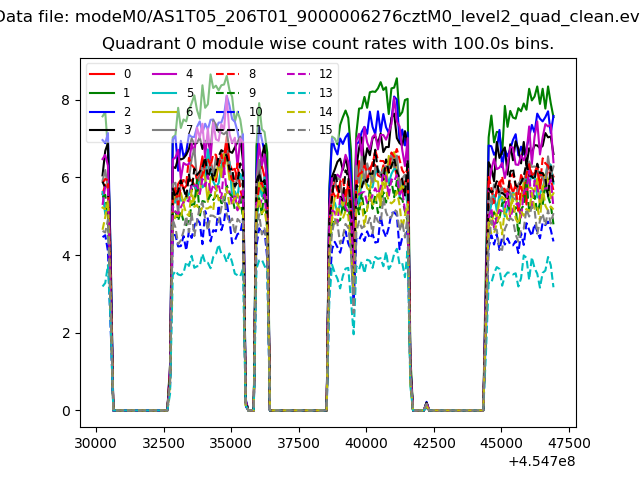 |
 |
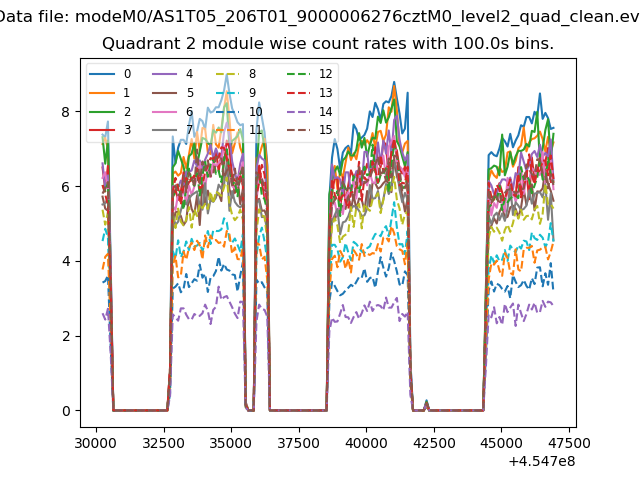
| Module-wise count rates for Quadrant B Data is divided into 100 sec bins |
 |
 |
| Module-wise count rates for Quadrant C Data is divided into 100 sec bins |
 |
 |
| Module-wise count rates for Quadrant D Data is divided into 100 sec bins |
 |
 |
| Parameter | Plot |
|---|---|
| CZT HV Monitor | 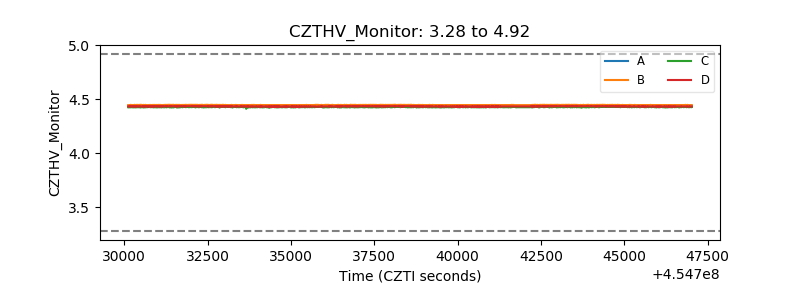 |
| D_VDD | 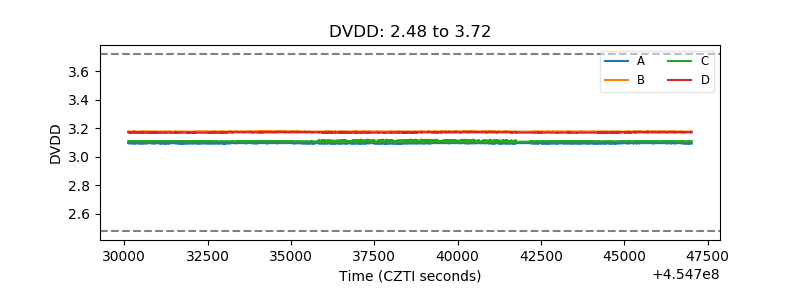 |
| Temperature 1 | 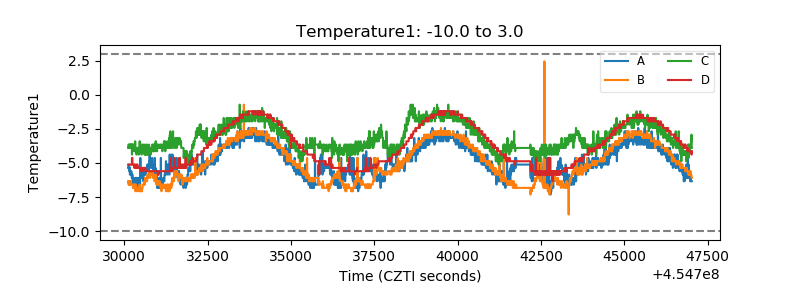 |
| Veto HV Monitor | 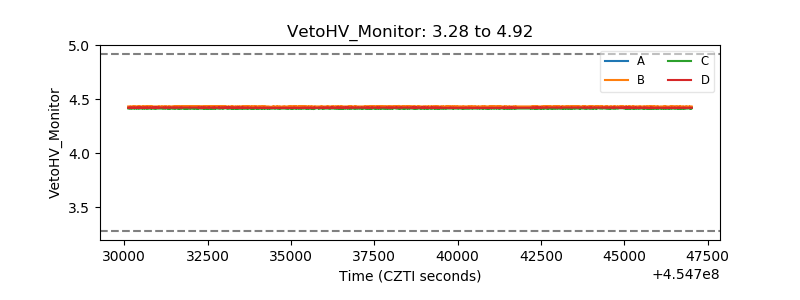 |
| Veto LLD | 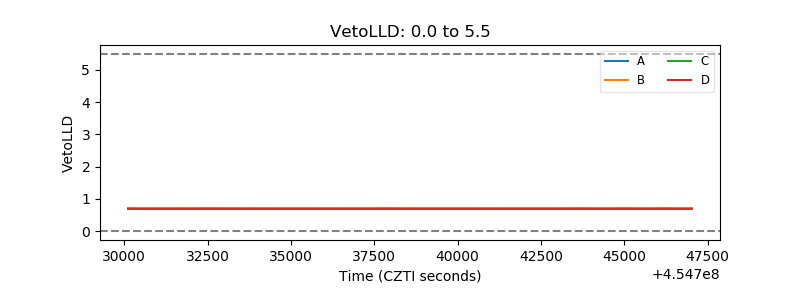 |
| Alpha Counter | 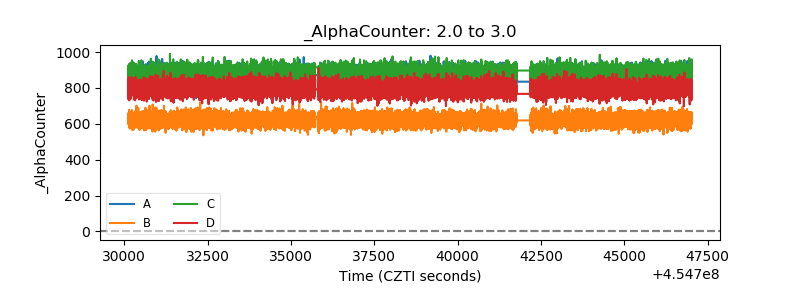 |
| _CPM_Rate | 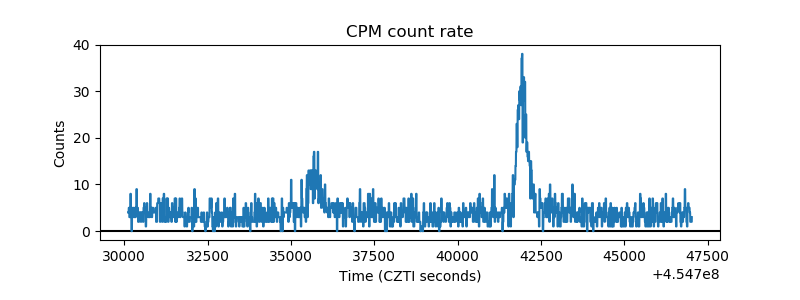 |
| CZT Counter | 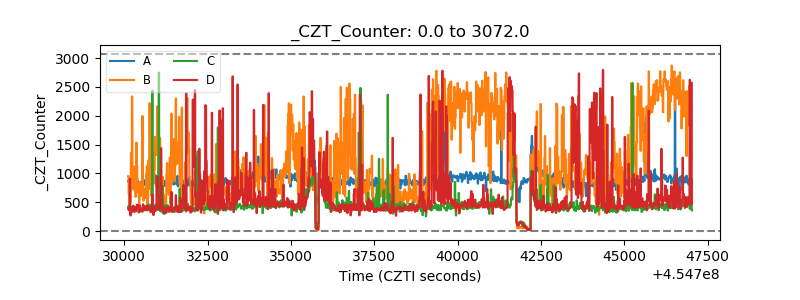 |
| +2.5 Volts monitor | 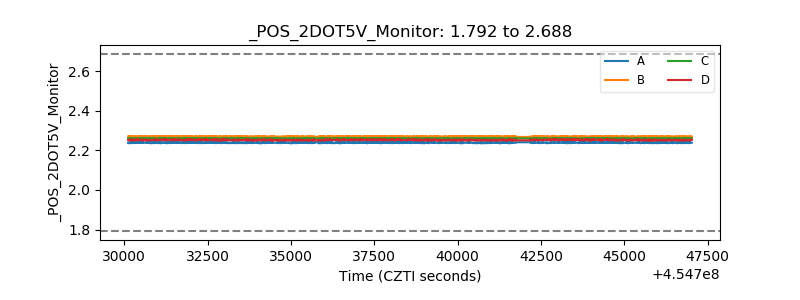 |
| +5 Volts monitor | 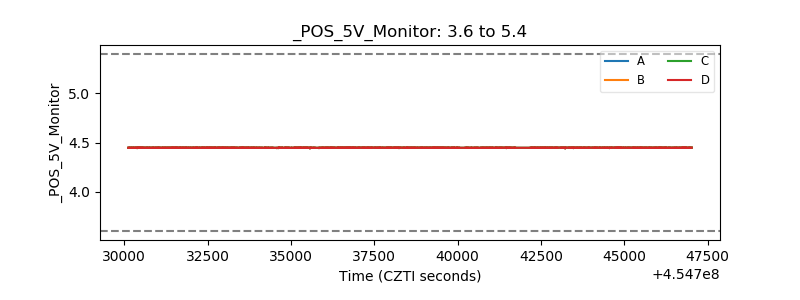 |
| _ROLL_ROT | 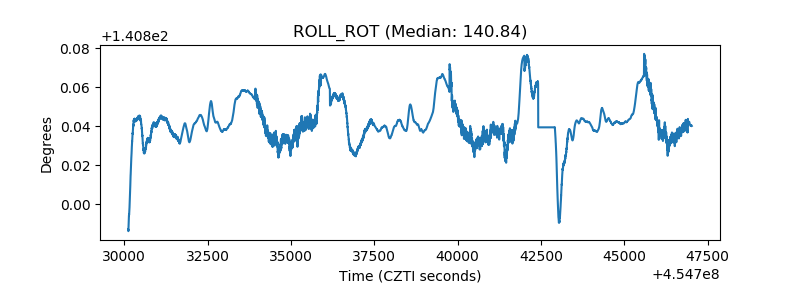 |
| _Roll_DEC | 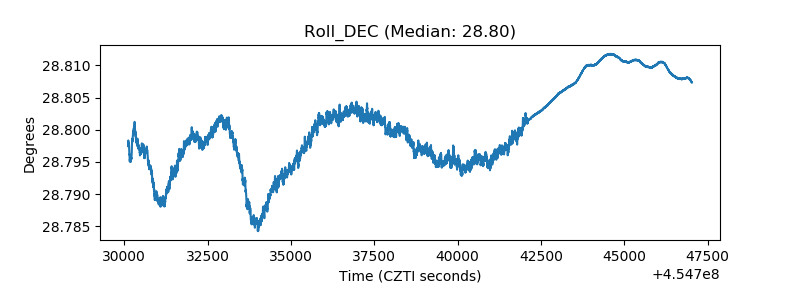 |
| _Roll_RA | 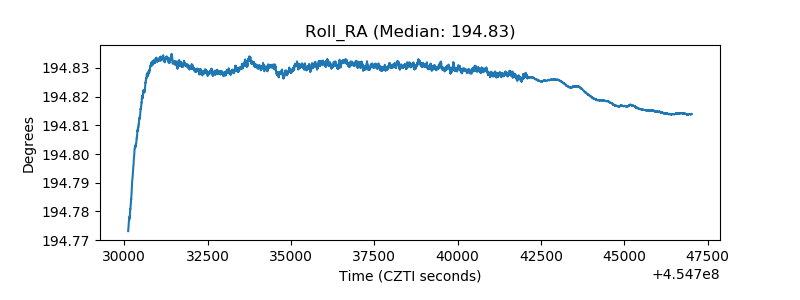 |
| Veto Counter | 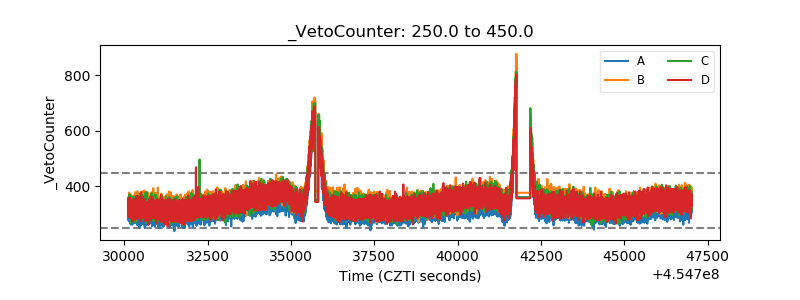 |