| Param | Original file | Final file |
|---|---|---|
| Filename | modeM0/AS1A13_053T01_9000006282cztM0_level2.fits | modeM0/AS1A13_053T01_9000006282cztM0_level2_quad_clean.evt |
| Size (bytes) | 659,833,920 | 697,178,880 |
| Size | 629.3 MB | 664.9 MB |
| Events in quadrant A | 3,938,030 | 4,280,271 |
| Events in quadrant B | 3,464,208 | 3,814,449 |
| Events in quadrant C | 3,995,642 | 4,197,149 |
| Events in quadrant D | 3,313,284 | 3,562,272 |
| Mode SS | |||
|---|---|---|---|
| Quadrant | BADHDUFLAG | Total packets | Discarded packets |
| A | 0 | 1552 | 0 |
| B | 0 | 1552 | 0 |
| C | 0 | 1552 | 0 |
| D | 0 | 1552 | 0 |
| Mode M0 | |||
|---|---|---|---|
| Quadrant | BADHDUFLAG | Total packets | Discarded packets |
| A | 0 | 258784 | 0 |
| B | 0 | 348983 | 0 |
| C | 0 | 157330 | 0 |
| D | 0 | 223883 | 0 |
| Mode M9 | |||
|---|---|---|---|
| Quadrant | BADHDUFLAG | Total packets | Discarded packets |
| A | 0 | 89 | 0 |
| B | 0 | 89 | 0 |
| C | 0 | 89 | 0 |
| D | 0 | 89 | 0 |
| Quadrant | Total seconds | Saturated seconds | Saturation percentage |
|---|---|---|---|
| A | 76709 | 2579 | 3.362057% |
| B | 76709 | 19035 | 24.814559% |
| C | 76710 | 594 | 0.774345% |
| D | 76710 | 6712 | 8.749837% |
Noise dominated data is calculated using 1-second bins in cleaned event files. If a bin has >2000 counts, and if more than 50% of those come from <1% of pixels, then it is considered to be noise-dominated and hence unusable.
| Quadrant | # 1 sec bins | Bins with >0 counts | Bins with >2000 counts | High rate bins dominated by noise | Noise dominated (total time) | Noise dominated (detector-on time) | Marked lightcurve |
|---|---|---|---|---|---|---|---|
| A | 85474 | 76700 | 0 | 0 | 0.00% | 0.00% |  |
| B | 85474 | 76685 | 0 | 0 | 0.00% | 0.00% |  |
| C | 85475 | 76705 | 0 | 0 | 0.00% | 0.00% |  |
| D | 85475 | 76615 | 0 | 0 | 0.00% | 0.00% |  |
Top three noisy pixels from each quadrant. If the there are fewer than three noisy pixels in the level2.evt file, extra rows are filled as -1
| Pixel properties | Quadrant properties | ||||||
|---|---|---|---|---|---|---|---|
| Quadrant | DetID | PixID | Counts | Sigma | Mean | Median | Sigma |
| A | 7 | 110 | 3196 | 8.5 | 1027 | 959 | 263.1 |
| A | 0 | 29 | 3001 | 7.76 | 1027 | 959 | 263.1 |
| A | 14 | 95 | 2979 | 7.68 | 1027 | 959 | 263.1 |
| B | 2 | 9 | 3305 | 13.56 | 914 | 870 | 179.6 |
| B | 2 | 8 | 2653 | 9.93 | 914 | 870 | 179.6 |
| B | 3 | 17 | 2474 | 8.93 | 914 | 870 | 179.6 |
| C | 3 | 202 | 3032 | 7.47 | 1055 | 980 | 274.7 |
| C | 1 | 81 | 3004 | 7.37 | 1055 | 980 | 274.7 |
| C | 3 | 203 | 2975 | 7.26 | 1055 | 980 | 274.7 |
| D | 10 | 189 | 2475 | 6.1 | 951 | 863 | 264.3 |
| D | 6 | 38 | 2447 | 5.99 | 951 | 863 | 264.3 |
| D | 4 | 16 | 2403 | 5.83 | 951 | 863 | 264.3 |
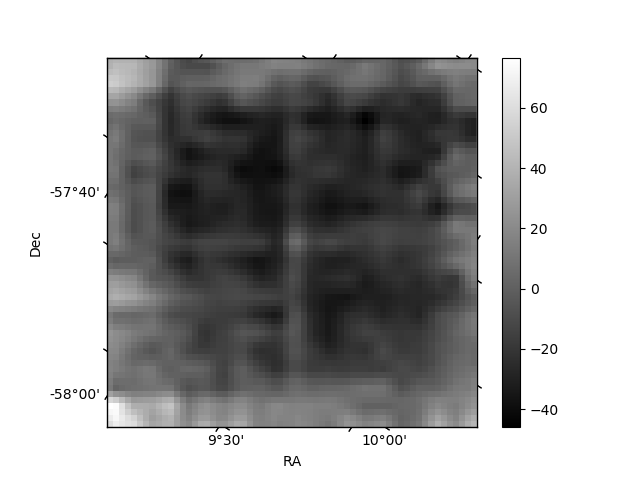
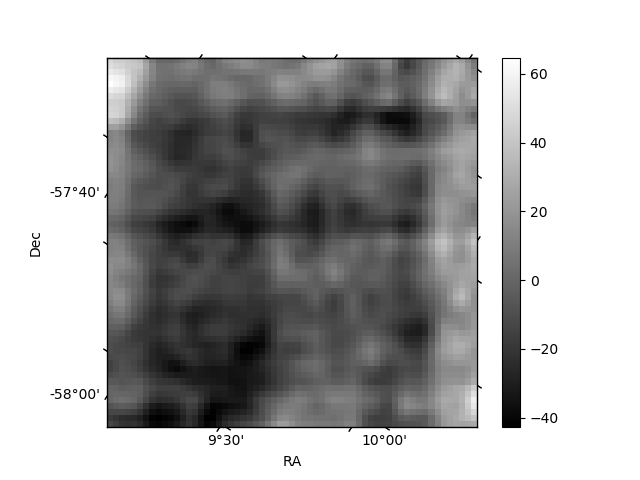
Histogram calculated using DETX and DETY for each event in the final _common_clean file
| Quadrant A |  |
 |
Quadrant B |
|---|---|---|---|
| Quadrant D |  |
 |
Quadrant C |
| Plot type | Count rate plots | Images |
|---|---|---|
| Comparison with Poisson distribution Blue bars denote a histogram of data divided into 1 sec bins. Red curve is a Poisson curve with rate = median count rate of data. |
 |
 |
| Quadrant-wise count rates Data is divided into 100 sec bins |
 |
|
| Module-wise count rates for Quadrant A Data is divided into 100 sec bins |
 |
 |
| Module-wise count rates for Quadrant B Data is divided into 100 sec bins |
 |
 |
| Module-wise count rates for Quadrant C Data is divided into 100 sec bins |
 |
 |
| Module-wise count rates for Quadrant D Data is divided into 100 sec bins |
 |
 |
| Parameter | Plot |
|---|---|
| CZT HV Monitor |  |
| D_VDD |  |
| Temperature 1 |  |
| Veto HV Monitor |  |
| Veto LLD |  |
| Alpha Counter |  |
| _CPM_Rate |  |
| CZT Counter |  |
| +2.5 Volts monitor |  |
| +5 Volts monitor |  |
| _ROLL_ROT |  |
| _Roll_DEC |  |
| _Roll_RA |  |
| Veto Counter |  |