| Param | Original file | Final file |
|---|---|---|
| Filename | modeM0/AS1A13_070T06_9000006288cztM0_level2.fits | modeM0/AS1A13_070T06_9000006288cztM0_level2_quad_clean.evt |
| Size (bytes) | 200,782,080 | 193,403,520 |
| Size | 191.5 MB | 184.4 MB |
| Events in quadrant A | 1,162,874 | 1,105,408 |
| Events in quadrant B | 1,116,272 | 1,078,587 |
| Events in quadrant C | 1,195,080 | 1,105,707 |
| Events in quadrant D | 1,028,700 | 989,828 |
| Mode M9 | |||
|---|---|---|---|
| Quadrant | BADHDUFLAG | Total packets | Discarded packets |
| A | 0 | 7 | 0 |
| B | 0 | 7 | 0 |
| C | 0 | 7 | 0 |
| D | 0 | 7 | 0 |
| Mode SS | |||
|---|---|---|---|
| Quadrant | BADHDUFLAG | Total packets | Discarded packets |
| A | 0 | 462 | 0 |
| B | 0 | 462 | 0 |
| C | 0 | 462 | 0 |
| D | 0 | 462 | 0 |
| Mode M0 | |||
|---|---|---|---|
| Quadrant | BADHDUFLAG | Total packets | Discarded packets |
| A | 0 | 76856 | 0 |
| B | 0 | 66221 | 0 |
| C | 0 | 49132 | 0 |
| D | 0 | 53249 | 0 |
| Quadrant | Total seconds | Saturated seconds | Saturation percentage |
|---|---|---|---|
| A | 22911 | 701 | 3.059666% |
| B | 22911 | 1494 | 6.520885% |
| C | 22911 | 184 | 0.803108% |
| D | 22911 | 617 | 2.693030% |
Noise dominated data is calculated using 1-second bins in cleaned event files. If a bin has >2000 counts, and if more than 50% of those come from <1% of pixels, then it is considered to be noise-dominated and hence unusable.
| Quadrant | # 1 sec bins | Bins with >0 counts | Bins with >2000 counts | High rate bins dominated by noise | Noise dominated (total time) | Noise dominated (detector-on time) | Marked lightcurve |
|---|---|---|---|---|---|---|---|
| A | 23631 | 22911 | 0 | 0 | 0.00% | 0.00% |  |
| B | 23630 | 22910 | 0 | 0 | 0.00% | 0.00% |  |
| C | 23631 | 22890 | 0 | 0 | 0.00% | 0.00% |  |
| D | 23631 | 22900 | 0 | 0 | 0.00% | 0.00% |  |
Top three noisy pixels from each quadrant. If the there are fewer than three noisy pixels in the level2.evt file, extra rows are filled as -1
| Pixel properties | Quadrant properties | ||||||
|---|---|---|---|---|---|---|---|
| Quadrant | DetID | PixID | Counts | Sigma | Mean | Median | Sigma |
| A | 7 | 110 | 942 | 8.06 | 303 | 283 | 81.8 |
| A | 14 | 95 | 921 | 7.8 | 303 | 283 | 81.8 |
| A | 0 | 29 | 908 | 7.64 | 303 | 283 | 81.8 |
| B | 2 | 9 | 1102 | 13.59 | 294 | 279 | 60.6 |
| B | 2 | 8 | 898 | 10.22 | 294 | 279 | 60.6 |
| B | 3 | 17 | 843 | 9.31 | 294 | 279 | 60.6 |
| C | 3 | 202 | 942 | 7.62 | 315 | 291 | 85.4 |
| C | 1 | 81 | 941 | 7.61 | 315 | 291 | 85.4 |
| C | 1 | 80 | 896 | 7.08 | 315 | 291 | 85.4 |
| D | 15 | 47 | 767 | 5.94 | 294 | 266 | 84.4 |
| D | 4 | 12 | 745 | 5.67 | 294 | 266 | 84.4 |
| D | 10 | 189 | 718 | 5.35 | 294 | 266 | 84.4 |
Histogram calculated using DETX and DETY for each event in the final _common_clean file
| Quadrant A | 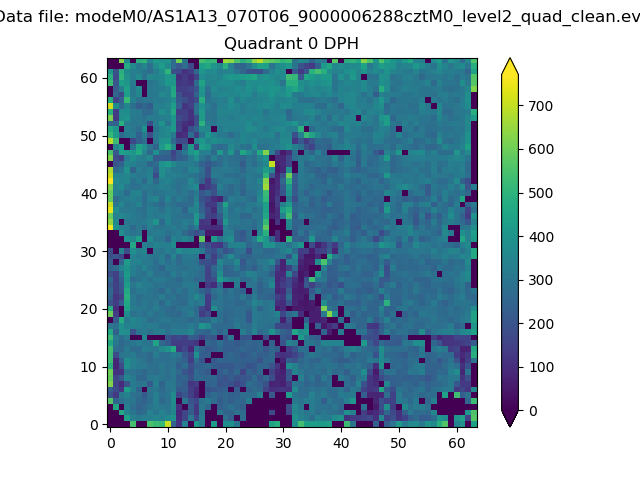 |
 |
Quadrant B |
|---|---|---|---|
| Quadrant D |  |
 |
Quadrant C |
| Plot type | Count rate plots | Images |
|---|---|---|
| Comparison with Poisson distribution Blue bars denote a histogram of data divided into 1 sec bins. Red curve is a Poisson curve with rate = median count rate of data. |
 |
 |
| Quadrant-wise count rates Data is divided into 100 sec bins |
 |
|
| Module-wise count rates for Quadrant A Data is divided into 100 sec bins |
 |
 |
| Module-wise count rates for Quadrant B Data is divided into 100 sec bins |
 |
 |
| Module-wise count rates for Quadrant C Data is divided into 100 sec bins |
 |
 |
| Module-wise count rates for Quadrant D Data is divided into 100 sec bins |
 |
 |
| Parameter | Plot |
|---|---|
| CZT HV Monitor |  |
| D_VDD |  |
| Temperature 1 |  |
| Veto HV Monitor |  |
| Veto LLD |  |
| Alpha Counter |  |
| _CPM_Rate |  |
| CZT Counter |  |
| +2.5 Volts monitor |  |
| +5 Volts monitor |  |
| _ROLL_ROT | 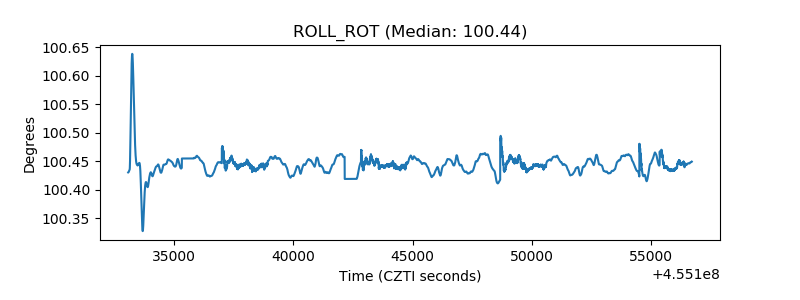 |
| _Roll_DEC |  |
| _Roll_RA |  |
| Veto Counter |  |