| Param | Original file | Final file |
|---|---|---|
| Filename | modeM0/AS1A13_071T07_9000006290cztM0_level2.fits | modeM0/AS1A13_071T07_9000006290cztM0_level2_quad_clean.evt |
| Size (bytes) | 606,890,880 | 877,357,440 |
| Size | 578.8 MB | 836.7 MB |
| Events in quadrant A | 3,564,782 | 5,796,908 |
| Events in quadrant B | 3,308,586 | 5,266,060 |
| Events in quadrant C | 3,624,874 | 5,685,452 |
| Events in quadrant D | 3,032,676 | 4,983,558 |
| Mode SS | |||
|---|---|---|---|
| Quadrant | BADHDUFLAG | Total packets | Discarded packets |
| A | 0 | 1430 | 0 |
| B | 0 | 1430 | 0 |
| C | 0 | 1430 | 0 |
| D | 0 | 1430 | 0 |
| Mode M0 | |||
|---|---|---|---|
| Quadrant | BADHDUFLAG | Total packets | Discarded packets |
| A | 0 | 249676 | 0 |
| B | 0 | 262703 | 0 |
| C | 0 | 150718 | 0 |
| D | 0 | 204188 | 0 |
| Mode M9 | |||
|---|---|---|---|
| Quadrant | BADHDUFLAG | Total packets | Discarded packets |
| A | 0 | 73 | 0 |
| B | 0 | 73 | 0 |
| C | 0 | 73 | 0 |
| D | 0 | 73 | 0 |
| Quadrant | Total seconds | Saturated seconds | Saturation percentage |
|---|---|---|---|
| A | 70601 | 2414 | 3.419215% |
| B | 70607 | 10041 | 14.220970% |
| C | 70606 | 577 | 0.817211% |
| D | 70608 | 4778 | 6.766939% |
Noise dominated data is calculated using 1-second bins in cleaned event files. If a bin has >2000 counts, and if more than 50% of those come from <1% of pixels, then it is considered to be noise-dominated and hence unusable.
| Quadrant | # 1 sec bins | Bins with >0 counts | Bins with >2000 counts | High rate bins dominated by noise | Noise dominated (total time) | Noise dominated (detector-on time) | Marked lightcurve |
|---|---|---|---|---|---|---|---|
| A | 91735 | 70605 | 0 | 0 | 0.00% | 0.00% |  |
| B | 91736 | 70599 | 0 | 0 | 0.00% | 0.00% |  |
| C | 91736 | 70605 | 0 | 0 | 0.00% | 0.00% |  |
| D | 91735 | 70567 | 0 | 0 | 0.00% | 0.00% |  |
Top three noisy pixels from each quadrant. If the there are fewer than three noisy pixels in the level2.evt file, extra rows are filled as -1
| Pixel properties | Quadrant properties | ||||||
|---|---|---|---|---|---|---|---|
| Quadrant | DetID | PixID | Counts | Sigma | Mean | Median | Sigma |
| A | 7 | 110 | 2865 | 8.33 | 929 | 867 | 239.8 |
| A | 14 | 95 | 2754 | 7.87 | 929 | 867 | 239.8 |
| A | 0 | 29 | 2626 | 7.34 | 929 | 867 | 239.8 |
| B | 2 | 9 | 3130 | 13.64 | 874 | 835 | 168.3 |
| B | 2 | 8 | 2501 | 9.9 | 874 | 835 | 168.3 |
| B | 3 | 17 | 2343 | 8.96 | 874 | 835 | 168.3 |
| C | 3 | 202 | 2784 | 7.54 | 959 | 893 | 250.8 |
| C | 3 | 203 | 2735 | 7.34 | 959 | 893 | 250.8 |
| C | 1 | 81 | 2730 | 7.32 | 959 | 893 | 250.8 |
| D | 10 | 189 | 2234 | 5.97 | 869 | 790 | 241.9 |
| D | 10 | 113 | 2192 | 5.8 | 869 | 790 | 241.9 |
| D | 6 | 38 | 2189 | 5.78 | 869 | 790 | 241.9 |
Histogram calculated using DETX and DETY for each event in the final _common_clean file
| Quadrant A | 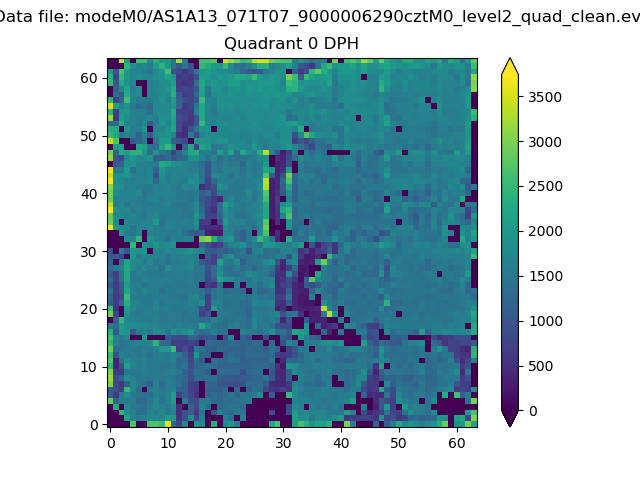 |
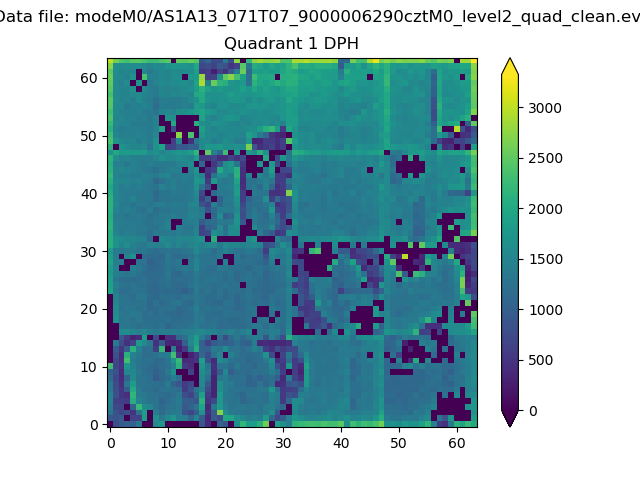 |
Quadrant B |
|---|---|---|---|
| Quadrant D |  |
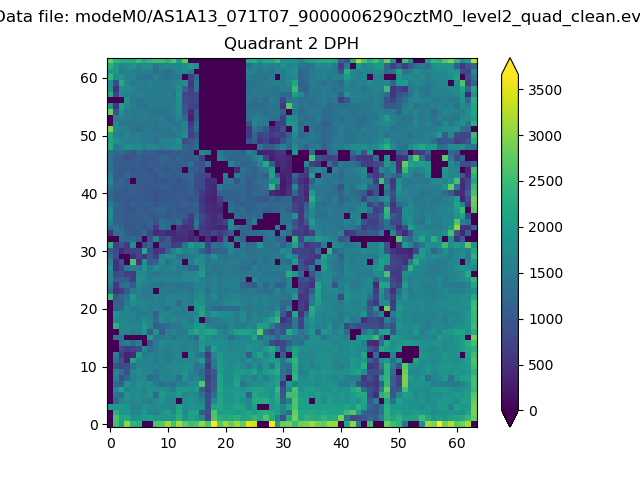 |
Quadrant C |
| Plot type | Count rate plots | Images |
|---|---|---|
| Comparison with Poisson distribution Blue bars denote a histogram of data divided into 1 sec bins. Red curve is a Poisson curve with rate = median count rate of data. |
 |
 |
| Quadrant-wise count rates Data is divided into 100 sec bins |
 |
|
| Module-wise count rates for Quadrant A Data is divided into 100 sec bins |
 |
 |
| Module-wise count rates for Quadrant B Data is divided into 100 sec bins |
 |
 |
| Module-wise count rates for Quadrant C Data is divided into 100 sec bins |
 |
 |
| Module-wise count rates for Quadrant D Data is divided into 100 sec bins |
 |
 |
| Parameter | Plot |
|---|---|
| CZT HV Monitor |  |
| D_VDD |  |
| Temperature 1 |  |
| Veto HV Monitor |  |
| Veto LLD |  |
| Alpha Counter |  |
| _CPM_Rate |  |
| CZT Counter |  |
| +2.5 Volts monitor |  |
| +5 Volts monitor |  |
| _ROLL_ROT |  |
| _Roll_DEC |  |
| _Roll_RA |  |
| Veto Counter |  |