| Param | Original file | Final file |
|---|---|---|
| Filename | modeM0/AS1A13_071T08_9000006292cztM0_level2.fits | modeM0/AS1A13_071T08_9000006292cztM0_level2_quad_clean.evt |
| Size (bytes) | 688,406,400 | 726,914,880 |
| Size | 656.5 MB | 693.2 MB |
| Events in quadrant A | 4,173,024 | 4,714,089 |
| Events in quadrant B | 3,212,610 | 2,987,366 |
| Events in quadrant C | 4,223,722 | 4,565,481 |
| Events in quadrant D | 3,575,976 | 4,106,504 |
| Mode SS | |||
|---|---|---|---|
| Quadrant | BADHDUFLAG | Total packets | Discarded packets |
| A | 0 | 1668 | 0 |
| B | 0 | 1668 | 0 |
| C | 0 | 1668 | 0 |
| D | 0 | 1666 | 0 |
| Mode M0 | |||
|---|---|---|---|
| Quadrant | BADHDUFLAG | Total packets | Discarded packets |
| A | 0 | 291751 | 0 |
| B | 0 | 471699 | 0 |
| C | 0 | 188152 | 0 |
| D | 0 | 235409 | 0 |
| Mode M9 | |||
|---|---|---|---|
| Quadrant | BADHDUFLAG | Total packets | Discarded packets |
| A | 0 | 100 | 0 |
| B | 0 | 100 | 0 |
| C | 0 | 100 | 0 |
| D | 0 | 100 | 0 |
| Quadrant | Total seconds | Saturated seconds | Saturation percentage |
|---|---|---|---|
| A | 82261 | 3234 | 3.931389% |
| B | 82262 | 39847 | 48.439134% |
| C | 82264 | 2619 | 3.183653% |
| D | 82266 | 5552 | 6.748839% |
Noise dominated data is calculated using 1-second bins in cleaned event files. If a bin has >2000 counts, and if more than 50% of those come from <1% of pixels, then it is considered to be noise-dominated and hence unusable.
| Quadrant | # 1 sec bins | Bins with >0 counts | Bins with >2000 counts | High rate bins dominated by noise | Noise dominated (total time) | Noise dominated (detector-on time) | Marked lightcurve |
|---|---|---|---|---|---|---|---|
| A | 92110 | 82254 | 0 | 0 | 0.00% | 0.00% | 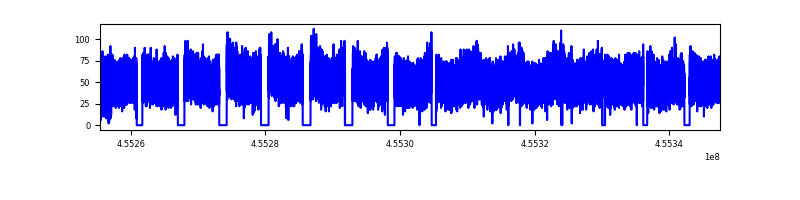 |
| B | 92112 | 82160 | 0 | 0 | 0.00% | 0.00% |  |
| C | 92113 | 82113 | 0 | 0 | 0.00% | 0.00% | 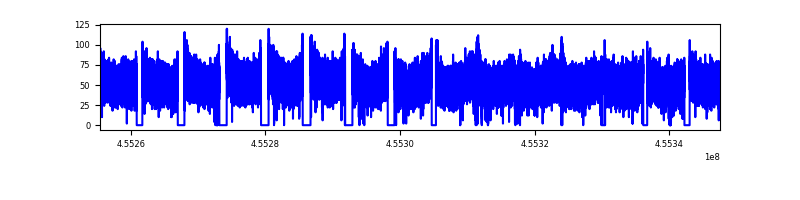 |
| D | 92113 | 82185 | 0 | 0 | 0.00% | 0.00% | 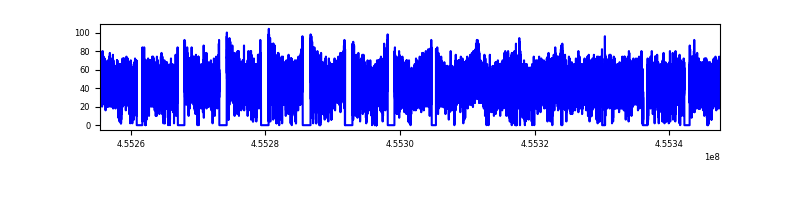 |
Top three noisy pixels from each quadrant. If the there are fewer than three noisy pixels in the level2.evt file, extra rows are filled as -1
| Pixel properties | Quadrant properties | ||||||
|---|---|---|---|---|---|---|---|
| Quadrant | DetID | PixID | Counts | Sigma | Mean | Median | Sigma |
| A | 7 | 110 | 3308 | 8.23 | 1089 | 1022 | 277.9 |
| A | 14 | 95 | 3136 | 7.61 | 1089 | 1022 | 277.9 |
| A | 9 | 19 | 3114 | 7.53 | 1089 | 1022 | 277.9 |
| B | 2 | 9 | 3045 | 13.65 | 848 | 809 | 163.8 |
| B | 2 | 8 | 2410 | 9.77 | 848 | 809 | 163.8 |
| B | 3 | 17 | 2280 | 8.98 | 848 | 809 | 163.8 |
| C | 3 | 202 | 3155 | 7.24 | 1117 | 1038 | 292.3 |
| C | 1 | 81 | 3155 | 7.24 | 1117 | 1038 | 292.3 |
| C | 3 | 203 | 3134 | 7.17 | 1117 | 1038 | 292.3 |
| D | 8 | 176 | 2722 | 6.27 | 1025 | 929 | 285.8 |
| D | 10 | 189 | 2666 | 6.08 | 1025 | 929 | 285.8 |
| D | 4 | 16 | 2610 | 5.88 | 1025 | 929 | 285.8 |
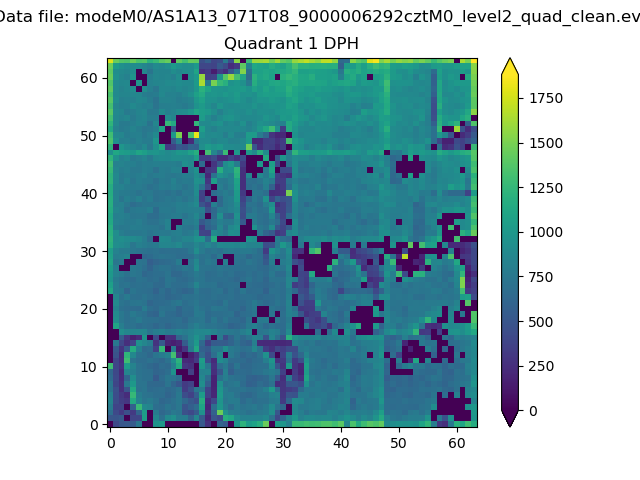
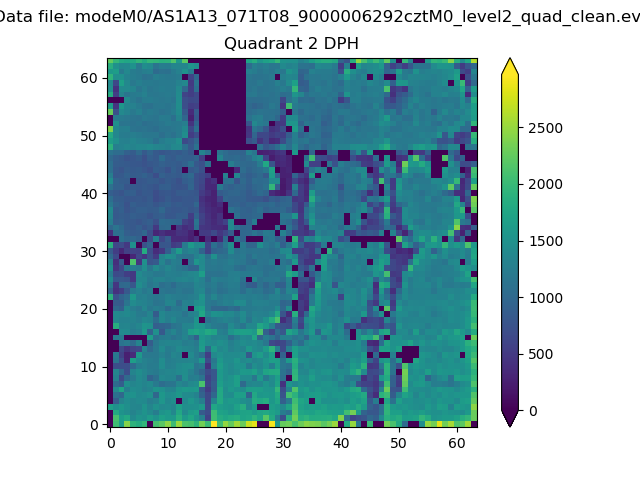
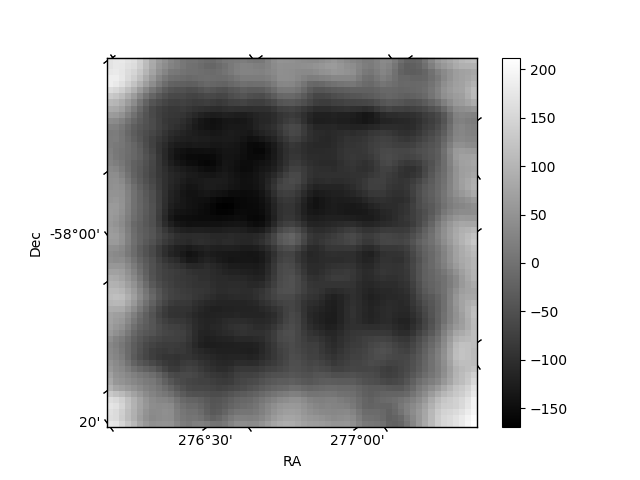
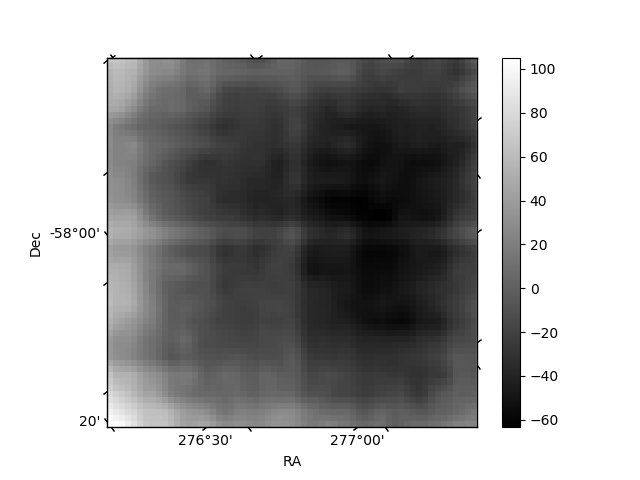
Histogram calculated using DETX and DETY for each event in the final _common_clean file
| Quadrant A | 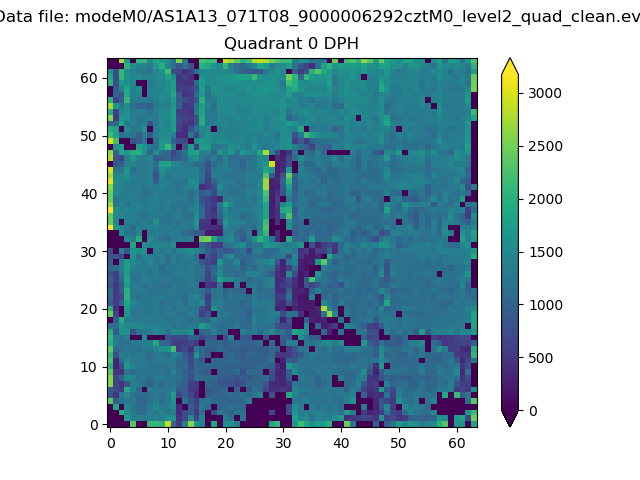 |
 |
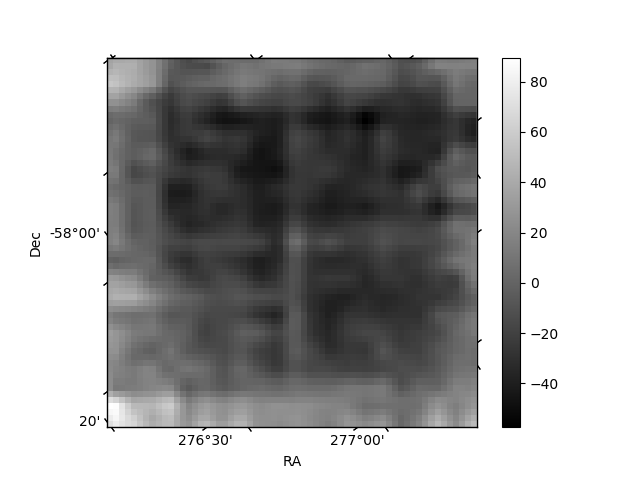
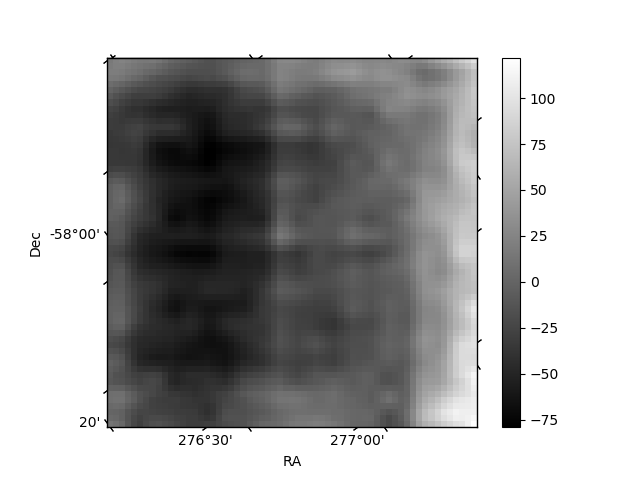
Quadrant B |
|---|---|---|---|
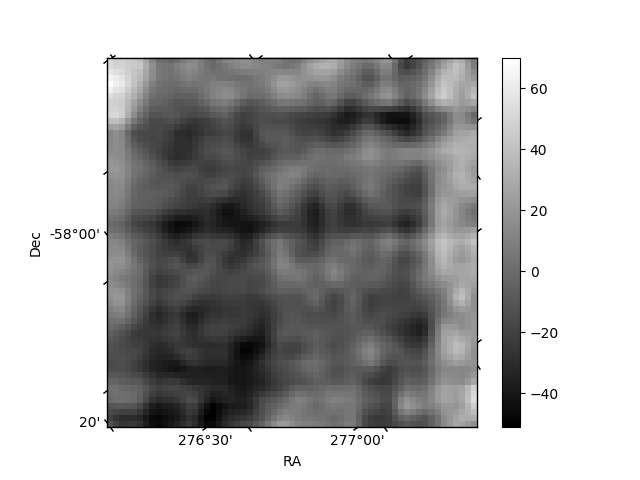
| Quadrant D | 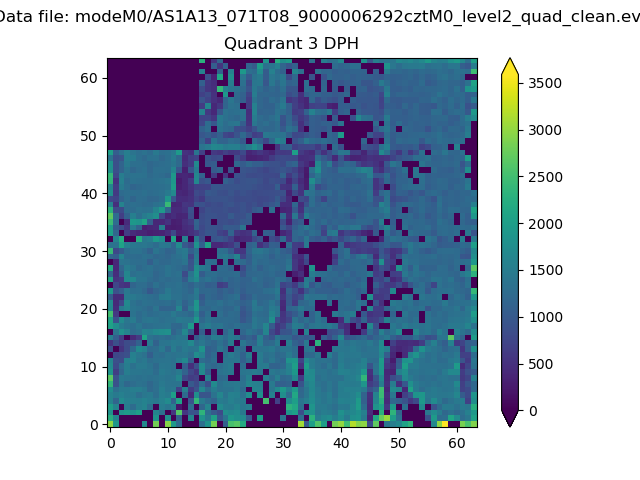 |
 |
Quadrant C |
| Plot type | Count rate plots | Images |
|---|---|---|
| Comparison with Poisson distribution Blue bars denote a histogram of data divided into 1 sec bins. Red curve is a Poisson curve with rate = median count rate of data. |
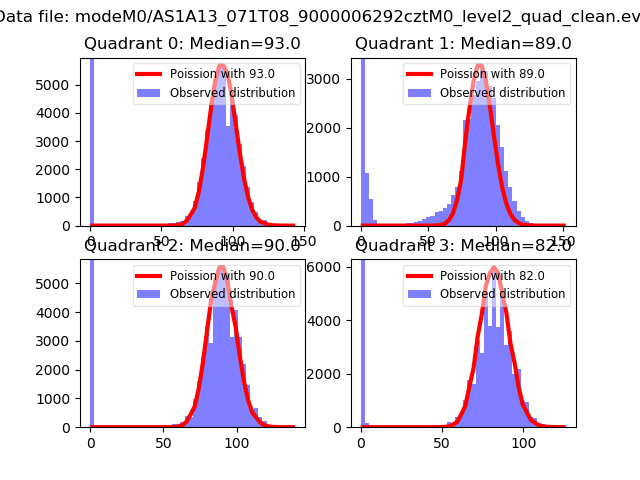 |
 |
| Quadrant-wise count rates Data is divided into 100 sec bins |
 |
|
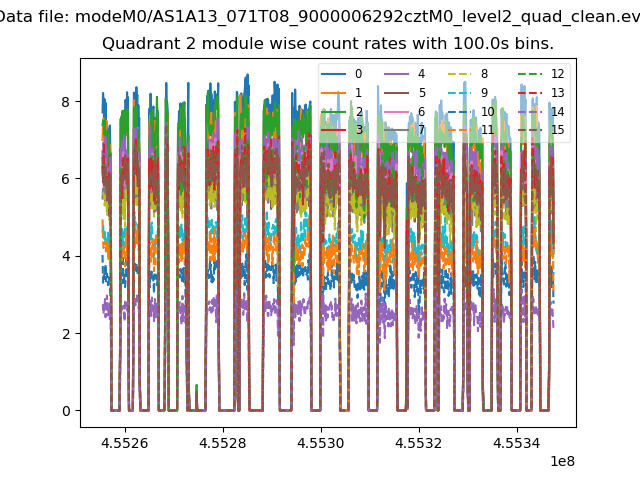
| Module-wise count rates for Quadrant A Data is divided into 100 sec bins |
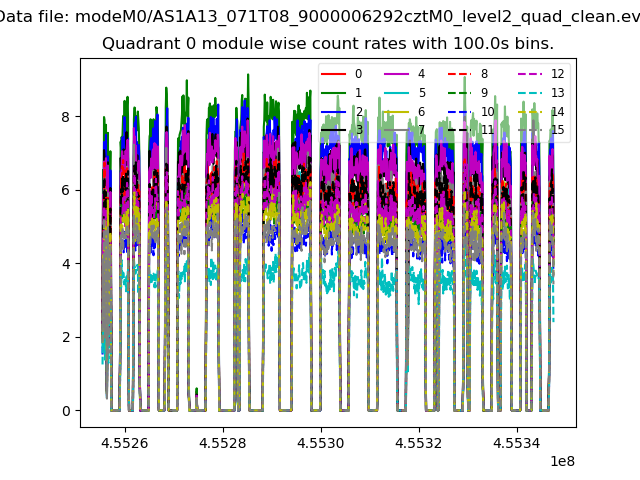 |
 |
| Module-wise count rates for Quadrant B Data is divided into 100 sec bins |
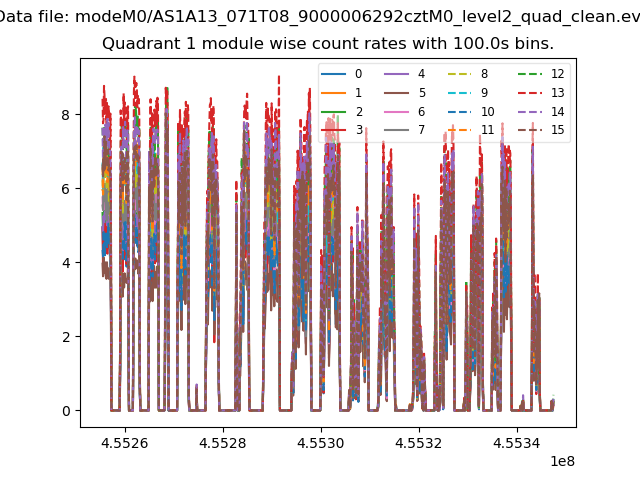 |
 |
| Module-wise count rates for Quadrant C Data is divided into 100 sec bins |
 |
 |
| Module-wise count rates for Quadrant D Data is divided into 100 sec bins |
 |
 |
| Parameter | Plot |
|---|---|
| CZT HV Monitor | 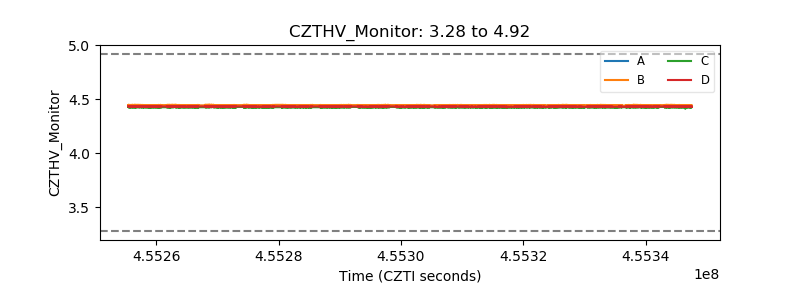 |
| D_VDD | 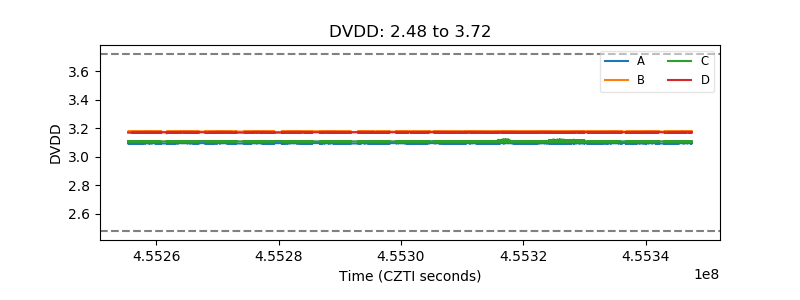 |
| Temperature 1 | 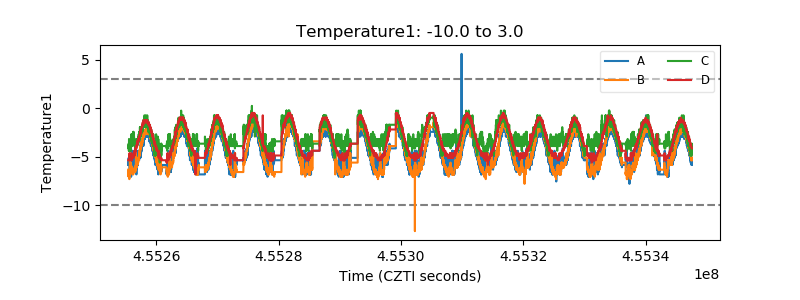 |
| Veto HV Monitor |  |
| Veto LLD | 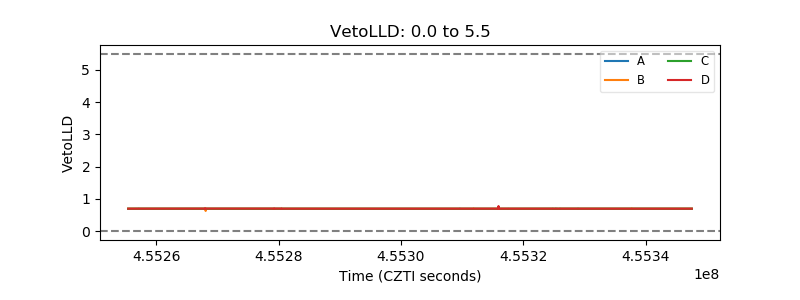 |
| Alpha Counter |  |
| _CPM_Rate | 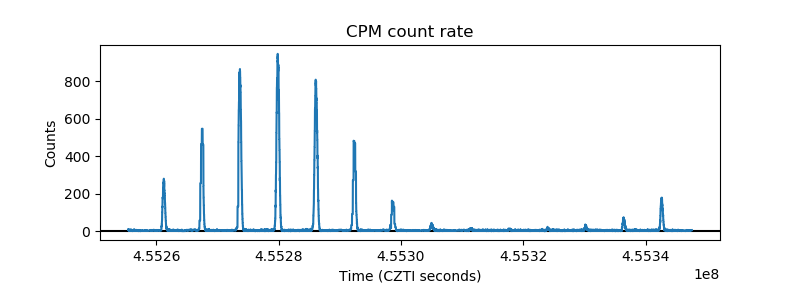 |
| CZT Counter | 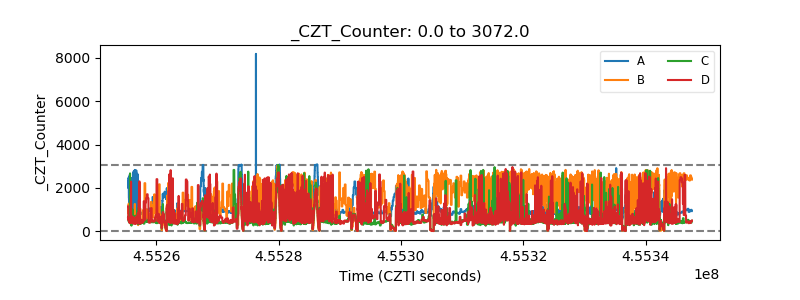 |
| +2.5 Volts monitor |  |
| +5 Volts monitor |  |
| _ROLL_ROT | 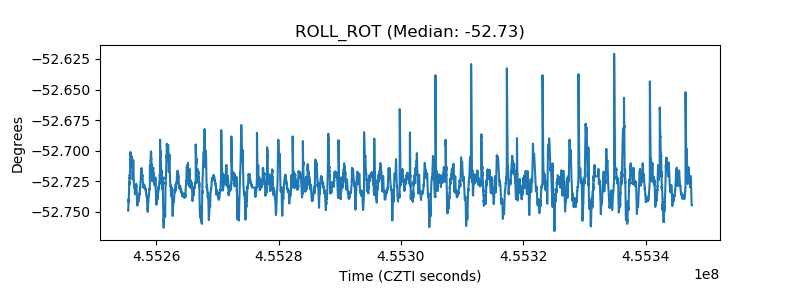 |
| _Roll_DEC | 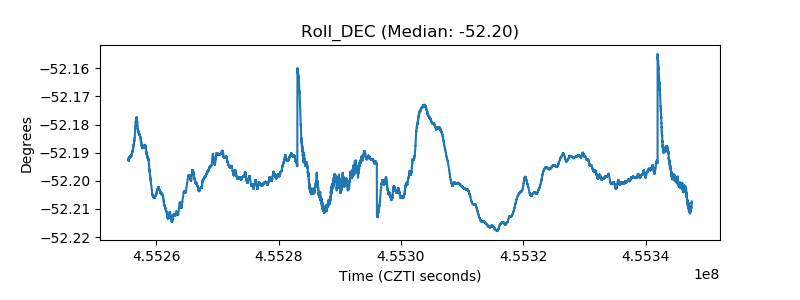 |
| _Roll_RA | 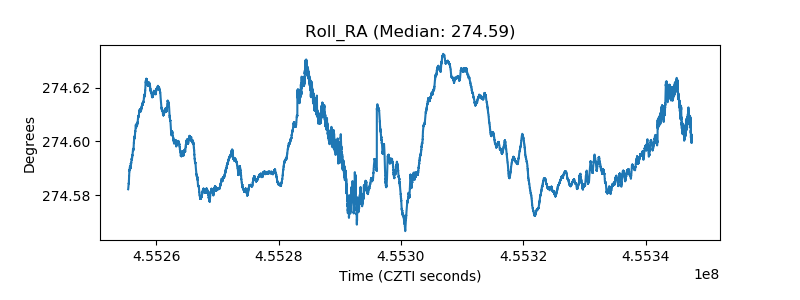 |
| Veto Counter | 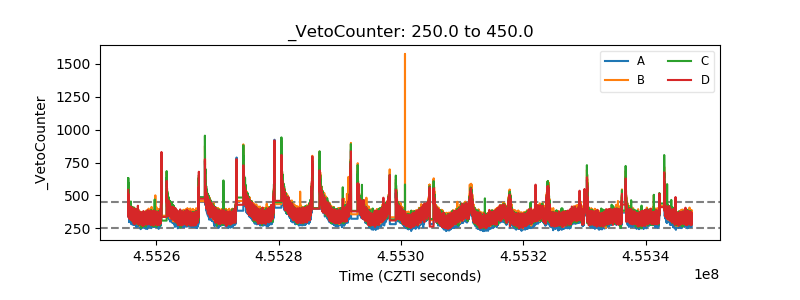 |