| Param | Original file | Final file |
|---|---|---|
| Filename | modeM0/AS1C09_006T01_9000006294cztM0_level2.fits | modeM0/AS1C09_006T01_9000006294cztM0_level2_quad_clean.evt |
| Size (bytes) | 949,495,680 | 963,204,480 |
| Size | 905.5 MB | 918.6 MB |
| Events in quadrant A | 5,843,078 | 6,676,873 |
| Events in quadrant B | 4,248,092 | 2,785,172 |
| Events in quadrant C | 5,932,074 | 6,440,488 |
| Events in quadrant D | 5,027,834 | 5,597,389 |
| Mode M9 | |||
|---|---|---|---|
| Quadrant | BADHDUFLAG | Total packets | Discarded packets |
| A | 0 | 159 | 0 |
| B | 0 | 159 | 0 |
| C | 0 | 159 | 0 |
| D | 0 | 159 | 0 |
| Mode SS | |||
|---|---|---|---|
| Quadrant | BADHDUFLAG | Total packets | Discarded packets |
| A | 0 | 2276 | 0 |
| B | 0 | 2276 | 0 |
| C | 0 | 2276 | 0 |
| D | 0 | 2276 | 0 |
| Mode M0 | |||
|---|---|---|---|
| Quadrant | BADHDUFLAG | Total packets | Discarded packets |
| A | 0 | 393185 | 0 |
| B | 0 | 685420 | 0 |
| C | 0 | 252325 | 0 |
| D | 0 | 323866 | 0 |
| Quadrant | Total seconds | Saturated seconds | Saturation percentage |
|---|---|---|---|
| A | 111881 | 4289 | 3.833537% |
| B | 111882 | 63671 | 56.909065% |
| C | 111882 | 2985 | 2.667989% |
| D | 111882 | 7840 | 7.007383% |
Noise dominated data is calculated using 1-second bins in cleaned event files. If a bin has >2000 counts, and if more than 50% of those come from <1% of pixels, then it is considered to be noise-dominated and hence unusable.
| Quadrant | # 1 sec bins | Bins with >0 counts | Bins with >2000 counts | High rate bins dominated by noise | Noise dominated (total time) | Noise dominated (detector-on time) | Marked lightcurve |
|---|---|---|---|---|---|---|---|
| A | 127547 | 111875 | 0 | 0 | 0.00% | 0.00% |  |
| B | 127547 | 111744 | 0 | 0 | 0.00% | 0.00% |  |
| C | 127547 | 111664 | 0 | 0 | 0.00% | 0.00% |  |
| D | 127547 | 111772 | 0 | 0 | 0.00% | 0.00% |  |
Top three noisy pixels from each quadrant. If the there are fewer than three noisy pixels in the level2.evt file, extra rows are filled as -1
| Pixel properties | Quadrant properties | ||||||
|---|---|---|---|---|---|---|---|
| Quadrant | DetID | PixID | Counts | Sigma | Mean | Median | Sigma |
| A | 7 | 110 | 4699 | 8.47 | 1523 | 1420 | 387.3 |
| A | 0 | 29 | 4475 | 7.89 | 1523 | 1420 | 387.3 |
| A | 14 | 95 | 4455 | 7.84 | 1523 | 1420 | 387.3 |
| B | 2 | 9 | 4028 | 13.43 | 1120 | 1064 | 220.7 |
| B | 2 | 8 | 3240 | 9.86 | 1120 | 1064 | 220.7 |
| B | 3 | 17 | 2929 | 8.45 | 1120 | 1064 | 220.7 |
| C | 3 | 202 | 4431 | 7.29 | 1567 | 1451 | 409.0 |
| C | 1 | 81 | 4426 | 7.27 | 1567 | 1451 | 409.0 |
| C | 3 | 203 | 4321 | 7.02 | 1567 | 1451 | 409.0 |
| D | 10 | 189 | 3679 | 5.91 | 1441 | 1302 | 401.9 |
| D | 4 | 12 | 3602 | 5.72 | 1441 | 1302 | 401.9 |
| D | 15 | 47 | 3588 | 5.69 | 1441 | 1302 | 401.9 |
Histogram calculated using DETX and DETY for each event in the final _common_clean file
| Quadrant A | 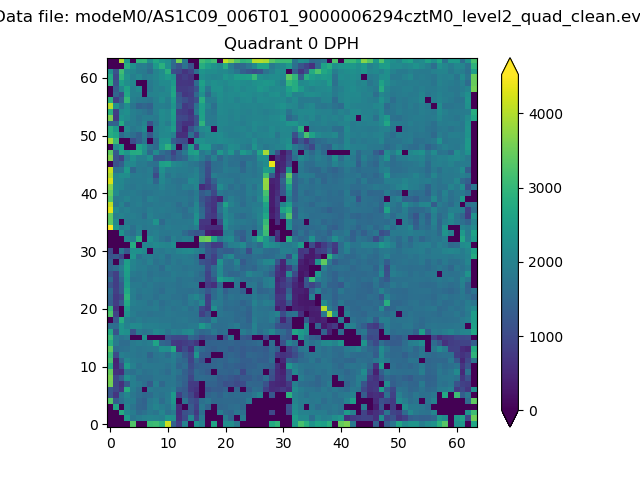 |
 |
Quadrant B |
|---|---|---|---|
| Quadrant D | 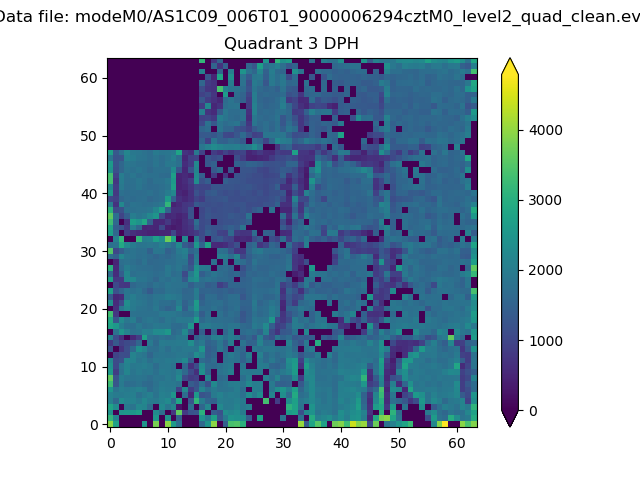 |
 |
Quadrant C |
| Plot type | Count rate plots | Images |
|---|---|---|
| Comparison with Poisson distribution Blue bars denote a histogram of data divided into 1 sec bins. Red curve is a Poisson curve with rate = median count rate of data. |
 |
 |
| Quadrant-wise count rates Data is divided into 100 sec bins |
 |
|
| Module-wise count rates for Quadrant A Data is divided into 100 sec bins |
 |
 |
| Module-wise count rates for Quadrant B Data is divided into 100 sec bins |
 |
 |
| Module-wise count rates for Quadrant C Data is divided into 100 sec bins |
 |
 |
| Module-wise count rates for Quadrant D Data is divided into 100 sec bins |
 |
 |
| Parameter | Plot |
|---|---|
| CZT HV Monitor |  |
| D_VDD |  |
| Temperature 1 |  |
| Veto HV Monitor |  |
| Veto LLD |  |
| Alpha Counter |  |
| _CPM_Rate |  |
| CZT Counter |  |
| +2.5 Volts monitor |  |
| +5 Volts monitor |  |
| _ROLL_ROT |  |
| _Roll_DEC |  |
| _Roll_RA |  |
| Veto Counter |  |