| Param | Original file | Final file |
|---|---|---|
| Filename | modeM0/AS1C09_003T01_9000006298cztM0_level2.fits | modeM0/AS1C09_003T01_9000006298cztM0_level2_quad_clean.evt |
| Size (bytes) | 4,391,979,840 | 5,144,313,600 |
| Size | 4.1 GB | 4.8 GB |
| Events in quadrant A | 25,586,258 | 31,500,682 |
| Events in quadrant B | 25,076,042 | 31,876,687 |
| Events in quadrant C | 25,820,570 | 30,229,789 |
| Events in quadrant D | 21,891,438 | 27,594,151 |
| Mode M9 | |||
|---|---|---|---|
| Quadrant | BADHDUFLAG | Total packets | Discarded packets |
| A | 0 | 655 | 0 |
| B | 0 | 656 | 0 |
| C | 0 | 656 | 0 |
| D | 0 | 656 | 0 |
| Mode M0 | |||
|---|---|---|---|
| Quadrant | BADHDUFLAG | Total packets | Discarded packets |
| A | 0 | 1842218 | 0 |
| B | 0 | 1165707 | 0 |
| C | 0 | 1116410 | 0 |
| D | 0 | 1301596 | 0 |
| Mode SS | |||
|---|---|---|---|
| Quadrant | BADHDUFLAG | Total packets | Discarded packets |
| A | 0 | 10177 | 0 |
| B | 0 | 10178 | 0 |
| C | 0 | 10181 | 0 |
| D | 0 | 10178 | 0 |
| Quadrant | Total seconds | Saturated seconds | Saturation percentage |
|---|---|---|---|
| A | 505566 | 19604 | 3.877634% |
| B | 505479 | 13316 | 2.634333% |
| C | 505889 | 11122 | 2.198506% |
| D | 505807 | 23974 | 4.739753% |
Noise dominated data is calculated using 1-second bins in cleaned event files. If a bin has >2000 counts, and if more than 50% of those come from <1% of pixels, then it is considered to be noise-dominated and hence unusable.
| Quadrant | # 1 sec bins | Bins with >0 counts | Bins with >2000 counts | High rate bins dominated by noise | Noise dominated (total time) | Noise dominated (detector-on time) | Marked lightcurve |
|---|---|---|---|---|---|---|---|
| A | 612397 | 506027 | 0 | 0 | 0.00% | 0.00% | 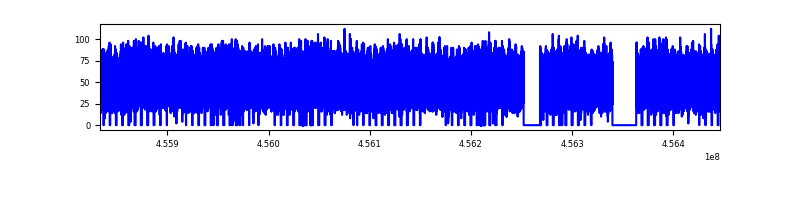 |
| B | 612397 | 505794 | 0 | 0 | 0.00% | 0.00% |  |
| C | 612397 | 506216 | 0 | 0 | 0.00% | 0.00% | 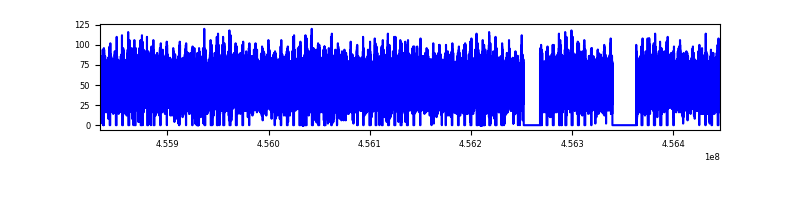 |
| D | 612396 | 505302 | 0 | 0 | 0.00% | 0.00% |  |
Top three noisy pixels from each quadrant. If the there are fewer than three noisy pixels in the level2.evt file, extra rows are filled as -1
| Pixel properties | Quadrant properties | ||||||
|---|---|---|---|---|---|---|---|
| Quadrant | DetID | PixID | Counts | Sigma | Mean | Median | Sigma |
| A | 7 | 110 | 20892 | 8.65 | 6677 | 6248 | 1692.2 |
| A | 0 | 29 | 19719 | 7.96 | 6677 | 6248 | 1692.2 |
| A | 14 | 95 | 19427 | 7.79 | 6677 | 6248 | 1692.2 |
| B | 2 | 9 | 24096 | 13.88 | 6640 | 6324 | 1280.9 |
| B | 2 | 8 | 19187 | 10.04 | 6640 | 6324 | 1280.9 |
| B | 3 | 17 | 18000 | 9.12 | 6640 | 6324 | 1280.9 |
| C | 3 | 202 | 20027 | 7.81 | 6828 | 6354 | 1750.5 |
| C | 1 | 81 | 19590 | 7.56 | 6828 | 6354 | 1750.5 |
| C | 3 | 203 | 19225 | 7.35 | 6828 | 6354 | 1750.5 |
| D | 10 | 189 | 16257 | 6.04 | 6303 | 5707 | 1746.0 |
| D | 10 | 113 | 16006 | 5.9 | 6303 | 5707 | 1746.0 |
| D | 6 | 38 | 15885 | 5.83 | 6303 | 5707 | 1746.0 |
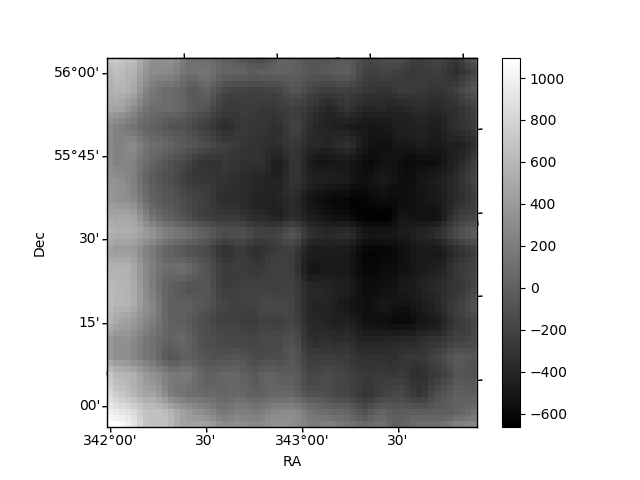
Histogram calculated using DETX and DETY for each event in the final _common_clean file
| Quadrant A | 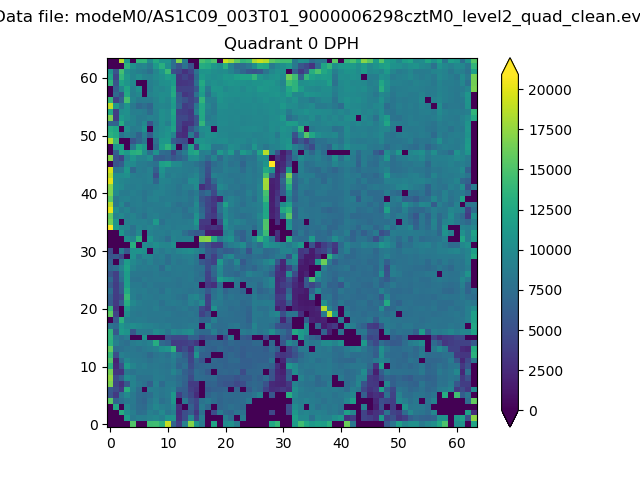 |
 |
Quadrant B |
|---|---|---|---|
| Quadrant D | 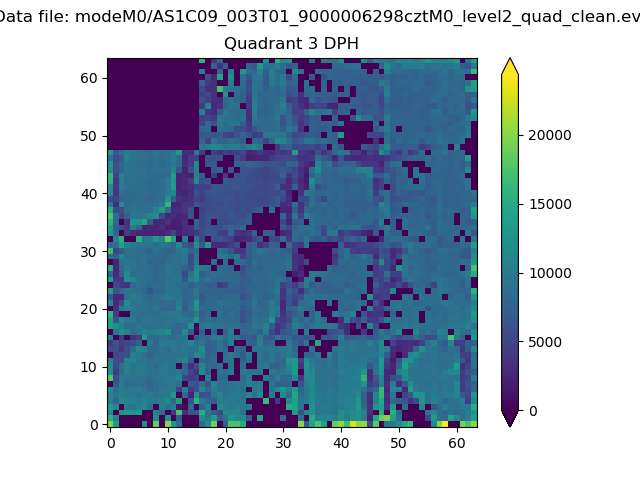 |
 |
Quadrant C |
| Plot type | Count rate plots | Images |
|---|---|---|
| Comparison with Poisson distribution Blue bars denote a histogram of data divided into 1 sec bins. Red curve is a Poisson curve with rate = median count rate of data. |
 |
 |
| Quadrant-wise count rates Data is divided into 100 sec bins |
 |
|
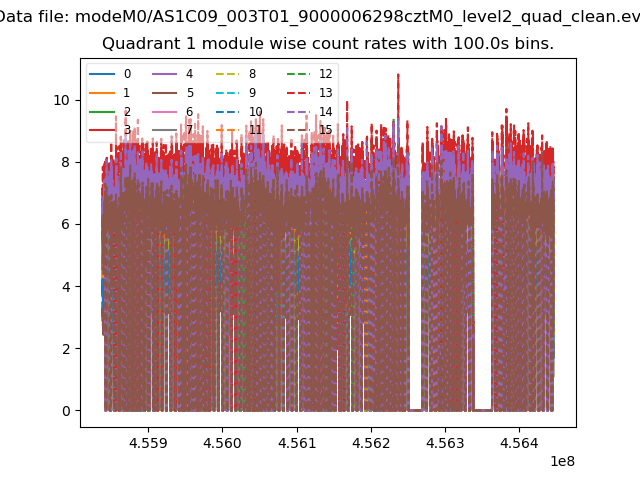
| Module-wise count rates for Quadrant A Data is divided into 100 sec bins |
 |
 |
| Module-wise count rates for Quadrant B Data is divided into 100 sec bins |
 |
 |
| Module-wise count rates for Quadrant C Data is divided into 100 sec bins |
 |
 |
| Module-wise count rates for Quadrant D Data is divided into 100 sec bins |
 |
 |
| Parameter | Plot |
|---|---|
| CZT HV Monitor | 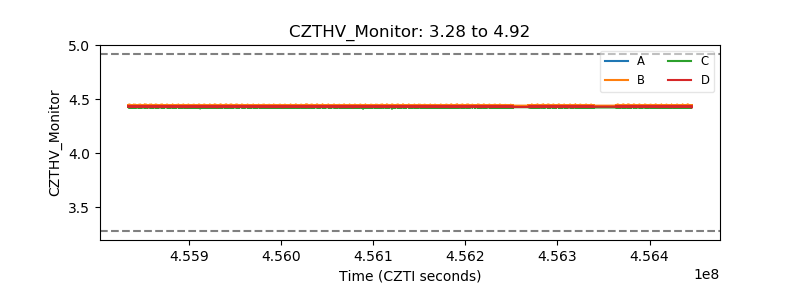 |
| D_VDD | 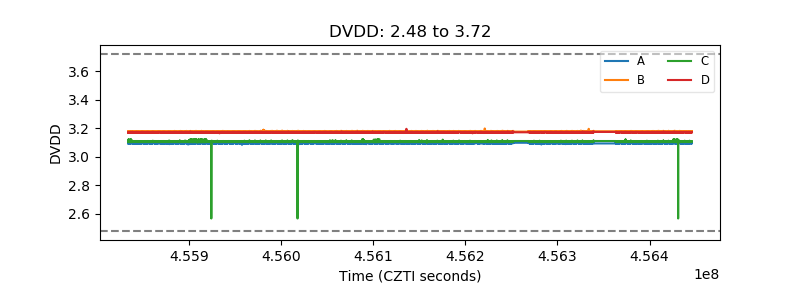 |
| Temperature 1 | 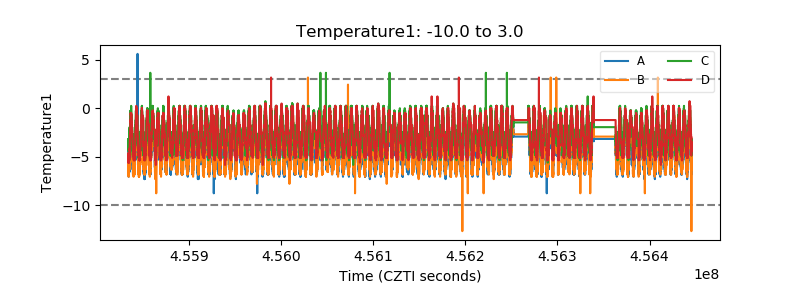 |
| Veto HV Monitor |  |
| Veto LLD |  |
| Alpha Counter |  |
| _CPM_Rate | 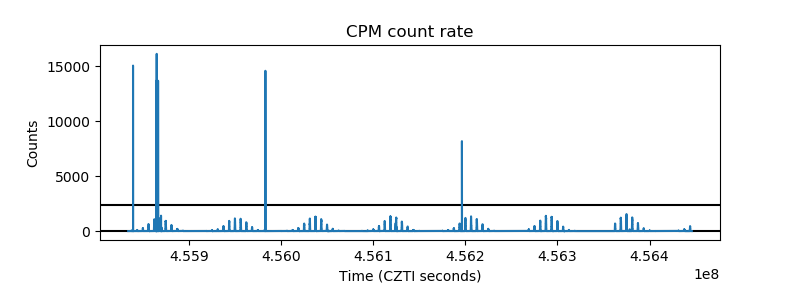 |
| CZT Counter |  |
| +2.5 Volts monitor |  |
| +5 Volts monitor |  |
| _ROLL_ROT | 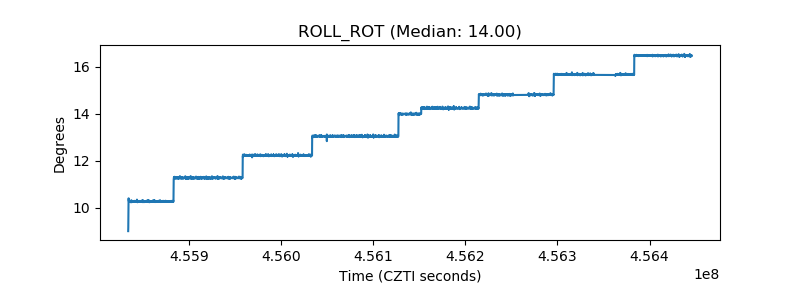 |
| _Roll_DEC |  |
| _Roll_RA |  |
| Veto Counter |  |