| Param | Original file | Final file |
|---|---|---|
| Filename | modeM0/AS1A13_037T01_9000006300cztM0_level2.fits | modeM0/AS1A13_037T01_9000006300cztM0_level2_quad_clean.evt |
| Size (bytes) | 536,734,080 | 533,211,840 |
| Size | 511.9 MB | 508.5 MB |
| Events in quadrant A | 3,127,664 | 3,099,556 |
| Events in quadrant B | 3,087,500 | 3,173,462 |
| Events in quadrant C | 3,162,298 | 2,982,913 |
| Events in quadrant D | 2,733,100 | 2,749,230 |
| Mode M9 | |||
|---|---|---|---|
| Quadrant | BADHDUFLAG | Total packets | Discarded packets |
| A | 0 | 68 | 0 |
| B | 0 | 69 | 0 |
| C | 0 | 69 | 0 |
| D | 0 | 69 | 0 |
| Mode SS | |||
|---|---|---|---|
| Quadrant | BADHDUFLAG | Total packets | Discarded packets |
| A | 0 | 1224 | 0 |
| B | 0 | 1224 | 0 |
| C | 0 | 1224 | 0 |
| D | 0 | 1224 | 0 |
| Mode M0 | |||
|---|---|---|---|
| Quadrant | BADHDUFLAG | Total packets | Discarded packets |
| A | 0 | 212528 | 0 |
| B | 0 | 136187 | 0 |
| C | 0 | 130025 | 0 |
| D | 0 | 137711 | 0 |
| Quadrant | Total seconds | Saturated seconds | Saturation percentage |
|---|---|---|---|
| A | 60398 | 1944 | 3.218650% |
| B | 60399 | 1459 | 2.415603% |
| C | 60401 | 759 | 1.256602% |
| D | 60400 | 1003 | 1.660596% |
Noise dominated data is calculated using 1-second bins in cleaned event files. If a bin has >2000 counts, and if more than 50% of those come from <1% of pixels, then it is considered to be noise-dominated and hence unusable.
| Quadrant | # 1 sec bins | Bins with >0 counts | Bins with >2000 counts | High rate bins dominated by noise | Noise dominated (total time) | Noise dominated (detector-on time) | Marked lightcurve |
|---|---|---|---|---|---|---|---|
| A | 66951 | 60392 | 0 | 0 | 0.00% | 0.00% |  |
| B | 66950 | 60394 | 0 | 0 | 0.00% | 0.00% | 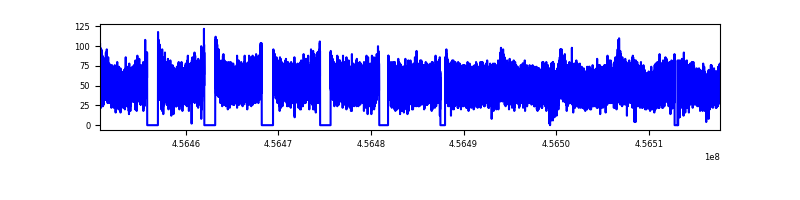 |
| C | 66951 | 60383 | 0 | 0 | 0.00% | 0.00% |  |
| D | 66951 | 60394 | 0 | 0 | 0.00% | 0.00% |  |
Top three noisy pixels from each quadrant. If the there are fewer than three noisy pixels in the level2.evt file, extra rows are filled as -1
| Pixel properties | Quadrant properties | ||||||
|---|---|---|---|---|---|---|---|
| Quadrant | DetID | PixID | Counts | Sigma | Mean | Median | Sigma |
| A | 7 | 110 | 2579 | 8.54 | 815 | 759 | 213.2 |
| A | 15 | 236 | 2467 | 8.01 | 815 | 759 | 213.2 |
| A | 0 | 29 | 2392 | 7.66 | 815 | 759 | 213.2 |
| B | 2 | 9 | 2999 | 13.48 | 815 | 773 | 165.2 |
| B | 2 | 8 | 2443 | 10.11 | 815 | 773 | 165.2 |
| B | 3 | 17 | 2273 | 9.08 | 815 | 773 | 165.2 |
| C | 3 | 203 | 2370 | 7.34 | 835 | 771 | 217.8 |
| C | 3 | 202 | 2321 | 7.12 | 835 | 771 | 217.8 |
| C | 1 | 81 | 2298 | 7.01 | 835 | 771 | 217.8 |
| D | 3 | 31 | 2038 | 6.08 | 783 | 711 | 218.1 |
| D | 15 | 47 | 2005 | 5.93 | 783 | 711 | 218.1 |
| D | 3 | 14 | 1988 | 5.86 | 783 | 711 | 218.1 |
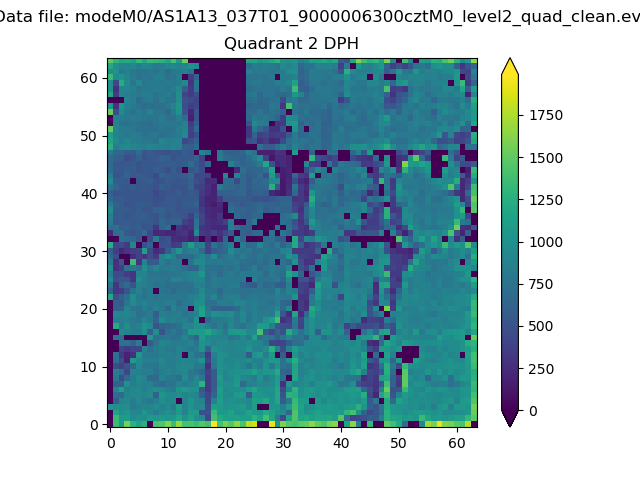
Histogram calculated using DETX and DETY for each event in the final _common_clean file
| Quadrant A | 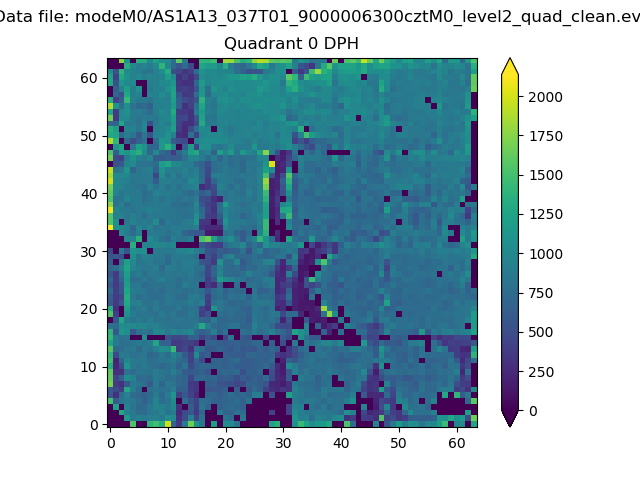 |
 |
Quadrant B |
|---|---|---|---|
| Quadrant D |  |
 |
Quadrant C |
| Plot type | Count rate plots | Images |
|---|---|---|
| Comparison with Poisson distribution Blue bars denote a histogram of data divided into 1 sec bins. Red curve is a Poisson curve with rate = median count rate of data. |
 |
 |
| Quadrant-wise count rates Data is divided into 100 sec bins |
 |
|
| Module-wise count rates for Quadrant A Data is divided into 100 sec bins |
 |
 |
| Module-wise count rates for Quadrant B Data is divided into 100 sec bins |
 |
 |
| Module-wise count rates for Quadrant C Data is divided into 100 sec bins |
 |
 |
| Module-wise count rates for Quadrant D Data is divided into 100 sec bins |
 |
 |
| Parameter | Plot |
|---|---|
| CZT HV Monitor |  |
| D_VDD |  |
| Temperature 1 |  |
| Veto HV Monitor |  |
| Veto LLD |  |
| Alpha Counter |  |
| _CPM_Rate |  |
| CZT Counter |  |
| +2.5 Volts monitor |  |
| +5 Volts monitor |  |
| _ROLL_ROT |  |
| _Roll_DEC |  |
| _Roll_RA |  |
| Veto Counter |  |