| Param | Original file | Final file |
|---|---|---|
| Filename | modeM0/AS1A13_019T01_9000006302cztM0_level2.fits | modeM0/AS1A13_019T01_9000006302cztM0_level2_quad_clean.evt |
| Size (bytes) | 1,089,247,680 | 1,068,292,800 |
| Size | 1.0 GB | 1018.8 MB |
| Events in quadrant A | 5,997,976 | 5,309,333 |
| Events in quadrant B | 6,357,842 | 6,691,222 |
| Events in quadrant C | 6,627,852 | 6,474,925 |
| Events in quadrant D | 5,533,154 | 5,424,257 |
| Mode M0 | |||
|---|---|---|---|
| Quadrant | BADHDUFLAG | Total packets | Discarded packets |
| A | 0 | 600746 | 0 |
| B | 0 | 300148 | 0 |
| C | 0 | 260595 | 0 |
| D | 0 | 377118 | 0 |
| Mode SS | |||
|---|---|---|---|
| Quadrant | BADHDUFLAG | Total packets | Discarded packets |
| A | 0 | 2304 | 0 |
| B | 0 | 2412 | 0 |
| C | 0 | 2412 | 0 |
| D | 0 | 2412 | 0 |
| Mode M9 | |||
|---|---|---|---|
| Quadrant | BADHDUFLAG | Total packets | Discarded packets |
| A | 0 | 185 | 0 |
| B | 0 | 185 | 0 |
| C | 0 | 185 | 0 |
| D | 0 | 185 | 0 |
| Quadrant | Total seconds | Saturated seconds | Saturation percentage |
|---|---|---|---|
| A | 123754 | 28399 | 22.947945% |
| B | 123757 | 5078 | 4.103202% |
| C | 123763 | 1223 | 0.988179% |
| D | 123759 | 9553 | 7.719035% |
Noise dominated data is calculated using 1-second bins in cleaned event files. If a bin has >2000 counts, and if more than 50% of those come from <1% of pixels, then it is considered to be noise-dominated and hence unusable.
| Quadrant | # 1 sec bins | Bins with >0 counts | Bins with >2000 counts | High rate bins dominated by noise | Noise dominated (total time) | Noise dominated (detector-on time) | Marked lightcurve |
|---|---|---|---|---|---|---|---|
| A | 142379 | 123704 | 0 | 0 | 0.00% | 0.00% |  |
| B | 142380 | 123719 | 0 | 0 | 0.00% | 0.00% |  |
| C | 142379 | 123758 | 0 | 0 | 0.00% | 0.00% |  |
| D | 142380 | 123754 | 0 | 0 | 0.00% | 0.00% |  |
Top three noisy pixels from each quadrant. If the there are fewer than three noisy pixels in the level2.evt file, extra rows are filled as -1
| Pixel properties | Quadrant properties | ||||||
|---|---|---|---|---|---|---|---|
| Quadrant | DetID | PixID | Counts | Sigma | Mean | Median | Sigma |
| A | 7 | 110 | 4935 | 8.74 | 1565 | 1455 | 398.4 |
| A | 0 | 29 | 4496 | 7.63 | 1565 | 1455 | 398.4 |
| A | 14 | 95 | 4426 | 7.46 | 1565 | 1455 | 398.4 |
| B | 2 | 9 | 5852 | 12.94 | 1682 | 1597 | 328.8 |
| B | 2 | 8 | 4683 | 9.39 | 1682 | 1597 | 328.8 |
| B | 3 | 17 | 4450 | 8.68 | 1682 | 1597 | 328.8 |
| C | 1 | 81 | 4967 | 7.34 | 1754 | 1628 | 455.1 |
| C | 3 | 202 | 4896 | 7.18 | 1754 | 1628 | 455.1 |
| C | 3 | 203 | 4881 | 7.15 | 1754 | 1628 | 455.1 |
| D | 10 | 189 | 4020 | 5.82 | 1591 | 1440 | 443.7 |
| D | 6 | 67 | 4012 | 5.8 | 1591 | 1440 | 443.7 |
| D | 12 | 6 | 4007 | 5.79 | 1591 | 1440 | 443.7 |
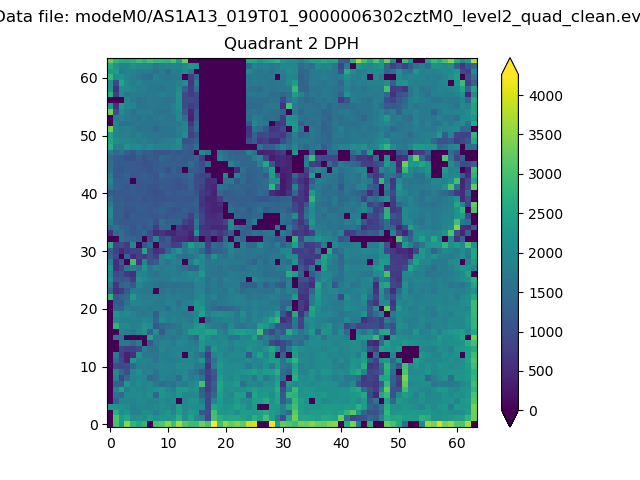
Histogram calculated using DETX and DETY for each event in the final _common_clean file
| Quadrant A | 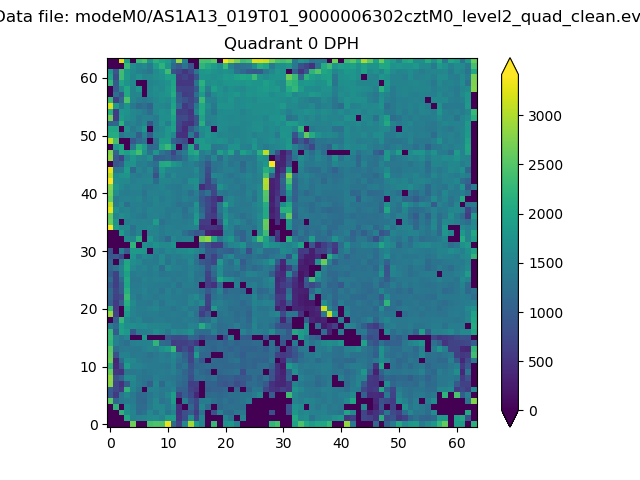 |
 |
Quadrant B |
|---|---|---|---|
| Quadrant D |  |
 |
Quadrant C |
| Plot type | Count rate plots | Images |
|---|---|---|
| Comparison with Poisson distribution Blue bars denote a histogram of data divided into 1 sec bins. Red curve is a Poisson curve with rate = median count rate of data. |
 |
 |
| Quadrant-wise count rates Data is divided into 100 sec bins |
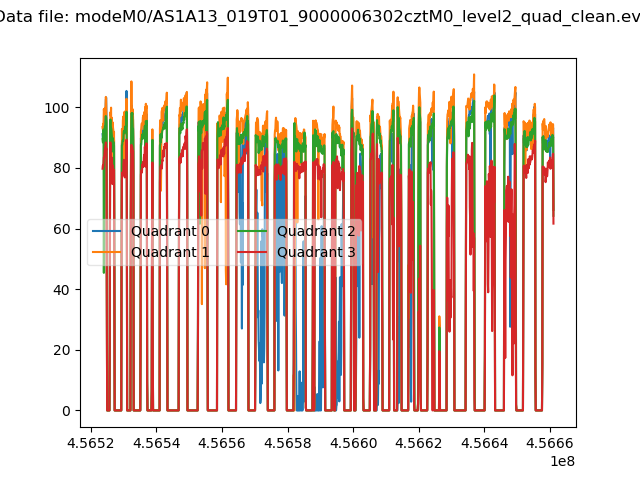 |
|
| Module-wise count rates for Quadrant A Data is divided into 100 sec bins |
 |
 |
| Module-wise count rates for Quadrant B Data is divided into 100 sec bins |
 |
 |
| Module-wise count rates for Quadrant C Data is divided into 100 sec bins |
 |
 |
| Module-wise count rates for Quadrant D Data is divided into 100 sec bins |
 |
 |
| Parameter | Plot |
|---|---|
| CZT HV Monitor |  |
| D_VDD | 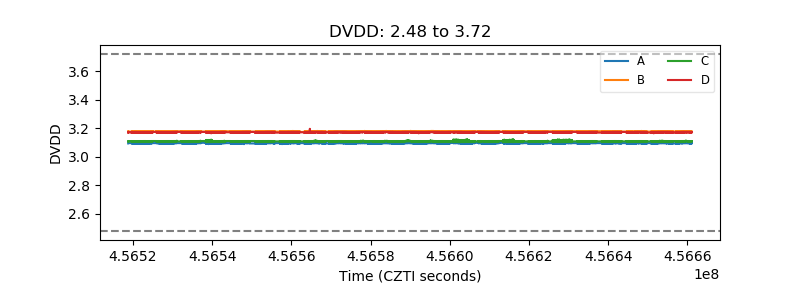 |
| Temperature 1 |  |
| Veto HV Monitor |  |
| Veto LLD |  |
| Alpha Counter |  |
| _CPM_Rate |  |
| CZT Counter |  |
| +2.5 Volts monitor |  |
| +5 Volts monitor |  |
| _ROLL_ROT |  |
| _Roll_DEC |  |
| _Roll_RA | 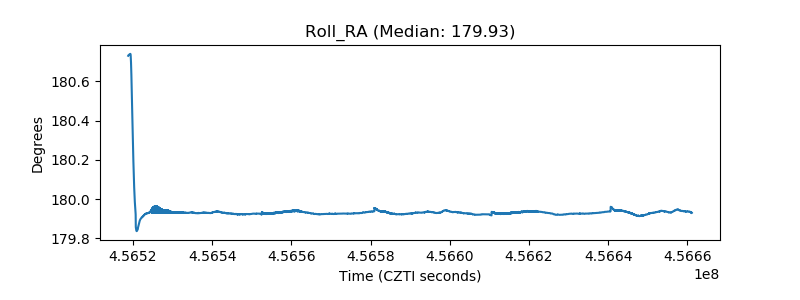 |
| Veto Counter |  |