| Param | Original file | Final file |
|---|---|---|
| Filename | modeM0/AS1C09_008T03_9000006306cztM0_level2.fits | modeM0/AS1C09_008T03_9000006306cztM0_level2_quad_clean.evt |
| Size (bytes) | 224,343,360 | 254,859,840 |
| Size | 214.0 MB | 243.1 MB |
| Events in quadrant A | 1,356,988 | 1,651,376 |
| Events in quadrant B | 1,354,410 | 1,681,960 |
| Events in quadrant C | 1,417,906 | 1,643,409 |
| Events in quadrant D | 788,880 | 871,597 |
| Mode M0 | |||
|---|---|---|---|
| Quadrant | BADHDUFLAG | Total packets | Discarded packets |
| A | 0 | 108401 | 0 |
| B | 0 | 61851 | 0 |
| C | 0 | 55927 | 0 |
| D | 0 | 144418 | 0 |
| Mode SS | |||
|---|---|---|---|
| Quadrant | BADHDUFLAG | Total packets | Discarded packets |
| A | 0 | 552 | 0 |
| B | 0 | 554 | 0 |
| C | 0 | 550 | 0 |
| D | 0 | 546 | 0 |
| Mode M9 | |||
|---|---|---|---|
| Quadrant | BADHDUFLAG | Total packets | Discarded packets |
| A | 0 | 28 | 0 |
| B | 0 | 28 | 0 |
| C | 0 | 28 | 0 |
| D | 0 | 28 | 0 |
| Quadrant | Total seconds | Saturated seconds | Saturation percentage |
|---|---|---|---|
| A | 27123 | 1587 | 5.851123% |
| B | 27295 | 947 | 3.469500% |
| C | 27325 | 154 | 0.563586% |
| D | 26948 | 11551 | 42.864034% |
Noise dominated data is calculated using 1-second bins in cleaned event files. If a bin has >2000 counts, and if more than 50% of those come from <1% of pixels, then it is considered to be noise-dominated and hence unusable.
| Quadrant | # 1 sec bins | Bins with >0 counts | Bins with >2000 counts | High rate bins dominated by noise | Noise dominated (total time) | Noise dominated (detector-on time) | Marked lightcurve |
|---|---|---|---|---|---|---|---|
| A | 29682 | 27410 | 0 | 0 | 0.00% | 0.00% |  |
| B | 29682 | 27422 | 0 | 0 | 0.00% | 0.00% |  |
| C | 29682 | 27528 | 0 | 0 | 0.00% | 0.00% |  |
| D | 29682 | 24626 | 0 | 0 | 0.00% | 0.00% | 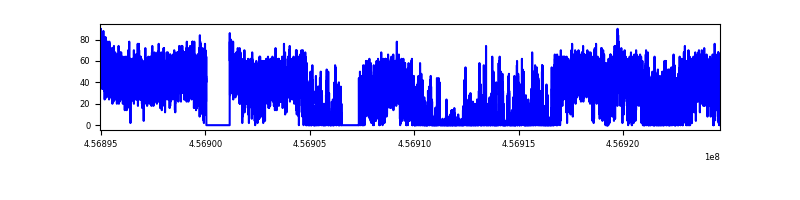 |
Top three noisy pixels from each quadrant. If the there are fewer than three noisy pixels in the level2.evt file, extra rows are filled as -1
| Pixel properties | Quadrant properties | ||||||
|---|---|---|---|---|---|---|---|
| Quadrant | DetID | PixID | Counts | Sigma | Mean | Median | Sigma |
| A | 7 | 110 | 1140 | 8.62 | 354 | 332 | 93.7 |
| A | 14 | 79 | 1041 | 7.56 | 354 | 332 | 93.7 |
| A | 0 | 29 | 1026 | 7.4 | 354 | 332 | 93.7 |
| B | 2 | 9 | 1356 | 14.14 | 358 | 342 | 71.7 |
| B | 2 | 8 | 1081 | 10.31 | 358 | 342 | 71.7 |
| B | 3 | 17 | 972 | 8.79 | 358 | 342 | 71.7 |
| C | 1 | 81 | 1141 | 8.07 | 374 | 349 | 98.2 |
| C | 3 | 202 | 1082 | 7.47 | 374 | 349 | 98.2 |
| C | 1 | 80 | 1063 | 7.27 | 374 | 349 | 98.2 |
| D | 6 | 38 | 626 | 6.63 | 225 | 205 | 63.5 |
| D | 12 | 6 | 583 | 5.96 | 225 | 205 | 63.5 |
| D | 4 | 16 | 580 | 5.91 | 225 | 205 | 63.5 |
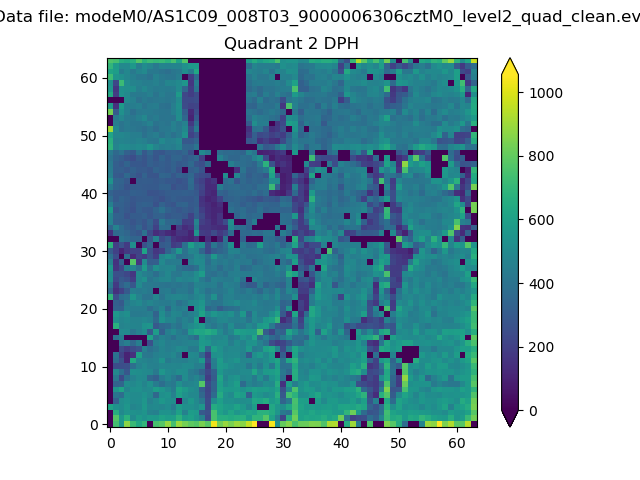
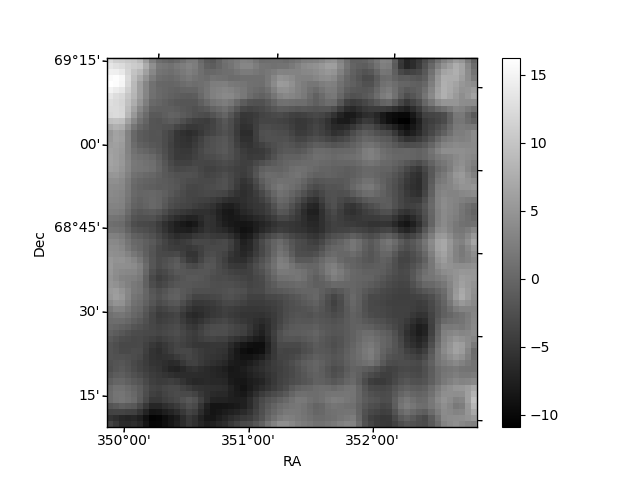
Histogram calculated using DETX and DETY for each event in the final _common_clean file
| Quadrant A | 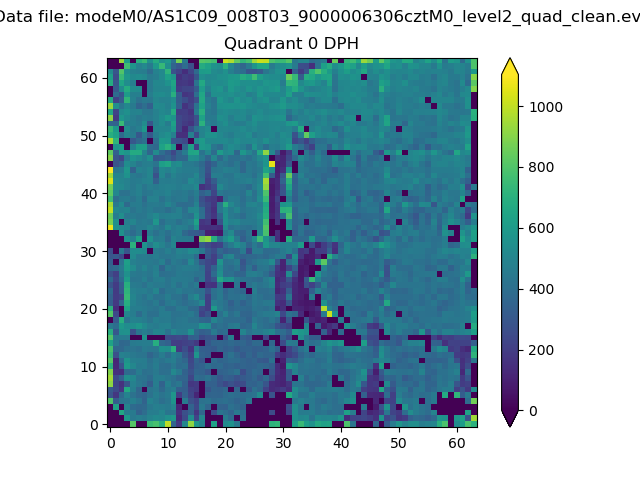 |
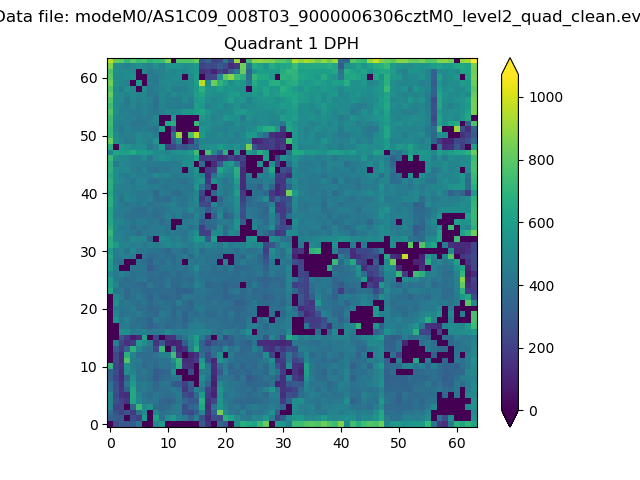 |
Quadrant B |
|---|---|---|---|
| Quadrant D | 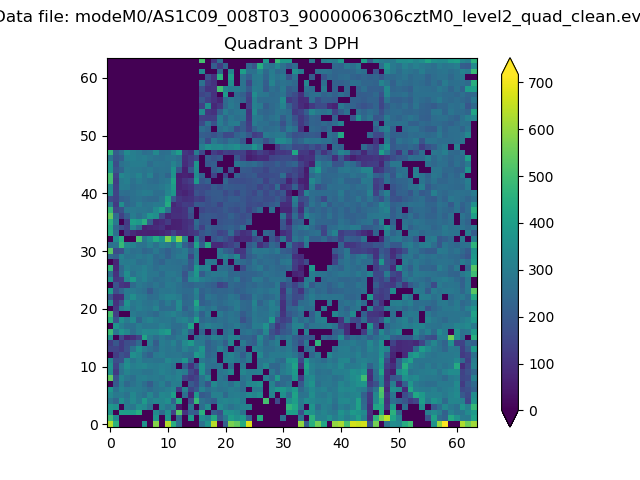 |
 |
Quadrant C |
| Plot type | Count rate plots | Images |
|---|---|---|
| Comparison with Poisson distribution Blue bars denote a histogram of data divided into 1 sec bins. Red curve is a Poisson curve with rate = median count rate of data. |
 |
 |
| Quadrant-wise count rates Data is divided into 100 sec bins |
 |
|
| Module-wise count rates for Quadrant A Data is divided into 100 sec bins |
 |
 |
| Module-wise count rates for Quadrant B Data is divided into 100 sec bins |
 |
 |
| Module-wise count rates for Quadrant C Data is divided into 100 sec bins |
 |
 |
| Module-wise count rates for Quadrant D Data is divided into 100 sec bins |
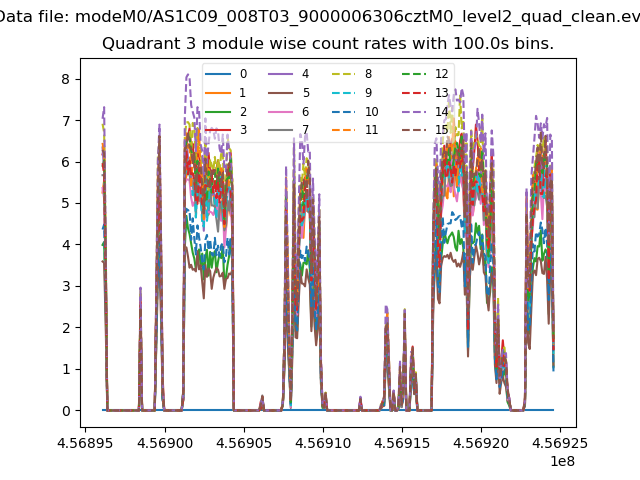 |
 |
| Parameter | Plot |
|---|---|
| CZT HV Monitor |  |
| D_VDD |  |
| Temperature 1 |  |
| Veto HV Monitor |  |
| Veto LLD | 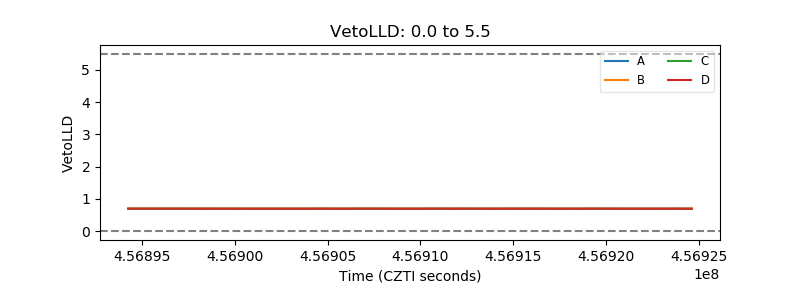 |
| Alpha Counter |  |
| _CPM_Rate | 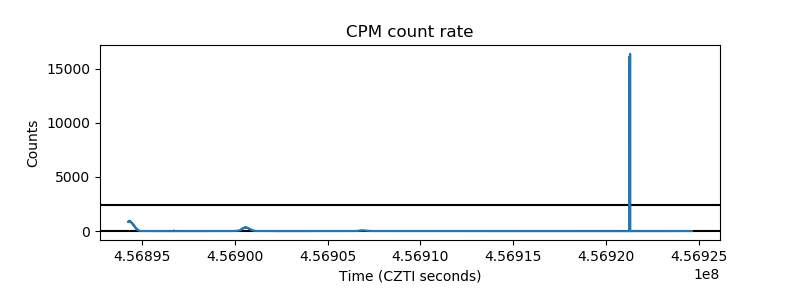 |
| CZT Counter | 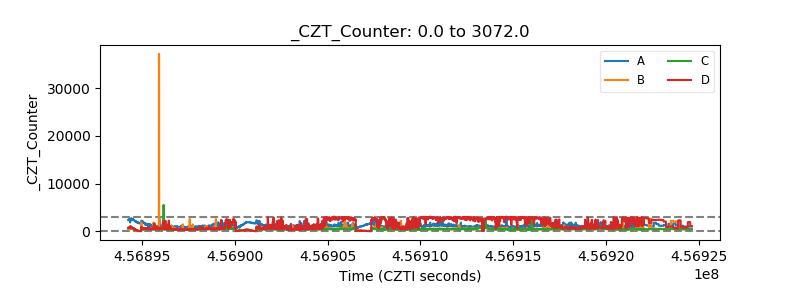 |
| +2.5 Volts monitor |  |
| +5 Volts monitor |  |
| _ROLL_ROT |  |
| _Roll_DEC | 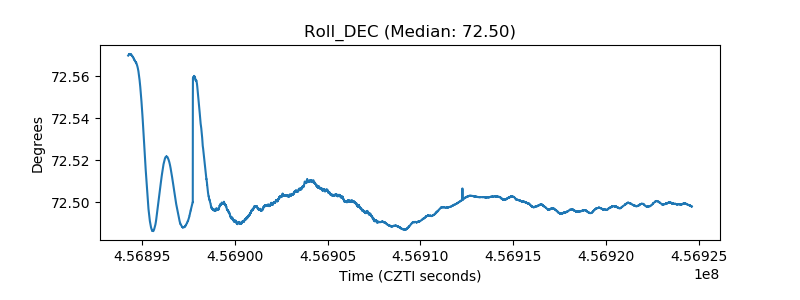 |
| _Roll_RA |  |
| Veto Counter | 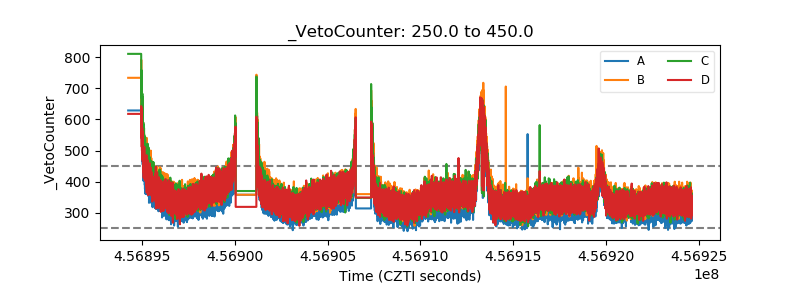 |