| Param | Original file | Final file |
|---|---|---|
| Filename | modeM0/AS1C09_011T02_9000006310cztM0_level2.fits | modeM0/AS1C09_011T02_9000006310cztM0_level2_quad_clean.evt |
| Size (bytes) | 55,834,560 | 56,070,720 |
| Size | 53.2 MB | 53.5 MB |
| Events in quadrant A | 312,162 | 316,910 |
| Events in quadrant B | 322,672 | 343,424 |
| Events in quadrant C | 336,614 | 331,786 |
| Events in quadrant D | 268,984 | 255,086 |
| Mode SS | |||
|---|---|---|---|
| Quadrant | BADHDUFLAG | Total packets | Discarded packets |
| A | 0 | 132 | 0 |
| B | 0 | 134 | 0 |
| C | 0 | 134 | 0 |
| D | 0 | 132 | 0 |
| Mode M9 | |||
|---|---|---|---|
| Quadrant | BADHDUFLAG | Total packets | Discarded packets |
| A | 0 | 5 | 0 |
| B | 0 | 5 | 0 |
| C | 0 | 5 | 0 |
| D | 0 | 5 | 0 |
| Mode M0 | |||
|---|---|---|---|
| Quadrant | BADHDUFLAG | Total packets | Discarded packets |
| A | 0 | 25938 | 0 |
| B | 0 | 14605 | 0 |
| C | 0 | 13842 | 0 |
| D | 0 | 20096 | 0 |
| Quadrant | Total seconds | Saturated seconds | Saturation percentage |
|---|---|---|---|
| A | 6283 | 316 | 5.029445% |
| B | 6531 | 124 | 1.898637% |
| C | 6556 | 56 | 0.854179% |
| D | 6384 | 673 | 10.541980% |
Noise dominated data is calculated using 1-second bins in cleaned event files. If a bin has >2000 counts, and if more than 50% of those come from <1% of pixels, then it is considered to be noise-dominated and hence unusable.
| Quadrant | # 1 sec bins | Bins with >0 counts | Bins with >2000 counts | High rate bins dominated by noise | Noise dominated (total time) | Noise dominated (detector-on time) | Marked lightcurve |
|---|---|---|---|---|---|---|---|
| A | 10392 | 6626 | 0 | 0 | 0.00% | 0.00% |  |
| B | 10392 | 6845 | 0 | 0 | 0.00% | 0.00% |  |
| C | 10391 | 6853 | 0 | 0 | 0.00% | 0.00% |  |
| D | 10392 | 6688 | 0 | 0 | 0.00% | 0.00% |  |
Top three noisy pixels from each quadrant. If the there are fewer than three noisy pixels in the level2.evt file, extra rows are filled as -1
| Pixel properties | Quadrant properties | ||||||
|---|---|---|---|---|---|---|---|
| Quadrant | DetID | PixID | Counts | Sigma | Mean | Median | Sigma |
| A | 7 | 110 | 257 | 7.94 | 81 | 76 | 22.8 |
| A | 0 | 29 | 249 | 7.59 | 81 | 76 | 22.8 |
| A | 14 | 79 | 233 | 6.88 | 81 | 76 | 22.8 |
| B | 2 | 9 | 317 | 12.26 | 85 | 81 | 19.3 |
| B | 3 | 17 | 234 | 7.95 | 85 | 81 | 19.3 |
| B | 5 | 255 | 233 | 7.9 | 85 | 81 | 19.3 |
| C | 1 | 81 | 263 | 7.28 | 88 | 82 | 24.9 |
| C | 3 | 202 | 252 | 6.84 | 88 | 82 | 24.9 |
| C | 1 | 80 | 246 | 6.59 | 88 | 82 | 24.9 |
| D | 1 | 3 | 214 | 6.23 | 77 | 69 | 23.3 |
| D | 6 | 38 | 213 | 6.18 | 77 | 69 | 23.3 |
| D | 15 | 46 | 202 | 5.71 | 77 | 69 | 23.3 |
Histogram calculated using DETX and DETY for each event in the final _common_clean file
| Quadrant A |  |
 |
Quadrant B |
|---|---|---|---|
| Quadrant D |  |
 |
Quadrant C |
| Plot type | Count rate plots | Images |
|---|---|---|
| Comparison with Poisson distribution Blue bars denote a histogram of data divided into 1 sec bins. Red curve is a Poisson curve with rate = median count rate of data. |
 |
 |
| Quadrant-wise count rates Data is divided into 100 sec bins |
 |
|
| Module-wise count rates for Quadrant A Data is divided into 100 sec bins |
 |
 |
| Module-wise count rates for Quadrant B Data is divided into 100 sec bins |
 |
 |
| Module-wise count rates for Quadrant C Data is divided into 100 sec bins |
 |
 |
| Module-wise count rates for Quadrant D Data is divided into 100 sec bins |
 |
 |
| Parameter | Plot |
|---|---|
| CZT HV Monitor |  |
| D_VDD | 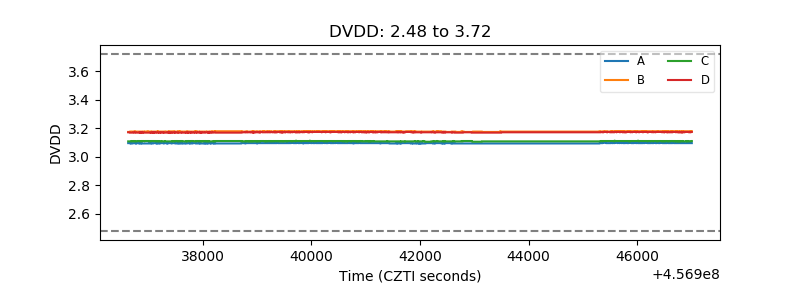 |
| Temperature 1 |  |
| Veto HV Monitor |  |
| Veto LLD |  |
| Alpha Counter |  |
| _CPM_Rate |  |
| CZT Counter |  |
| +2.5 Volts monitor |  |
| +5 Volts monitor |  |
| _ROLL_ROT |  |
| _Roll_DEC |  |
| _Roll_RA |  |
| Veto Counter |  |