| Param | Original file | Final file |
|---|---|---|
| Filename | modeM0/AS1T05_101T01_9000005578_40918cztM0_level2.fits | modeM0/AS1T05_101T01_9000005578_40918cztM0_level2_quad_clean.evt |
| Size (bytes) | 15,834,240 | 3,839,040 |
| Size | 15.1 MB | 3.7 MB |
| Events in quadrant A | 134,606 | 24,224 |
| Events in quadrant B | 112,736 | 24,771 |
| Events in quadrant C | 129,895 | 23,210 |
| Events in quadrant D | 187,036 | 19,531 |
| Mode SS | |||
|---|---|---|---|
| Quadrant | BADHDUFLAG | Total packets | Discarded packets |
| A | 0 | 6 | 0 |
| B | 0 | 6 | 0 |
| C | 0 | 6 | 0 |
| D | 0 | 6 | 0 |
| Mode M0 | |||
|---|---|---|---|
| Quadrant | BADHDUFLAG | Total packets | Discarded packets |
| A | 0 | 530 | 0 |
| B | 0 | 475 | 0 |
| C | 0 | 510 | 0 |
| D | 0 | 700 | 0 |
| Quadrant | Total seconds | Saturated seconds | Saturation percentage |
|---|---|---|---|
| A | 234 | 0 | 0.000000% |
| B | 234 | 0 | 0.000000% |
| C | 234 | 1 | 0.427350% |
| D | 234 | 20 | 8.547009% |
Noise dominated data is calculated using 1-second bins in cleaned event files. If a bin has >2000 counts, and if more than 50% of those come from <1% of pixels, then it is considered to be noise-dominated and hence unusable.
| Quadrant | # 1 sec bins | Bins with >0 counts | Bins with >2000 counts | High rate bins dominated by noise | Noise dominated (total time) | Noise dominated (detector-on time) | Marked lightcurve |
|---|---|---|---|---|---|---|---|
| A | 234 | 234 | 0 | 0 | 0.00% | 0.00% | 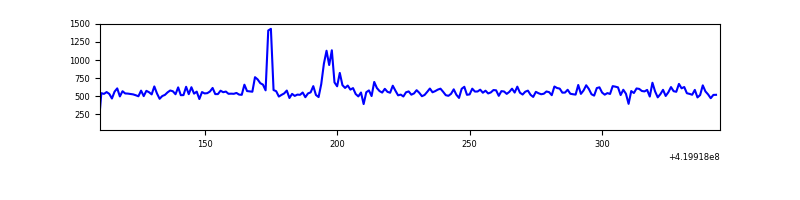 |
| B | 234 | 234 | 0 | 0 | 0.00% | 0.00% | 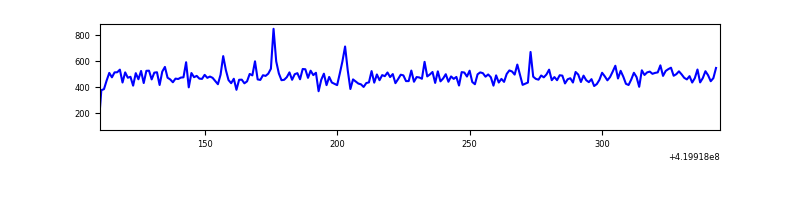 |
| C | 234 | 234 | 0 | 0 | 0.00% | 0.00% | 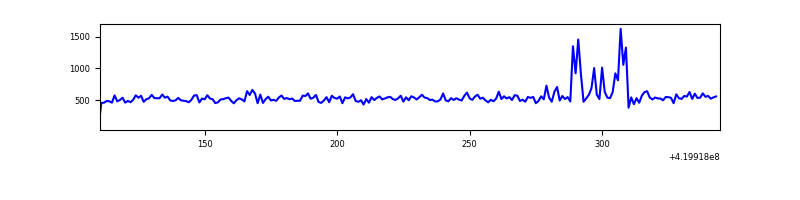 |
| D | 234 | 234 | 16 | 16 | 6.84% | 6.84% | 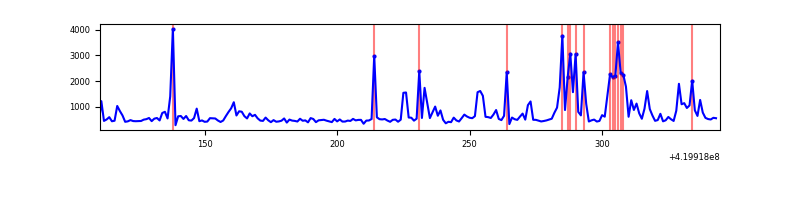 |
Top three noisy pixels from each quadrant. If the there are fewer than three noisy pixels in the level2.evt file, extra rows are filled as -1
| Pixel properties | Quadrant properties | ||||||
|---|---|---|---|---|---|---|---|
| Quadrant | DetID | PixID | Counts | Sigma | Mean | Median | Sigma |
| A | 10 | 83 | 20739 | 2617.68 | 27 | 27 | 7.9 |
| A | 13 | 248 | 6119 | 769.94 | 27 | 27 | 7.9 |
| A | 13 | 254 | 354 | 41.33 | 27 | 27 | 7.9 |
| B | 7 | 202 | 638 | 81.55 | 28 | 27 | 7.5 |
| B | 0 | 186 | 621 | 79.28 | 28 | 27 | 7.5 |
| B | 12 | 111 | 604 | 77.01 | 28 | 27 | 7.5 |
| C | 15 | 214 | 10423 | 1235.86 | 28 | 28 | 8.4 |
| C | 0 | 207 | 7903 | 936.26 | 28 | 28 | 8.4 |
| C | 3 | 233 | 919 | 105.93 | 28 | 28 | 8.4 |
| D | 12 | 16 | 64946 | 7548.23 | 27 | 26 | 8.6 |
| D | 7 | 223 | 4788 | 553.68 | 27 | 26 | 8.6 |
| D | 1 | 52 | 3993 | 461.24 | 27 | 26 | 8.6 |
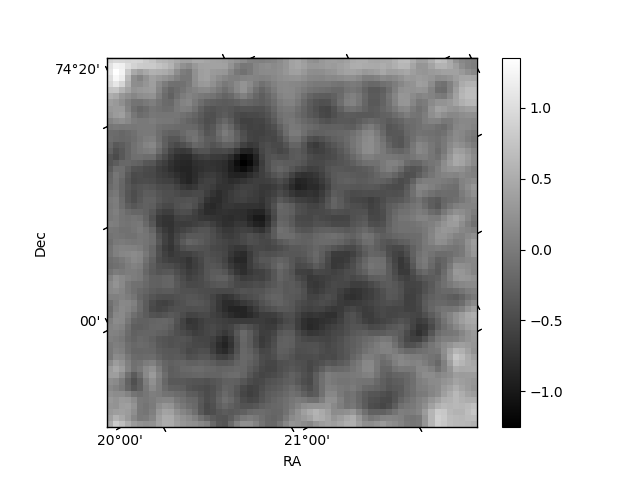
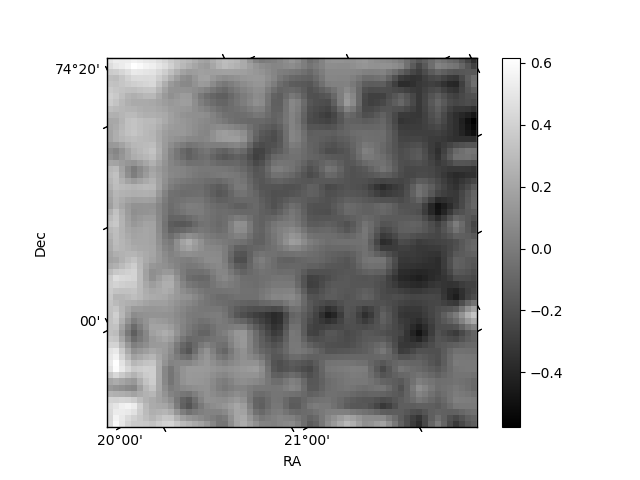
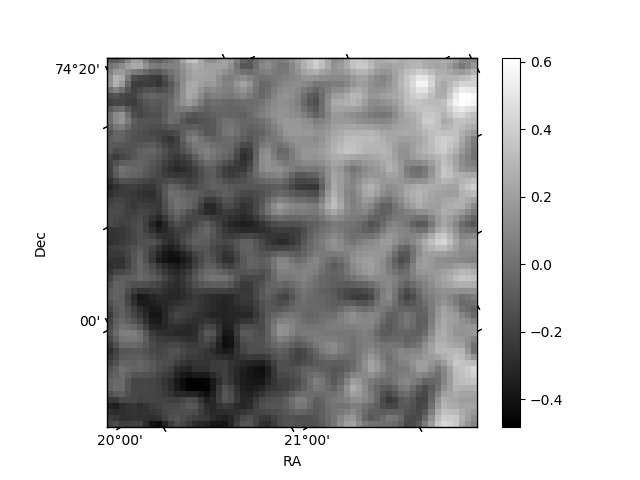
Histogram calculated using DETX and DETY for each event in the final _common_clean file
| Quadrant A | 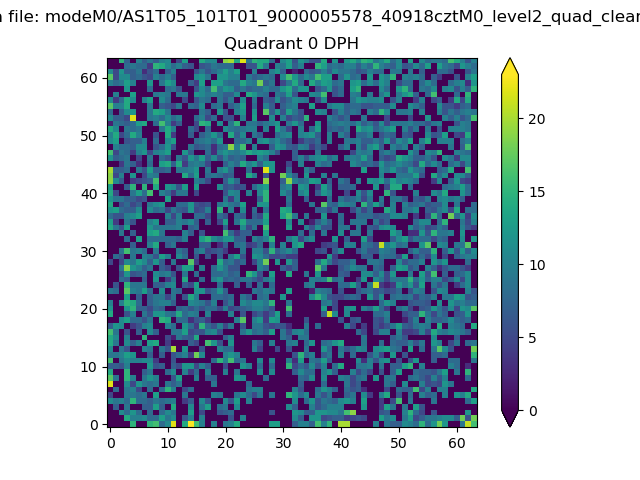 |
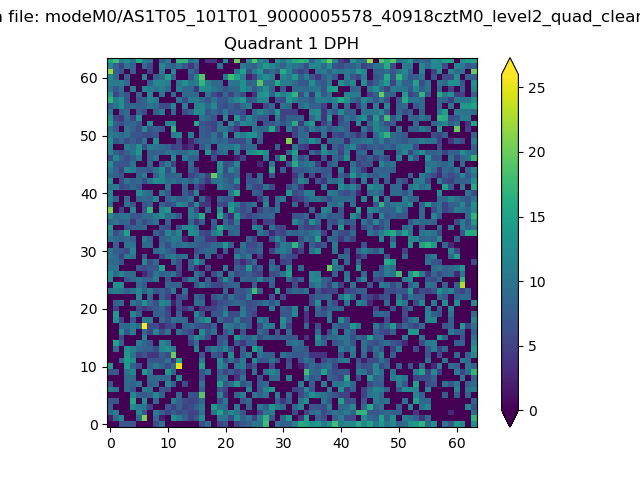 |
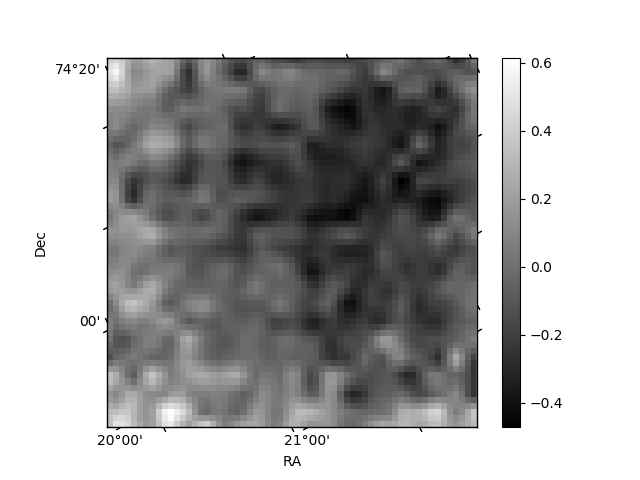
Quadrant B |
|---|---|---|---|
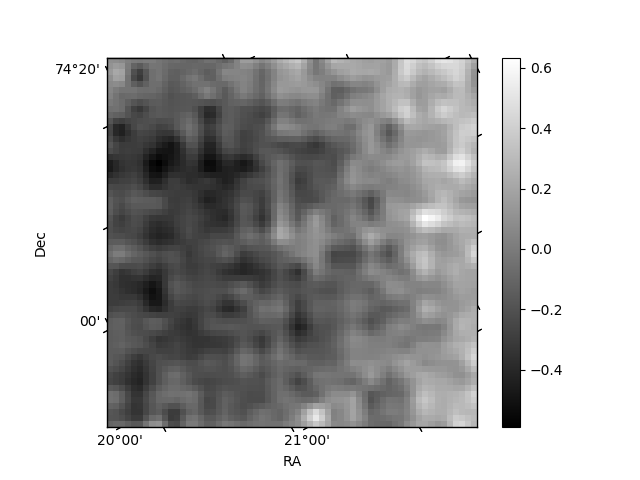
| Quadrant D | 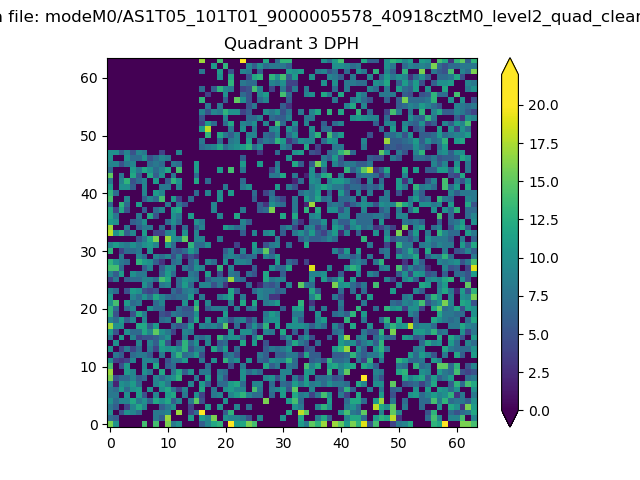 |
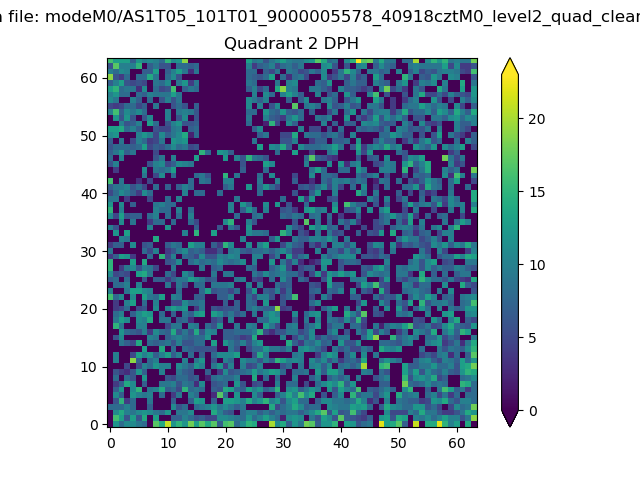 |
Quadrant C |
| Plot type | Count rate plots | Images |
|---|---|---|
| Comparison with Poisson distribution Blue bars denote a histogram of data divided into 1 sec bins. Red curve is a Poisson curve with rate = median count rate of data. |
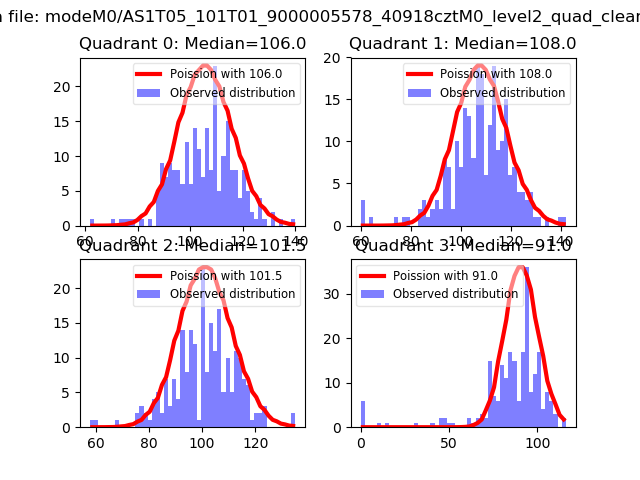 |
 |
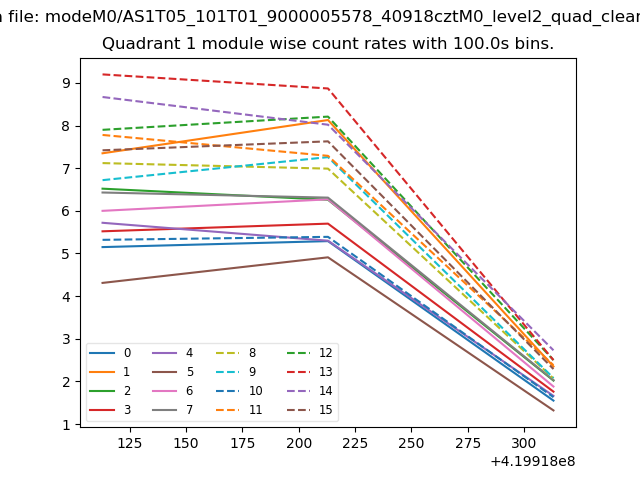
| Quadrant-wise count rates Data is divided into 100 sec bins |
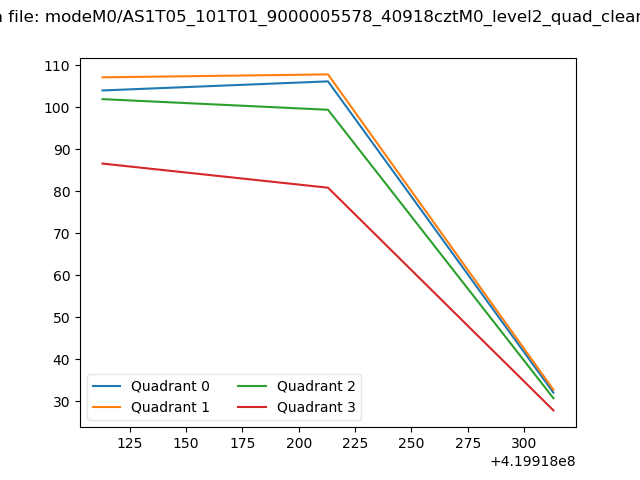 |
|
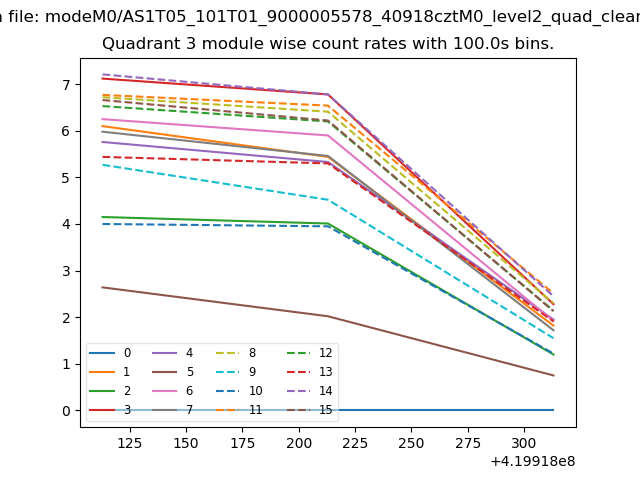
| Module-wise count rates for Quadrant A Data is divided into 100 sec bins |
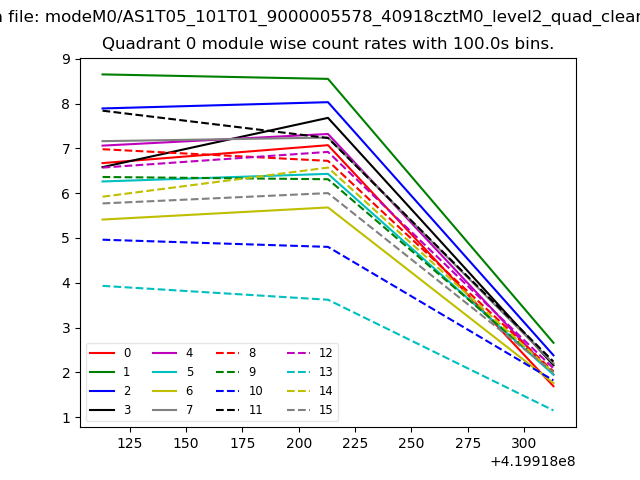 |
 |
| Module-wise count rates for Quadrant B Data is divided into 100 sec bins |
 |
 |
| Module-wise count rates for Quadrant C Data is divided into 100 sec bins |
 |
 |
| Module-wise count rates for Quadrant D Data is divided into 100 sec bins |
 |
 |
| Parameter | Plot |
|---|---|
| CZT HV Monitor | 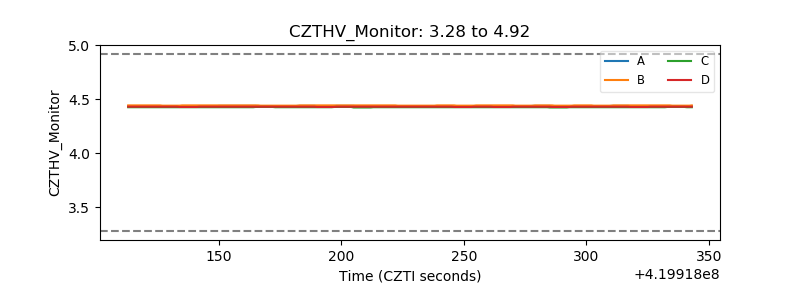 |
| D_VDD | 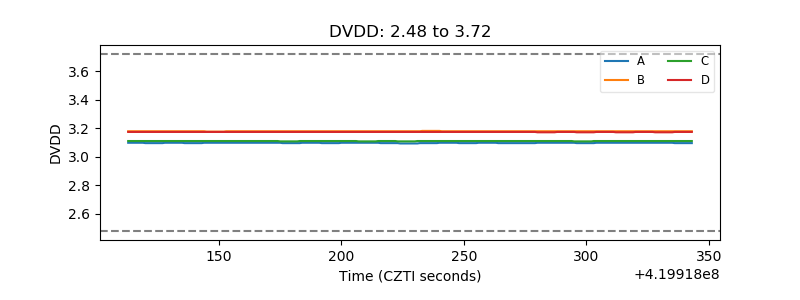 |
| Temperature 1 | 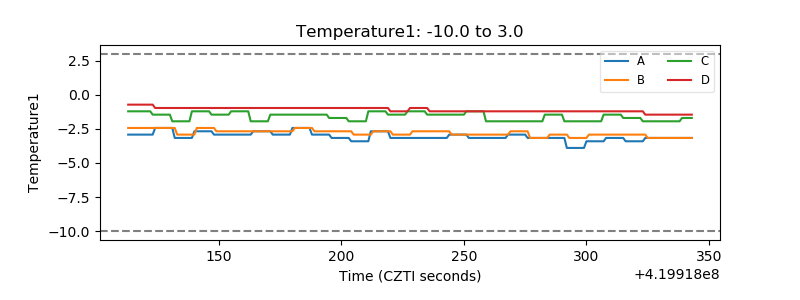 |
| Veto HV Monitor | 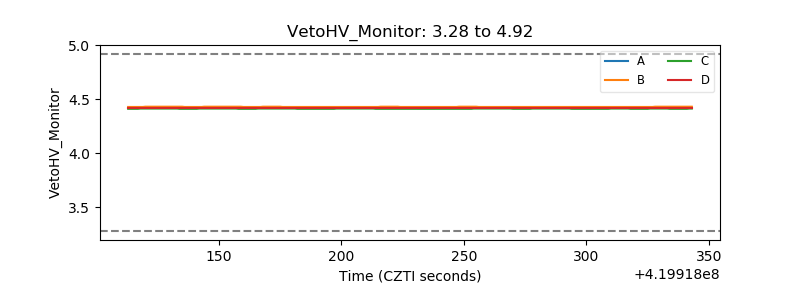 |
| Veto LLD | 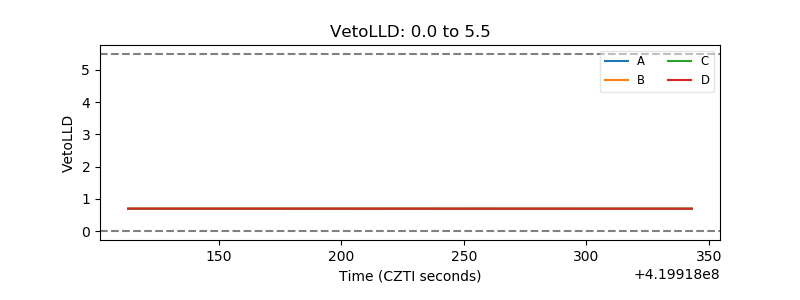 |
| Alpha Counter | 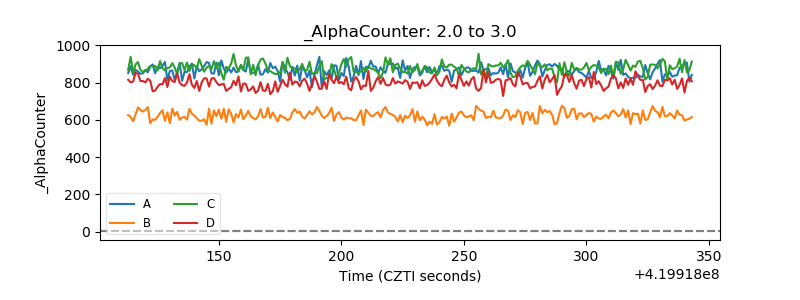 |
| _CPM_Rate | 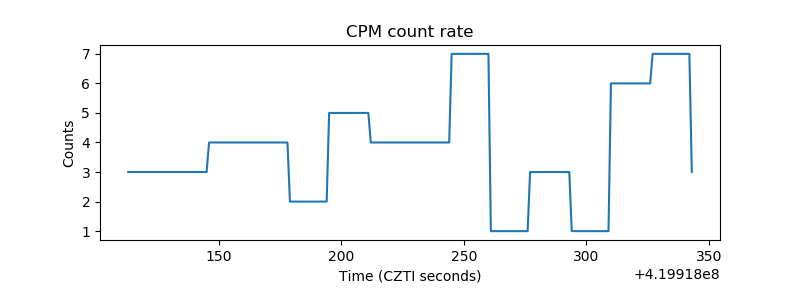 |
| CZT Counter | 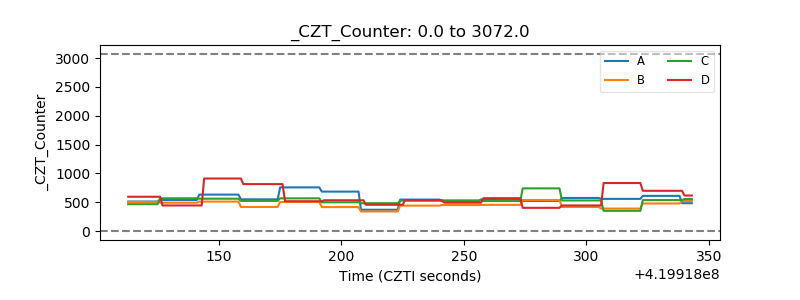 |
| +2.5 Volts monitor | 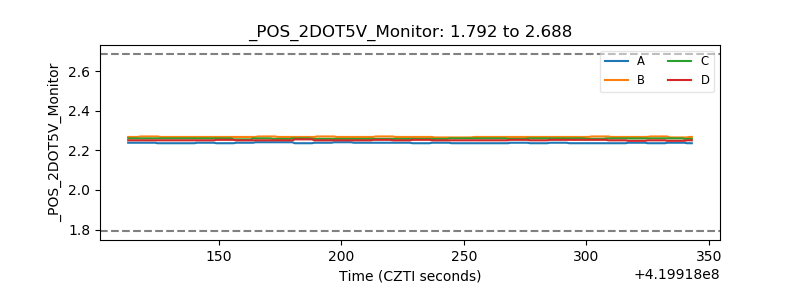 |
| +5 Volts monitor | 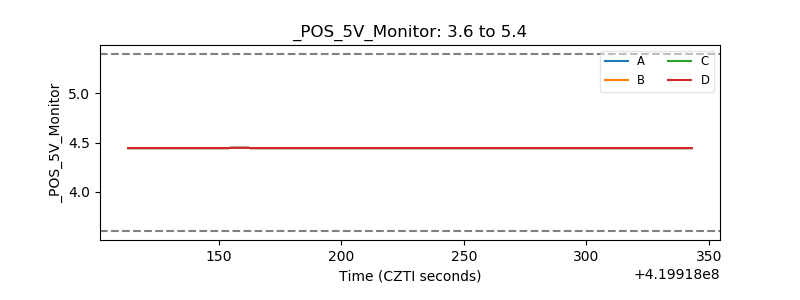 |
| _ROLL_ROT | 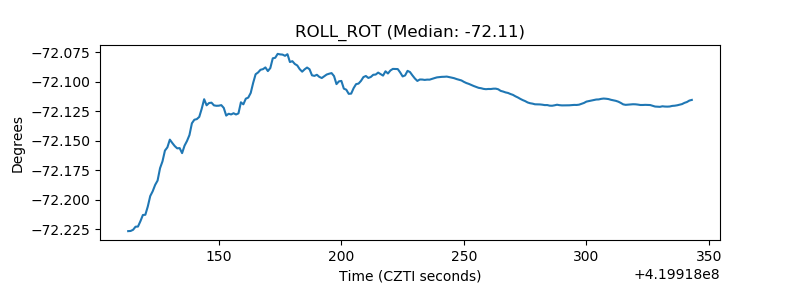 |
| _Roll_DEC |  |
| _Roll_RA | 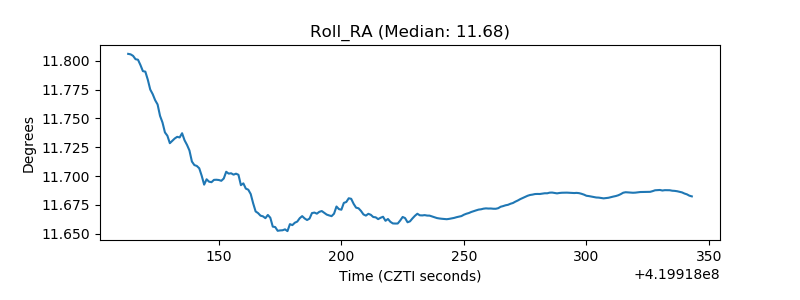 |
| Veto Counter | 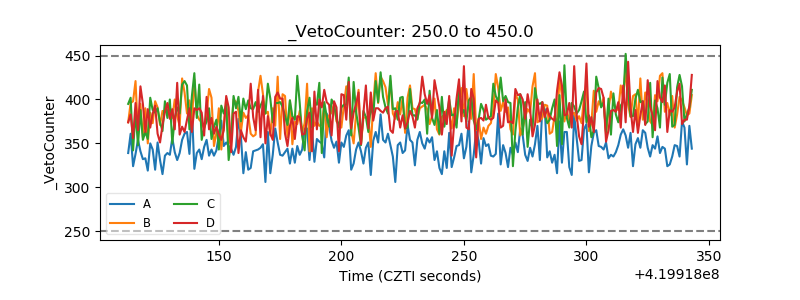 |