| Param | Original file | Final file |
|---|---|---|
| Filename | modeM0/AS1A12_029T02_9000005590_41012cztM0_level2.fits | modeM0/AS1A12_029T02_9000005590_41012cztM0_level2_quad_clean.evt |
| Size (bytes) | 321,624,000 | 86,304,960 |
| Size | 306.7 MB | 82.3 MB |
| Events in quadrant A | 2,699,622 | 590,496 |
| Events in quadrant B | 2,256,431 | 604,991 |
| Events in quadrant C | 3,210,077 | 559,394 |
| Events in quadrant D | 3,358,415 | 516,086 |
| Mode SS | |||
|---|---|---|---|
| Quadrant | BADHDUFLAG | Total packets | Discarded packets |
| A | 0 | 98 | 0 |
| B | 0 | 98 | 0 |
| C | 0 | 98 | 0 |
| D | 0 | 98 | 0 |
| Mode M0 | |||
|---|---|---|---|
| Quadrant | BADHDUFLAG | Total packets | Discarded packets |
| A | 0 | 11033 | 3 |
| B | 0 | 10017 | 2 |
| C | 0 | 12559 | 2 |
| D | 0 | 13406 | 2 |
| Mode M9 | |||
|---|---|---|---|
| Quadrant | BADHDUFLAG | Total packets | Discarded packets |
| A | 0 | 35 | 0 |
| B | 0 | 35 | 0 |
| C | 0 | 35 | 0 |
| D | 0 | 36 | 0 |
| Quadrant | Total seconds | Saturated seconds | Saturation percentage |
|---|---|---|---|
| A | 4887 | 12 | 0.245549% |
| B | 4887 | 10 | 0.204625% |
| C | 4887 | 222 | 4.542664% |
| D | 4887 | 245 | 5.013301% |
Noise dominated data is calculated using 1-second bins in cleaned event files. If a bin has >2000 counts, and if more than 50% of those come from <1% of pixels, then it is considered to be noise-dominated and hence unusable.
| Quadrant | # 1 sec bins | Bins with >0 counts | Bins with >2000 counts | High rate bins dominated by noise | Noise dominated (total time) | Noise dominated (detector-on time) | Marked lightcurve |
|---|---|---|---|---|---|---|---|
| A | 7010 | 4888 | 4 | 4 | 0.06% | 0.08% | 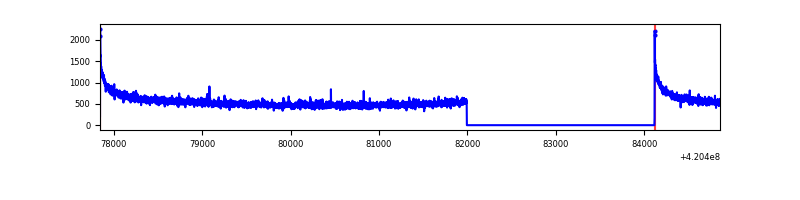 |
| B | 7010 | 4888 | 3 | 3 | 0.04% | 0.06% | 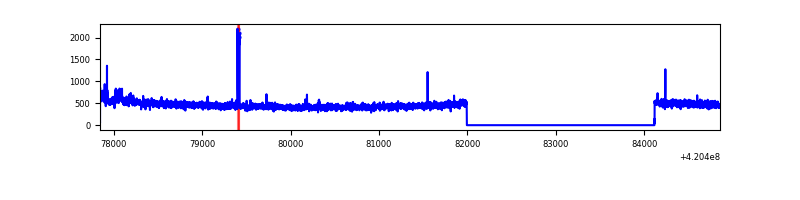 |
| C | 7010 | 4888 | 200 | 200 | 2.85% | 4.09% | 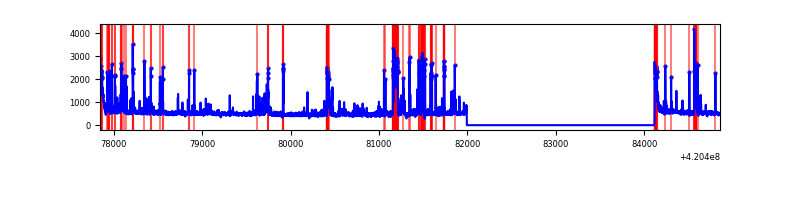 |
| D | 7010 | 4888 | 224 | 224 | 3.20% | 4.58% | 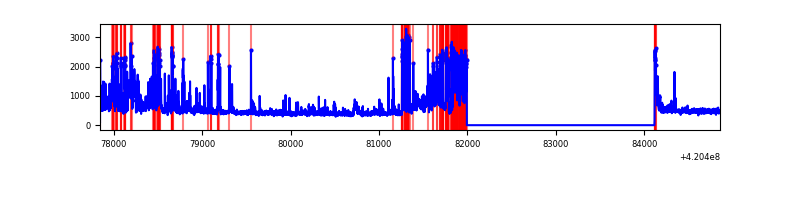 |
Top three noisy pixels from each quadrant. If the there are fewer than three noisy pixels in the level2.evt file, extra rows are filled as -1
| Pixel properties | Quadrant properties | ||||||
|---|---|---|---|---|---|---|---|
| Quadrant | DetID | PixID | Counts | Sigma | Mean | Median | Sigma |
| A | 10 | 83 | 490541 | 4275.39 | 561 | 549 | 114.6 |
| A | 12 | 189 | 31137 | 266.89 | 561 | 549 | 114.6 |
| A | 13 | 254 | 8185 | 66.62 | 561 | 549 | 114.6 |
| B | 0 | 186 | 35994 | 329.23 | 559 | 545 | 107.7 |
| B | 5 | 252 | 18886 | 170.34 | 559 | 545 | 107.7 |
| B | 12 | 111 | 13325 | 118.69 | 559 | 545 | 107.7 |
| C | 14 | 254 | 691874 | 5484.37 | 544 | 548 | 126.1 |
| C | 15 | 214 | 208397 | 1648.89 | 544 | 548 | 126.1 |
| C | 0 | 10 | 126425 | 998.6 | 544 | 548 | 126.1 |
| D | 13 | 249 | 400646 | 3041.73 | 544 | 530 | 131.5 |
| D | 2 | 249 | 269613 | 2045.6 | 544 | 530 | 131.5 |
| D | 12 | 79 | 235082 | 1783.09 | 544 | 530 | 131.5 |
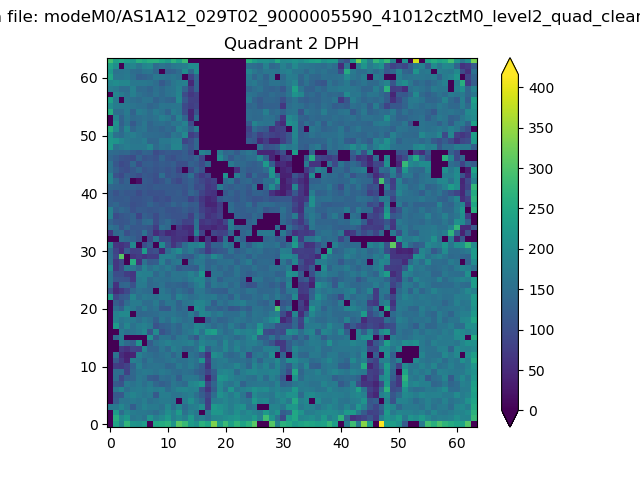
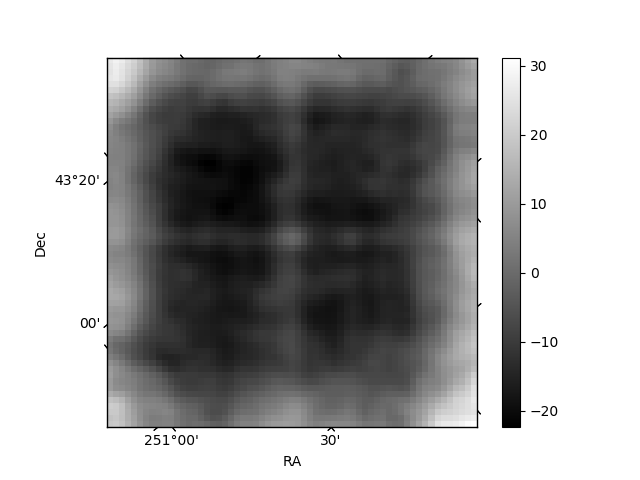
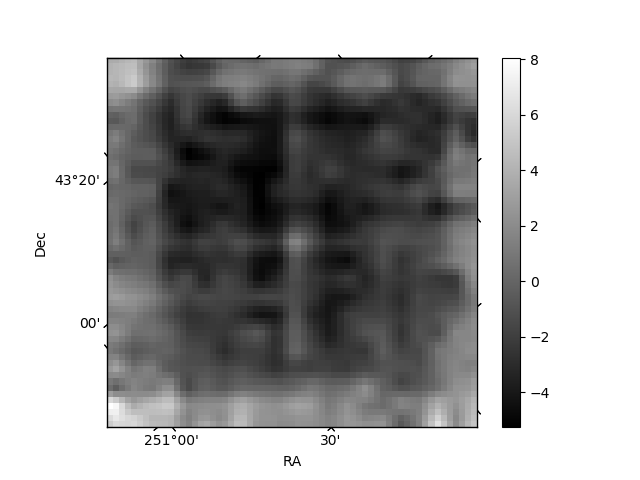
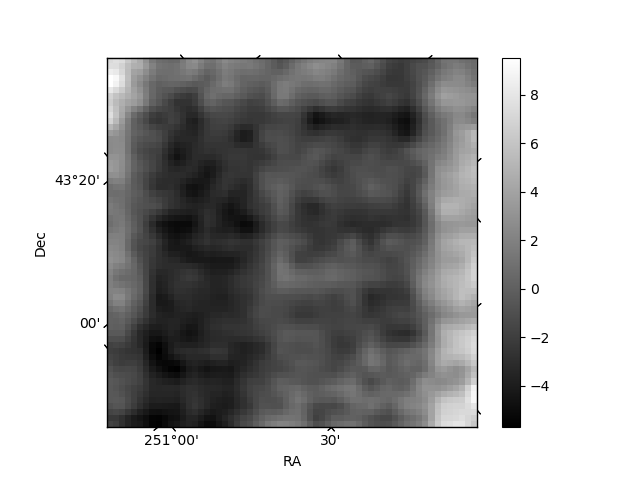
Histogram calculated using DETX and DETY for each event in the final _common_clean file
| Quadrant A | 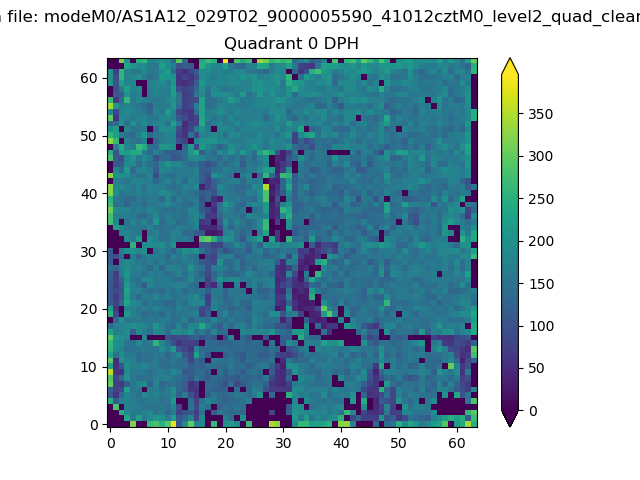 |
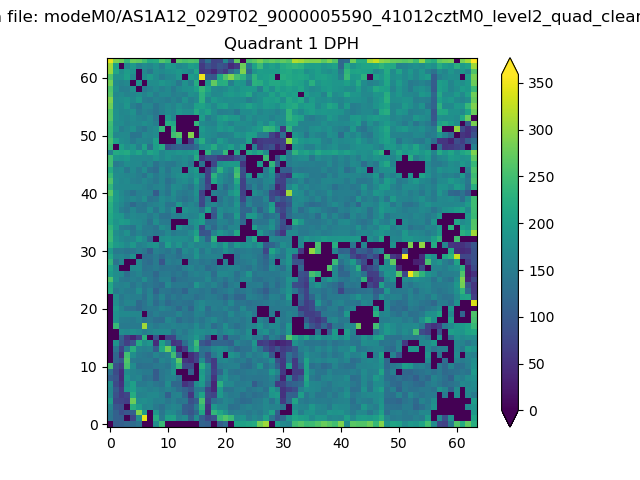 |
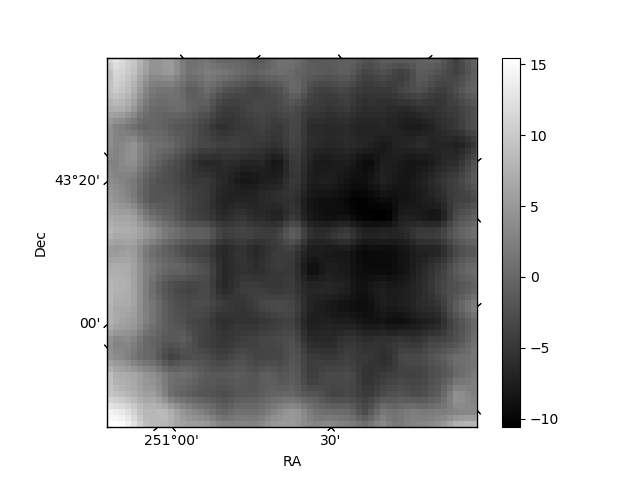
Quadrant B |
|---|---|---|---|
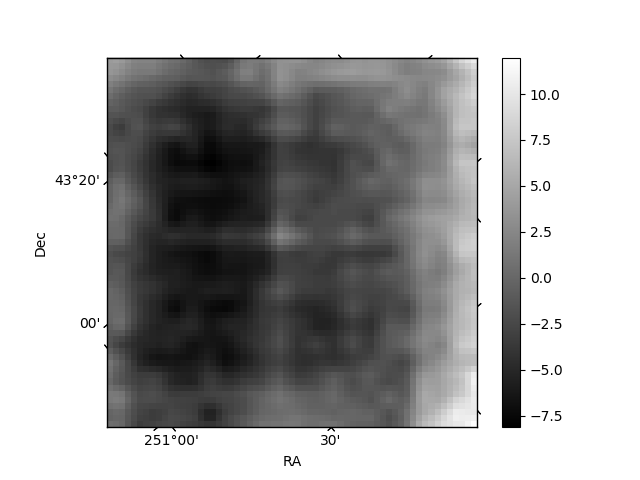
| Quadrant D | 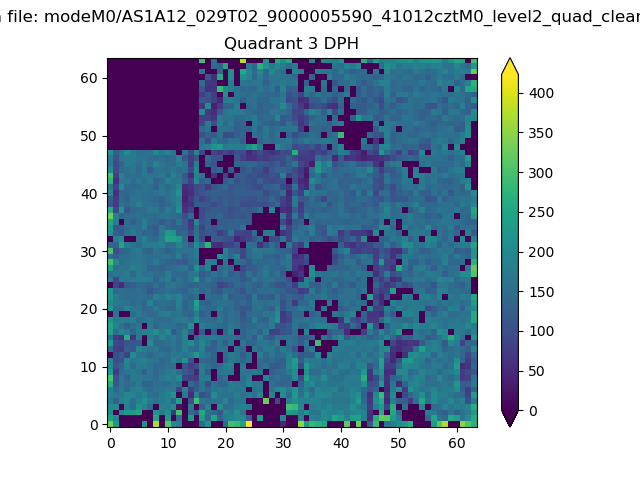 |
 |
Quadrant C |
| Plot type | Count rate plots | Images |
|---|---|---|
| Comparison with Poisson distribution Blue bars denote a histogram of data divided into 1 sec bins. Red curve is a Poisson curve with rate = median count rate of data. |
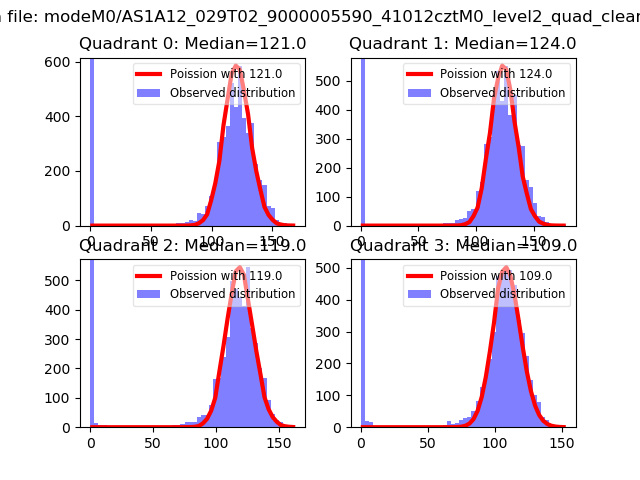 |
 |
| Quadrant-wise count rates Data is divided into 100 sec bins |
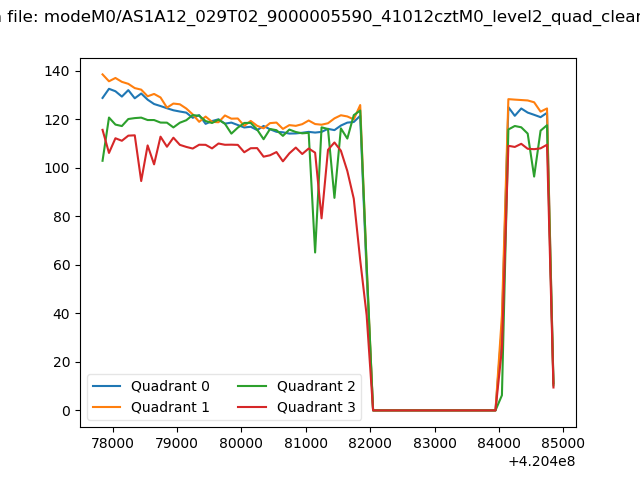 |
|
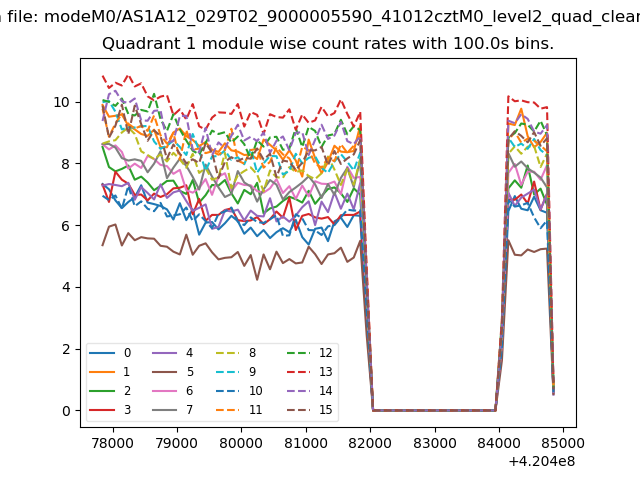
| Module-wise count rates for Quadrant A Data is divided into 100 sec bins |
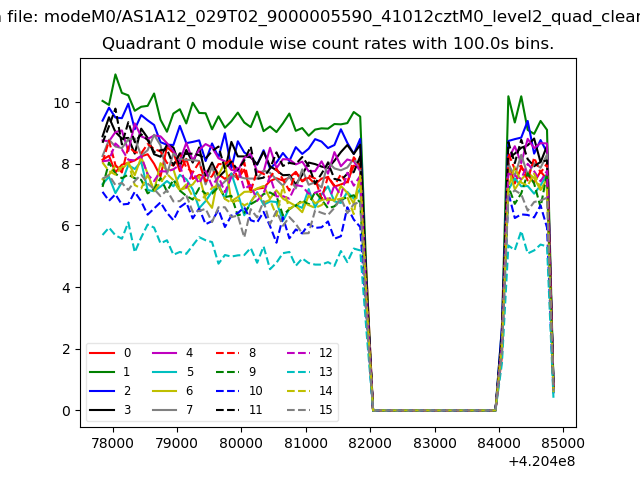 |
 |
| Module-wise count rates for Quadrant B Data is divided into 100 sec bins |
 |
 |
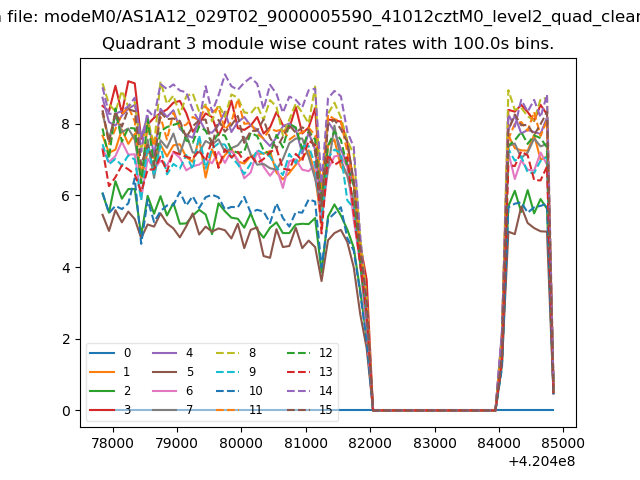
| Module-wise count rates for Quadrant C Data is divided into 100 sec bins |
 |
 |
| Module-wise count rates for Quadrant D Data is divided into 100 sec bins |
 |
 |
| Parameter | Plot |
|---|---|
| CZT HV Monitor |  |
| D_VDD | 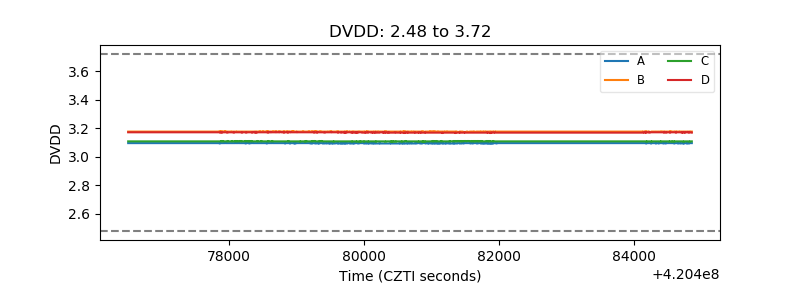 |
| Temperature 1 | 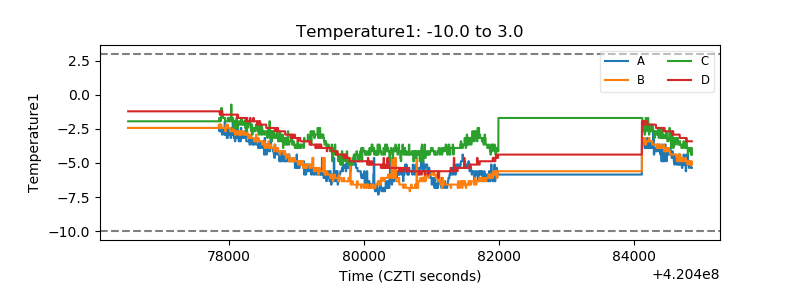 |
| Veto HV Monitor | 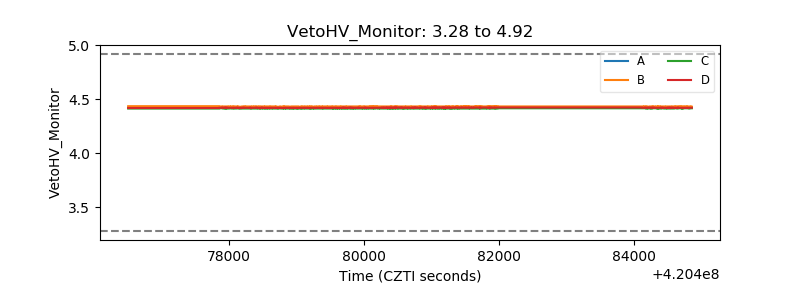 |
| Veto LLD | 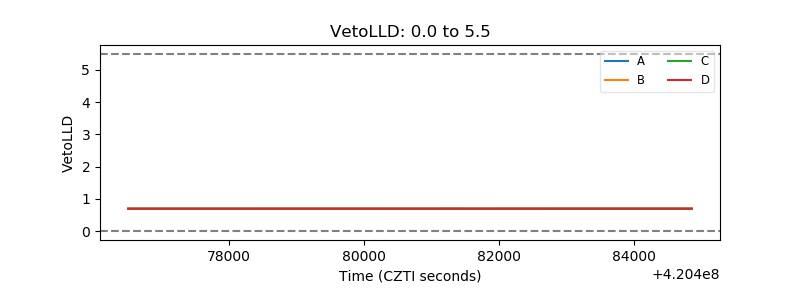 |
| Alpha Counter | 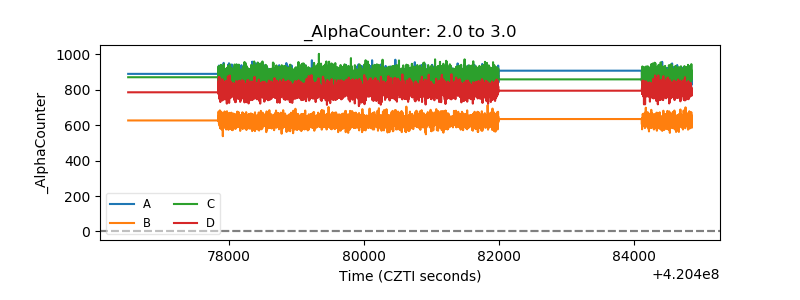 |
| _CPM_Rate | 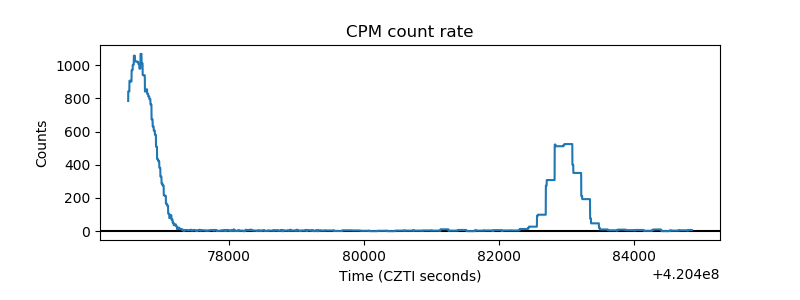 |
| CZT Counter | 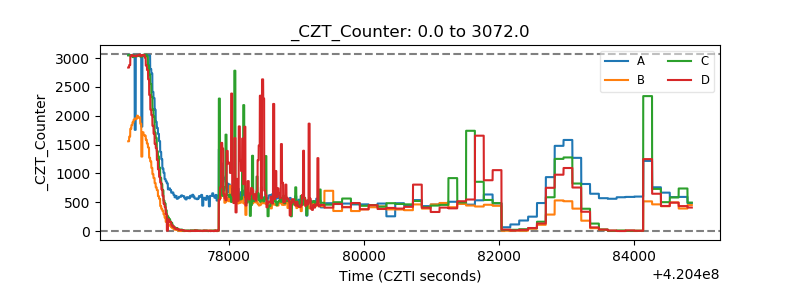 |
| +2.5 Volts monitor | 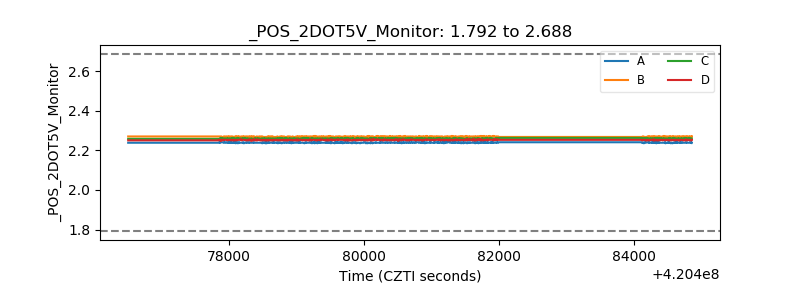 |
| +5 Volts monitor | 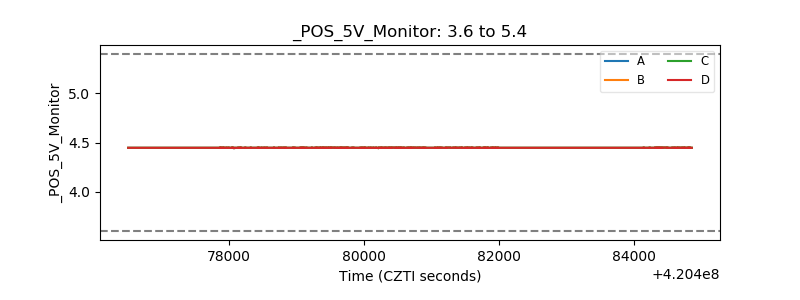 |
| _ROLL_ROT | 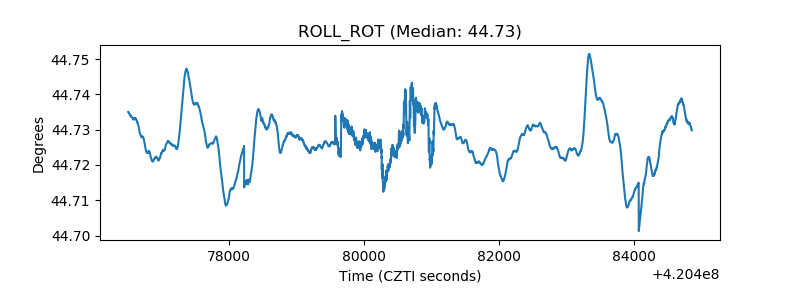 |
| _Roll_DEC | 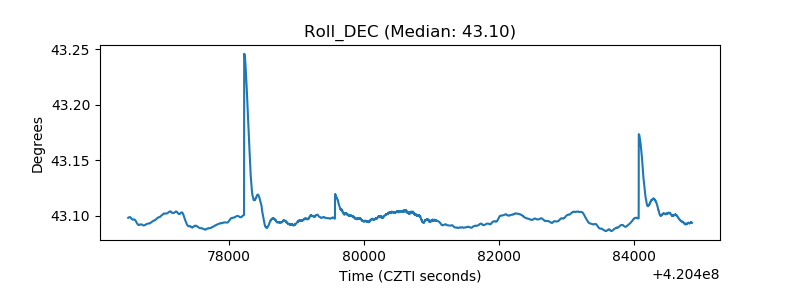 |
| _Roll_RA | 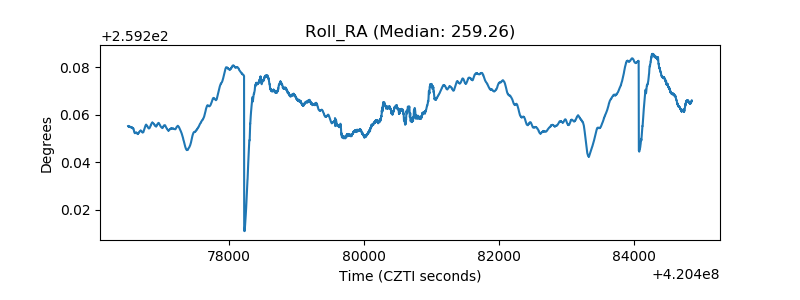 |
| Veto Counter | 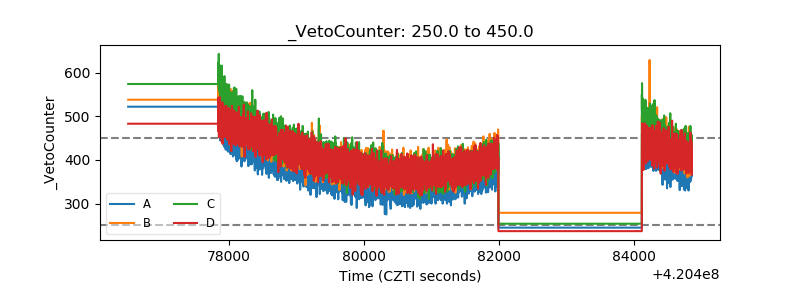 |