| Param | Original file | Final file |
|---|---|---|
| Filename | modeM0/AS1A12_095T02_9000005596_41070cztM0_level2.fits | modeM0/AS1A12_095T02_9000005596_41070cztM0_level2_quad_clean.evt |
| Size (bytes) | 150,045,120 | 37,509,120 |
| Size | 143.1 MB | 35.8 MB |
| Events in quadrant A | 1,277,908 | 258,714 |
| Events in quadrant B | 1,178,545 | 261,884 |
| Events in quadrant C | 1,156,189 | 247,477 |
| Events in quadrant D | 1,771,894 | 212,591 |
| Mode M0 | |||
|---|---|---|---|
| Quadrant | BADHDUFLAG | Total packets | Discarded packets |
| A | 0 | 5126 | 2 |
| B | 0 | 4882 | 1 |
| C | 0 | 4654 | 1 |
| D | 0 | 6679 | 1 |
| Mode SS | |||
|---|---|---|---|
| Quadrant | BADHDUFLAG | Total packets | Discarded packets |
| A | 0 | 44 | 0 |
| B | 0 | 44 | 0 |
| C | 0 | 44 | 0 |
| D | 0 | 44 | 0 |
| Mode M9 | |||
|---|---|---|---|
| Quadrant | BADHDUFLAG | Total packets | Discarded packets |
| A | 0 | 22 | 0 |
| B | 0 | 22 | 0 |
| C | 0 | 22 | 0 |
| D | 0 | 22 | 0 |
| Quadrant | Total seconds | Saturated seconds | Saturation percentage |
|---|---|---|---|
| A | 2150 | 10 | 0.465116% |
| B | 2150 | 13 | 0.604651% |
| C | 2150 | 36 | 1.674419% |
| D | 2150 | 242 | 11.255814% |
Noise dominated data is calculated using 1-second bins in cleaned event files. If a bin has >2000 counts, and if more than 50% of those come from <1% of pixels, then it is considered to be noise-dominated and hence unusable.
| Quadrant | # 1 sec bins | Bins with >0 counts | Bins with >2000 counts | High rate bins dominated by noise | Noise dominated (total time) | Noise dominated (detector-on time) | Marked lightcurve |
|---|---|---|---|---|---|---|---|
| A | 4273 | 2151 | 2 | 2 | 0.05% | 0.09% |  |
| B | 4273 | 2151 | 4 | 4 | 0.09% | 0.19% | 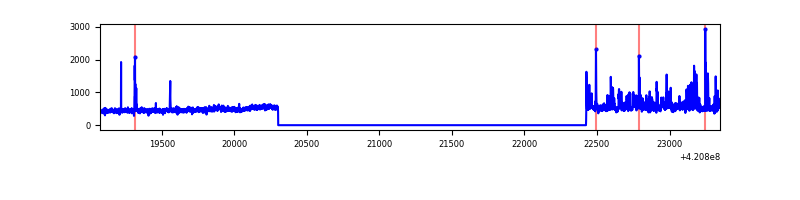 |
| C | 4273 | 2151 | 36 | 36 | 0.84% | 1.67% | 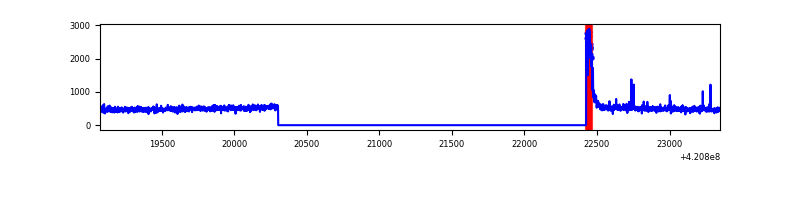 |
| D | 4273 | 2151 | 229 | 229 | 5.36% | 10.65% | 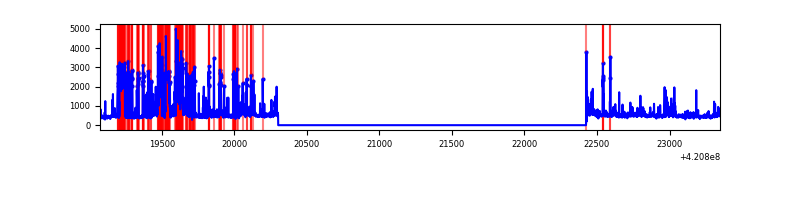 |
Top three noisy pixels from each quadrant. If the there are fewer than three noisy pixels in the level2.evt file, extra rows are filled as -1
| Pixel properties | Quadrant properties | ||||||
|---|---|---|---|---|---|---|---|
| Quadrant | DetID | PixID | Counts | Sigma | Mean | Median | Sigma |
| A | 10 | 83 | 237493 | 4433.29 | 252 | 247 | 53.5 |
| A | 12 | 189 | 56396 | 1049.23 | 252 | 247 | 53.5 |
| A | 13 | 6 | 4763 | 84.39 | 252 | 247 | 53.5 |
| B | 0 | 190 | 95776 | 1915.2 | 250 | 243 | 49.9 |
| B | 0 | 186 | 29265 | 581.82 | 250 | 243 | 49.9 |
| B | 15 | 85 | 28661 | 569.71 | 250 | 243 | 49.9 |
| C | 0 | 10 | 96722 | 1661.35 | 244 | 245 | 58.1 |
| C | 15 | 214 | 92282 | 1584.9 | 244 | 245 | 58.1 |
| C | 14 | 254 | 10864 | 182.86 | 244 | 245 | 58.1 |
| D | 2 | 16 | 387015 | 6583.04 | 235 | 227 | 58.8 |
| D | 13 | 249 | 334655 | 5691.89 | 235 | 227 | 58.8 |
| D | 2 | 153 | 29409 | 496.67 | 235 | 227 | 58.8 |
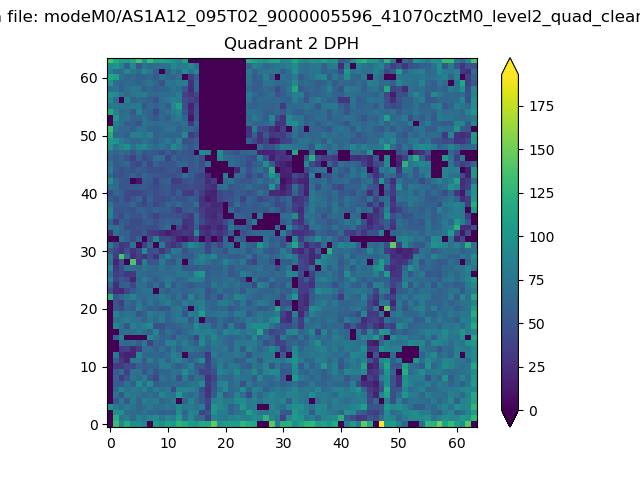
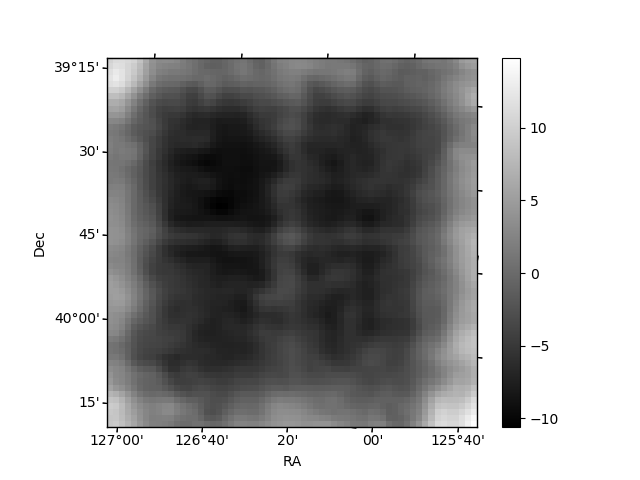
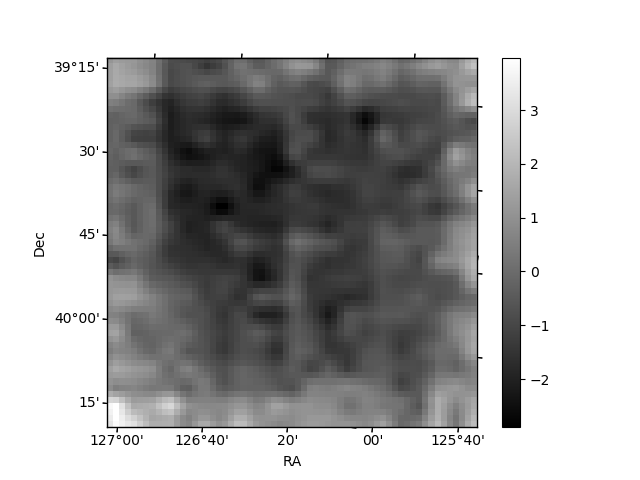
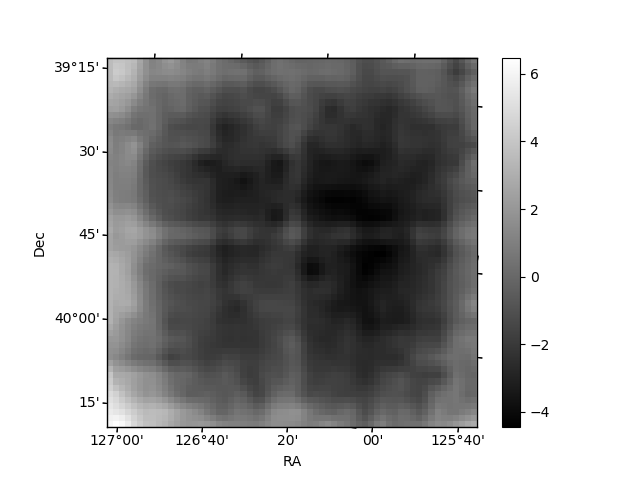
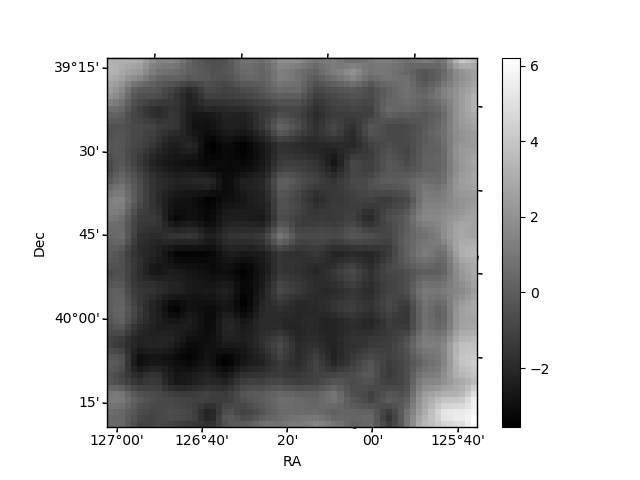
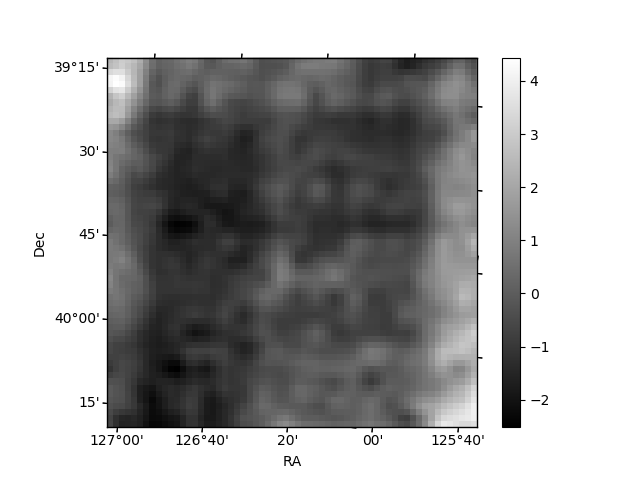
Histogram calculated using DETX and DETY for each event in the final _common_clean file
| Quadrant A | 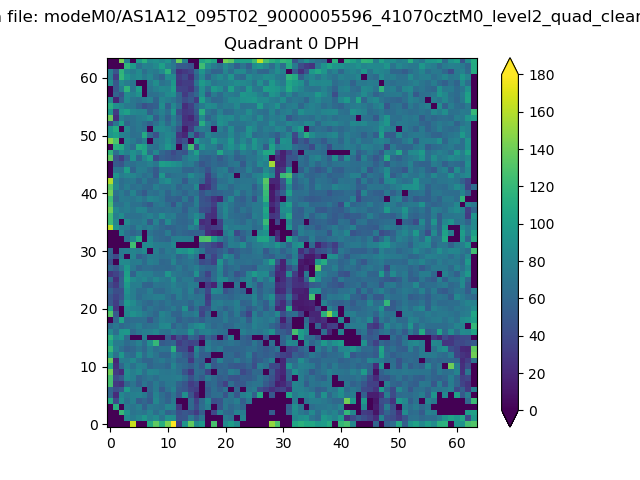 |
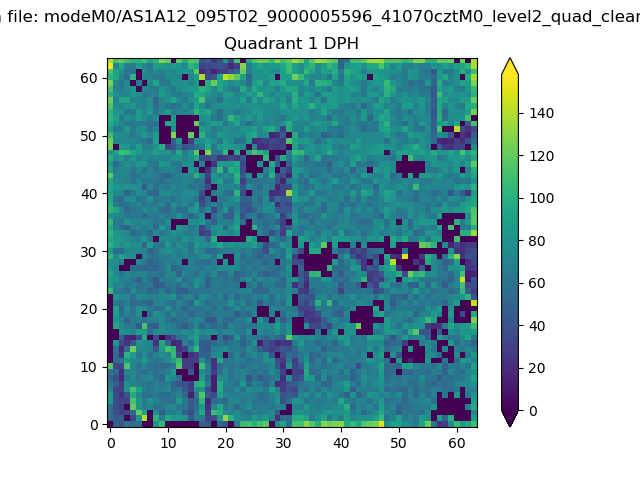 |
Quadrant B |
|---|---|---|---|
| Quadrant D | 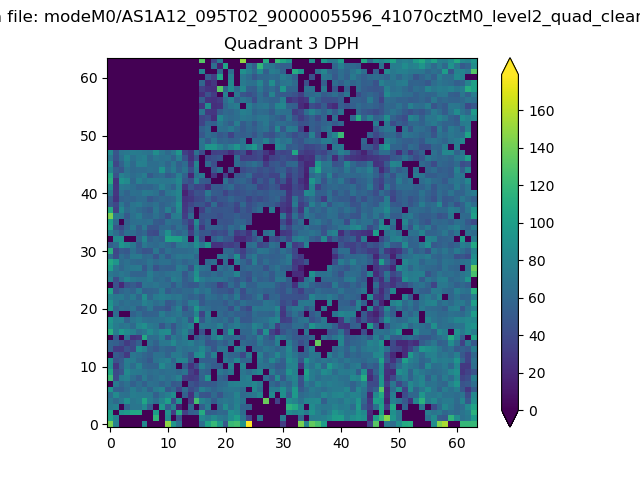 |
 |
Quadrant C |
| Plot type | Count rate plots | Images |
|---|---|---|
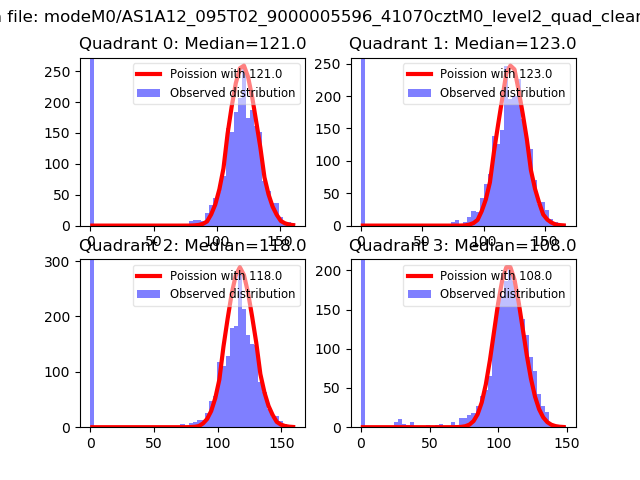
| Comparison with Poisson distribution Blue bars denote a histogram of data divided into 1 sec bins. Red curve is a Poisson curve with rate = median count rate of data. |
 |
 |
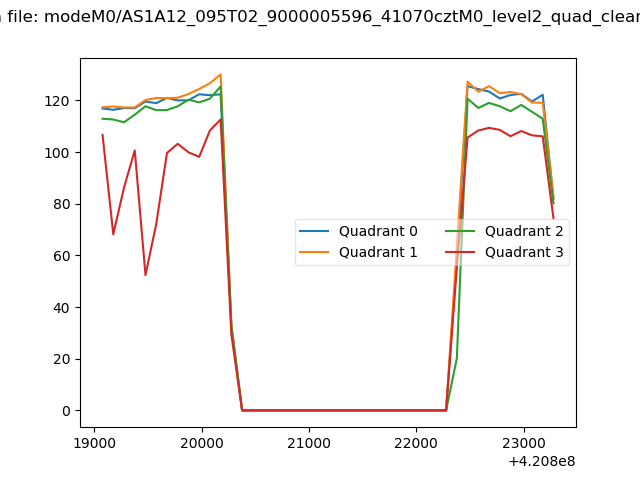
| Quadrant-wise count rates Data is divided into 100 sec bins |
 |
|
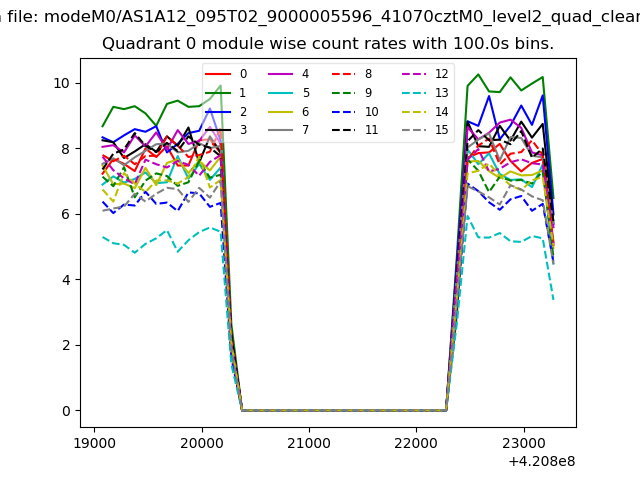
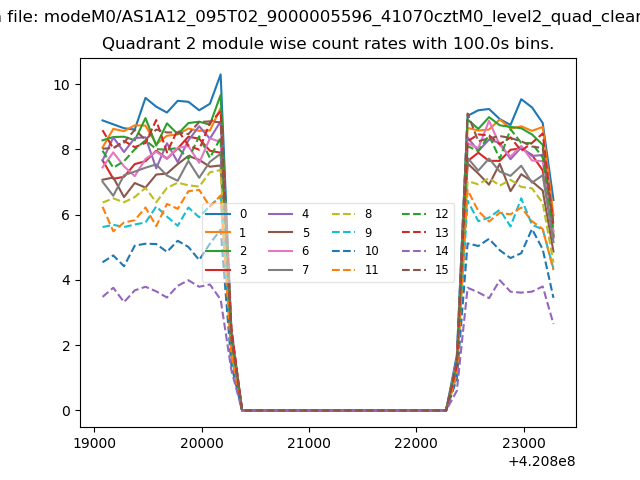
| Module-wise count rates for Quadrant A Data is divided into 100 sec bins |
 |
 |
| Module-wise count rates for Quadrant B Data is divided into 100 sec bins |
 |
 |
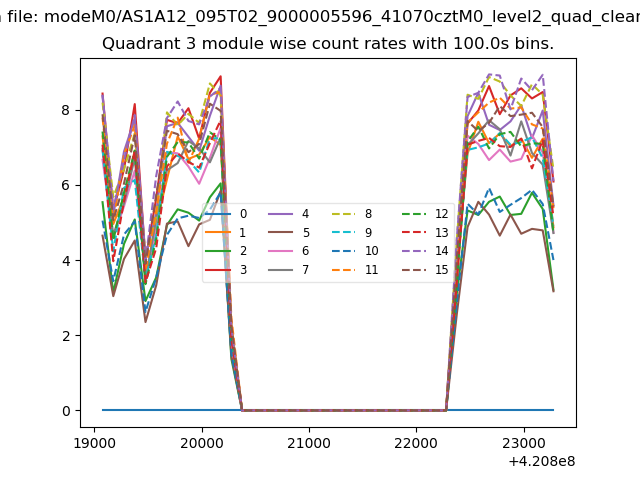
| Module-wise count rates for Quadrant C Data is divided into 100 sec bins |
 |
 |
| Module-wise count rates for Quadrant D Data is divided into 100 sec bins |
 |
 |
| Parameter | Plot |
|---|---|
| CZT HV Monitor | 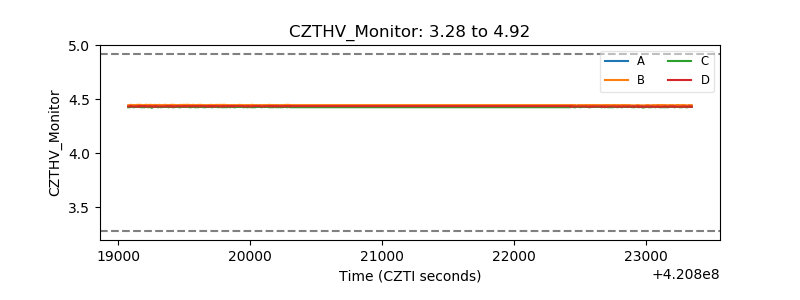 |
| D_VDD | 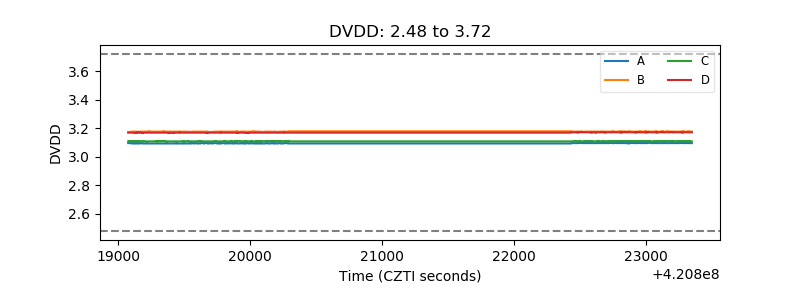 |
| Temperature 1 | 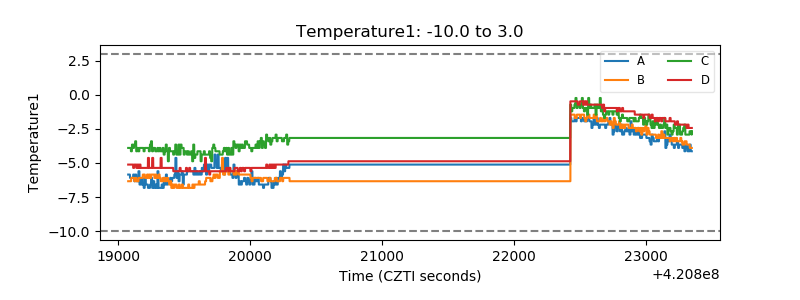 |
| Veto HV Monitor |  |
| Veto LLD | 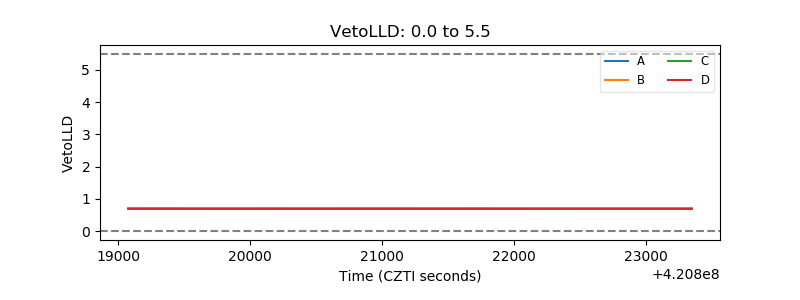 |
| Alpha Counter | 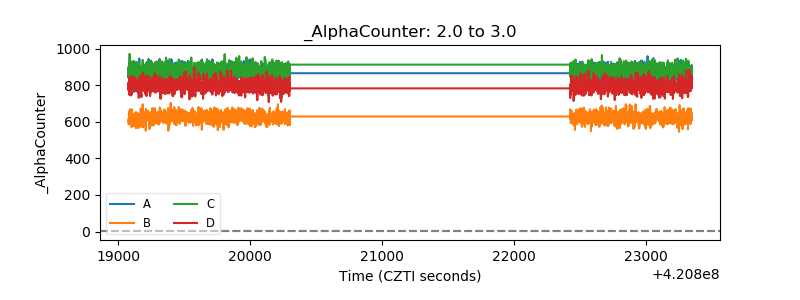 |
| _CPM_Rate |  |
| CZT Counter | 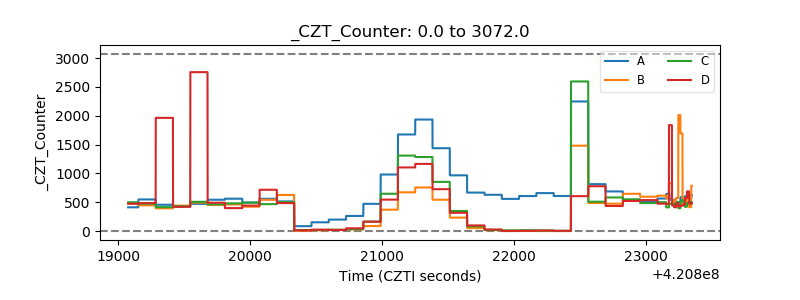 |
| +2.5 Volts monitor |  |
| +5 Volts monitor | 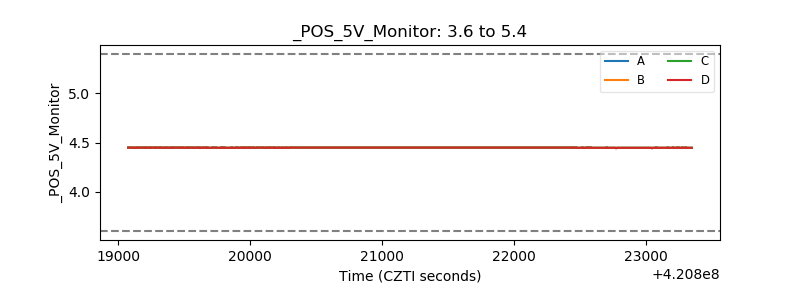 |
| _ROLL_ROT | 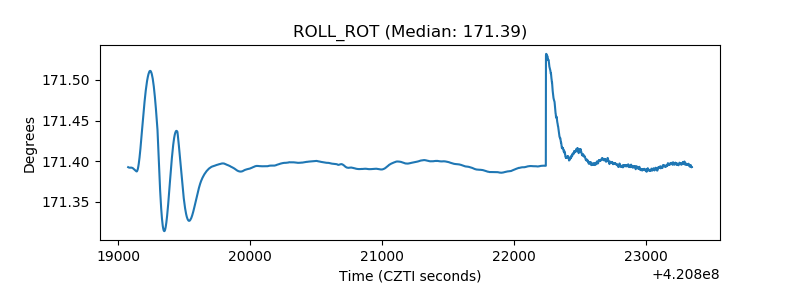 |
| _Roll_DEC | 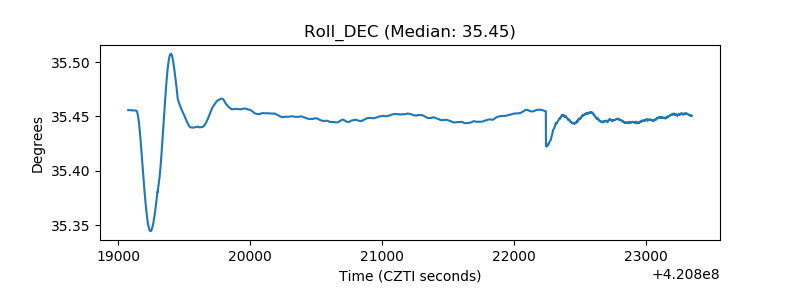 |
| _Roll_RA | 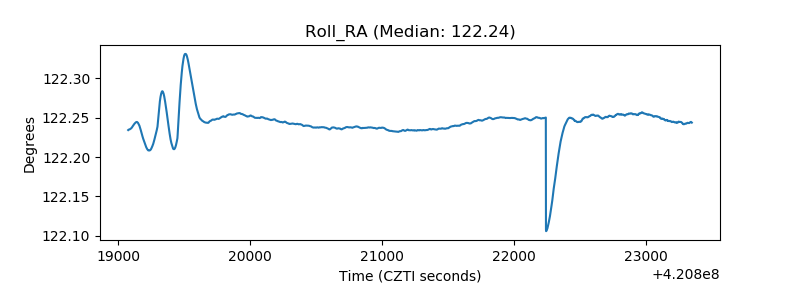 |
| Veto Counter | 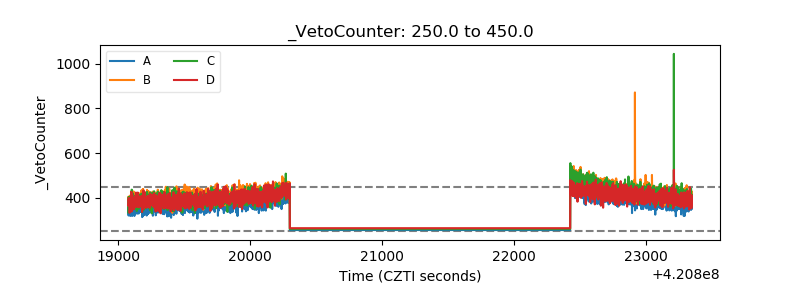 |