| Param | Original file | Final file |
|---|---|---|
| Filename | modeM0/AS1A12_035T01_9000005666_41411cztM0_level2.fits | modeM0/AS1A12_035T01_9000005666_41411cztM0_level2_quad_clean.evt |
| Size (bytes) | 345,288,960 | 90,270,720 |
| Size | 329.3 MB | 86.1 MB |
| Events in quadrant A | 3,190,291 | 610,786 |
| Events in quadrant B | 2,709,278 | 618,406 |
| Events in quadrant C | 3,244,171 | 564,855 |
| Events in quadrant D | 3,202,468 | 547,770 |
| Mode M0 | |||
|---|---|---|---|
| Quadrant | BADHDUFLAG | Total packets | Discarded packets |
| A | 0 | 12900 | 3 |
| B | 0 | 11831 | 2 |
| C | 0 | 13110 | 2 |
| D | 0 | 13444 | 2 |
| Mode SS | |||
|---|---|---|---|
| Quadrant | BADHDUFLAG | Total packets | Discarded packets |
| A | 0 | 116 | 0 |
| B | 0 | 116 | 0 |
| C | 0 | 116 | 0 |
| D | 0 | 116 | 0 |
| Mode M9 | |||
|---|---|---|---|
| Quadrant | BADHDUFLAG | Total packets | Discarded packets |
| A | 0 | 21 | 0 |
| B | 0 | 21 | 0 |
| C | 0 | 21 | 0 |
| D | 0 | 22 | 0 |
| Quadrant | Total seconds | Saturated seconds | Saturation percentage |
|---|---|---|---|
| A | 5588 | 17 | 0.304223% |
| B | 5588 | 36 | 0.644238% |
| C | 5588 | 253 | 4.527559% |
| D | 5588 | 93 | 1.664281% |
Noise dominated data is calculated using 1-second bins in cleaned event files. If a bin has >2000 counts, and if more than 50% of those come from <1% of pixels, then it is considered to be noise-dominated and hence unusable.
| Quadrant | # 1 sec bins | Bins with >0 counts | Bins with >2000 counts | High rate bins dominated by noise | Noise dominated (total time) | Noise dominated (detector-on time) | Marked lightcurve |
|---|---|---|---|---|---|---|---|
| A | 7140 | 5589 | 6 | 6 | 0.08% | 0.11% | 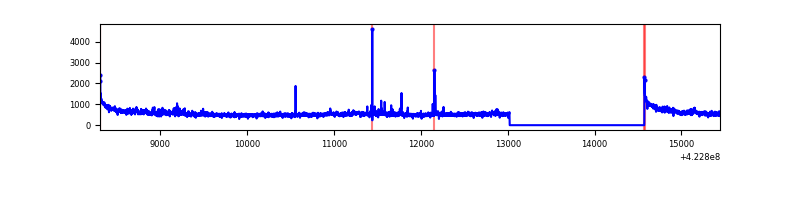 |
| B | 7140 | 5589 | 14 | 14 | 0.20% | 0.25% | 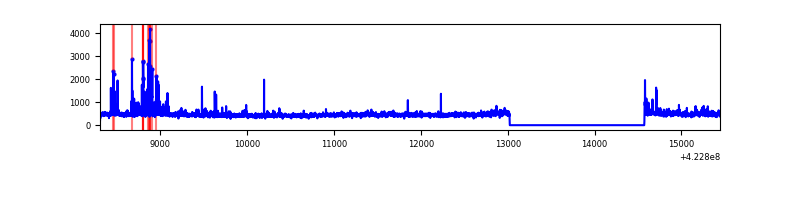 |
| C | 7140 | 5589 | 239 | 239 | 3.35% | 4.28% |  |
| D | 7140 | 5589 | 78 | 78 | 1.09% | 1.40% | 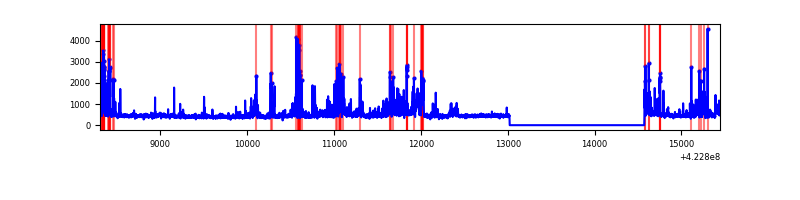 |
Top three noisy pixels from each quadrant. If the there are fewer than three noisy pixels in the level2.evt file, extra rows are filled as -1
| Pixel properties | Quadrant properties | ||||||
|---|---|---|---|---|---|---|---|
| Quadrant | DetID | PixID | Counts | Sigma | Mean | Median | Sigma |
| A | 10 | 83 | 554017 | 4336.67 | 620 | 605 | 127.6 |
| A | 2 | 79 | 146196 | 1140.88 | 620 | 605 | 127.6 |
| A | 15 | 254 | 35312 | 271.97 | 620 | 605 | 127.6 |
| B | 5 | 255 | 148636 | 1230.1 | 615 | 598 | 120.3 |
| B | 0 | 190 | 86110 | 710.55 | 615 | 598 | 120.3 |
| B | 0 | 189 | 29174 | 237.45 | 615 | 598 | 120.3 |
| C | 0 | 10 | 615409 | 4501.03 | 584 | 587 | 136.6 |
| C | 15 | 214 | 244176 | 1783.28 | 584 | 587 | 136.6 |
| C | 0 | 15 | 105031 | 764.62 | 584 | 587 | 136.6 |
| D | 1 | 52 | 481169 | 3261.11 | 603 | 586 | 147.4 |
| D | 2 | 249 | 295941 | 2004.2 | 603 | 586 | 147.4 |
| D | 13 | 249 | 52378 | 351.45 | 603 | 586 | 147.4 |
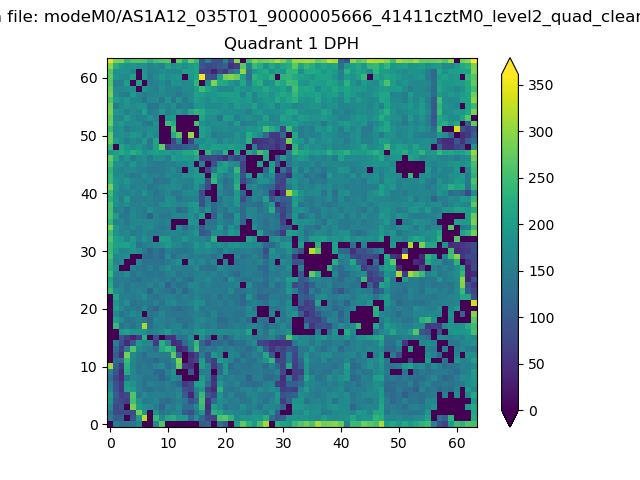
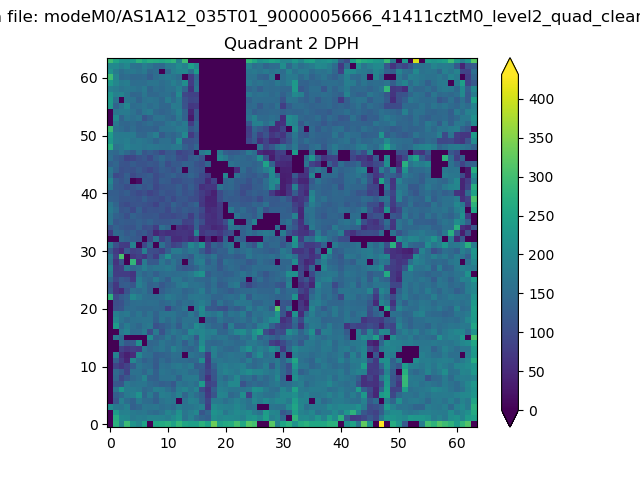
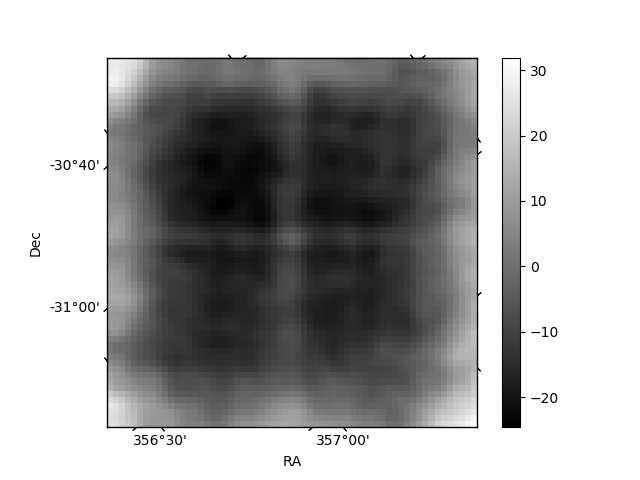
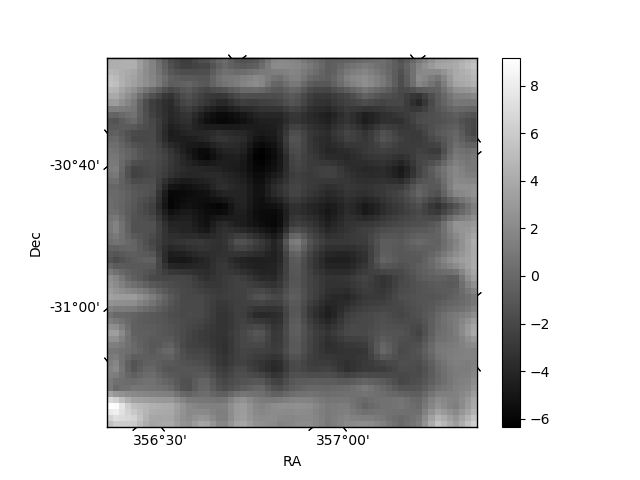
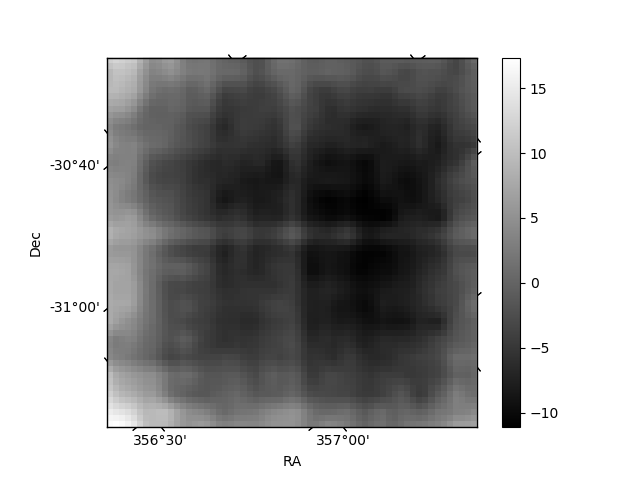
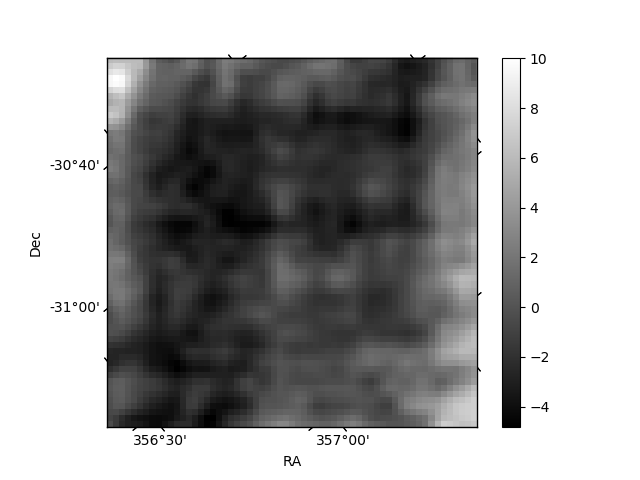
Histogram calculated using DETX and DETY for each event in the final _common_clean file
| Quadrant A | 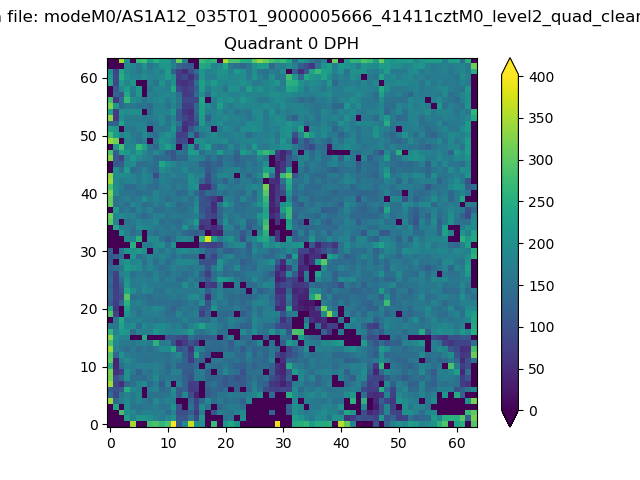 |
 |
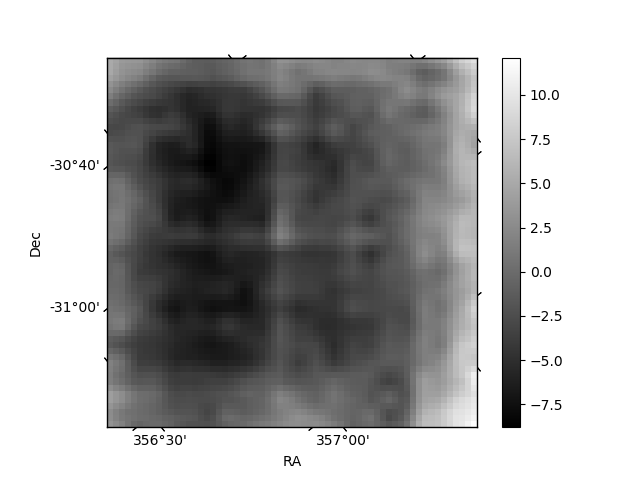
Quadrant B |
|---|---|---|---|
| Quadrant D | 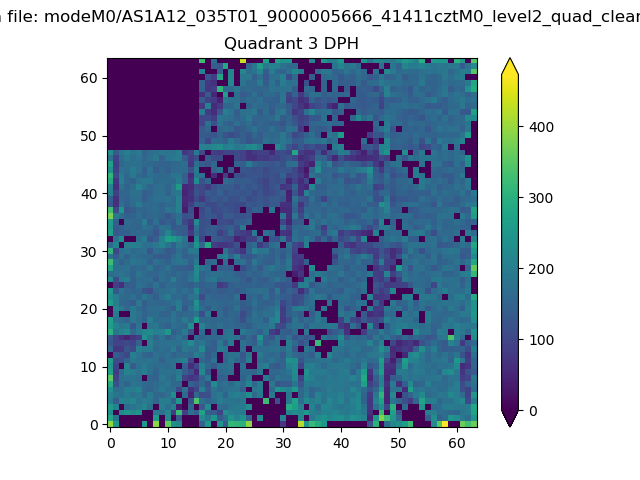 |
 |
Quadrant C |
| Plot type | Count rate plots | Images |
|---|---|---|
| Comparison with Poisson distribution Blue bars denote a histogram of data divided into 1 sec bins. Red curve is a Poisson curve with rate = median count rate of data. |
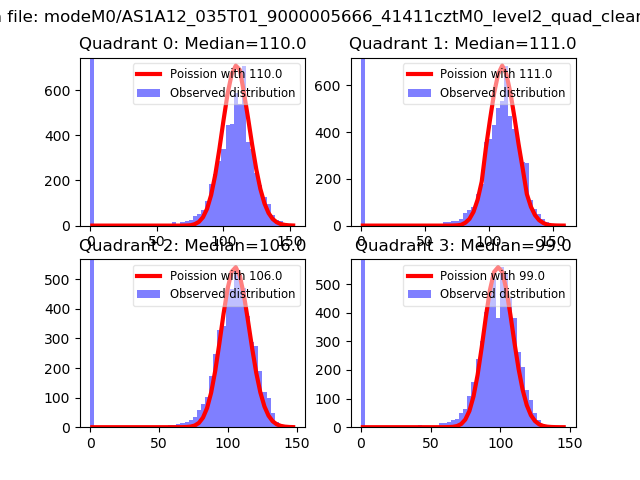 |
 |
| Quadrant-wise count rates Data is divided into 100 sec bins |
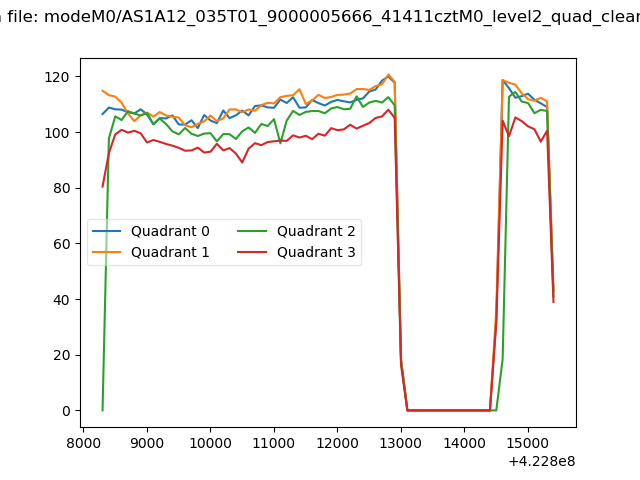 |
|
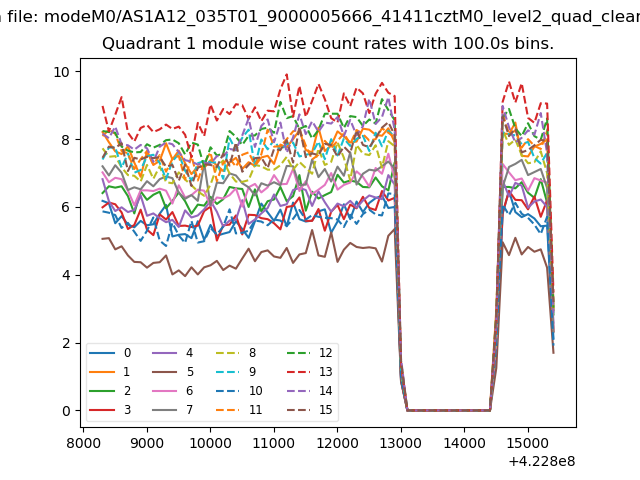
| Module-wise count rates for Quadrant A Data is divided into 100 sec bins |
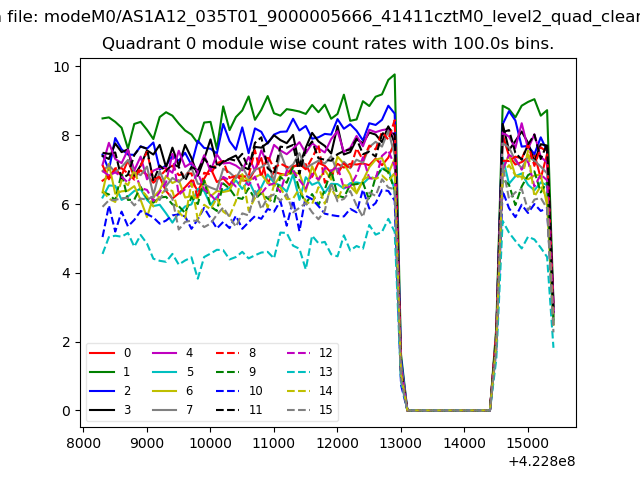 |
 |
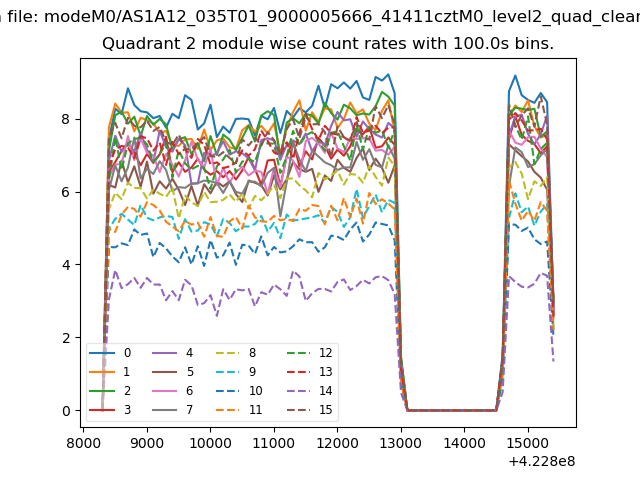
| Module-wise count rates for Quadrant B Data is divided into 100 sec bins |
 |
 |
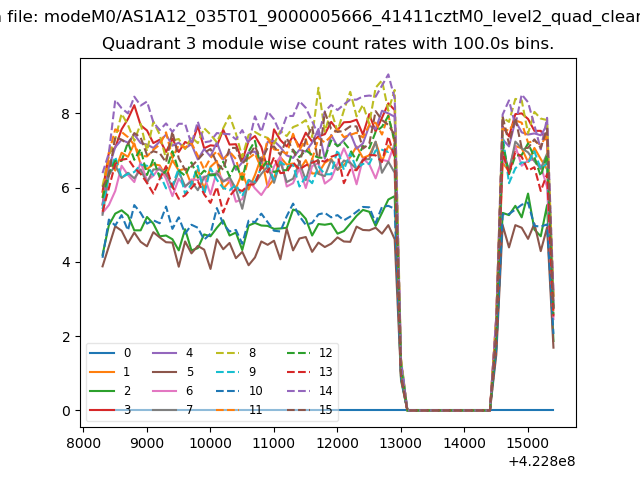
| Module-wise count rates for Quadrant C Data is divided into 100 sec bins |
 |
 |
| Module-wise count rates for Quadrant D Data is divided into 100 sec bins |
 |
 |
| Parameter | Plot |
|---|---|
| CZT HV Monitor | 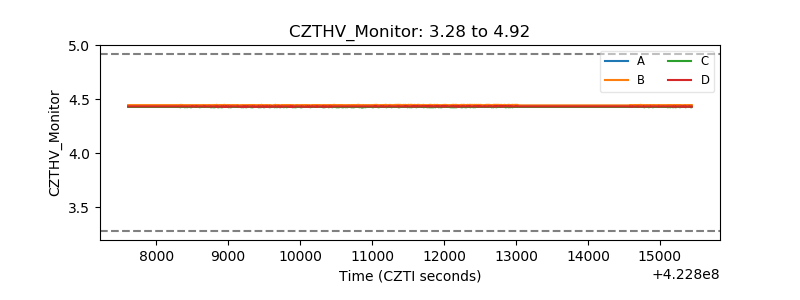 |
| D_VDD | 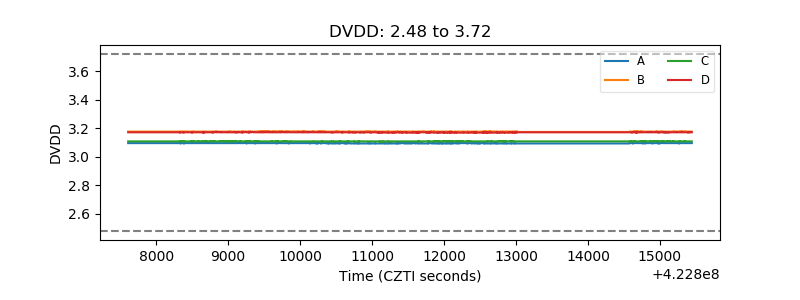 |
| Temperature 1 | 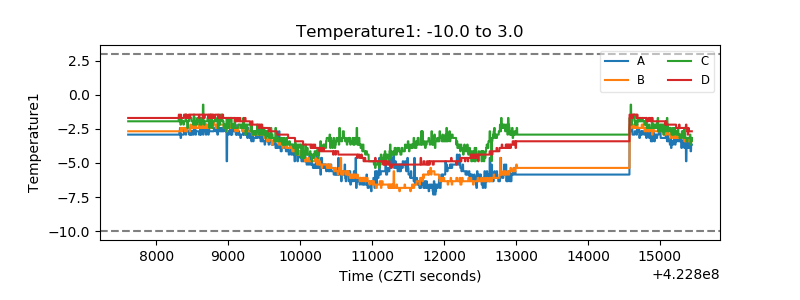 |
| Veto HV Monitor | 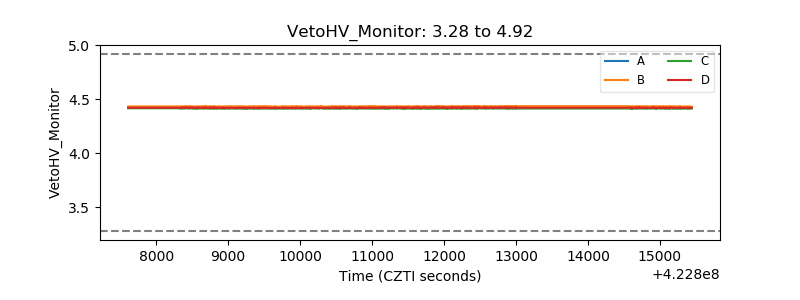 |
| Veto LLD | 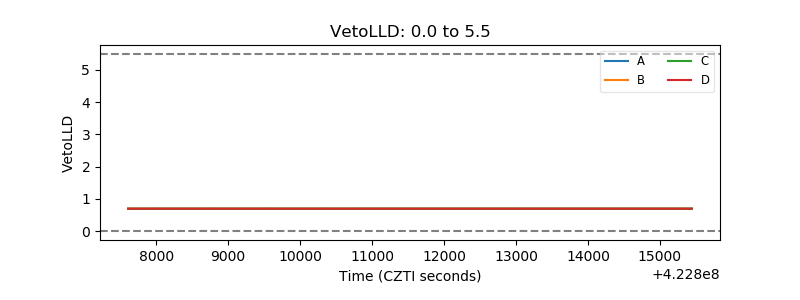 |
| Alpha Counter | 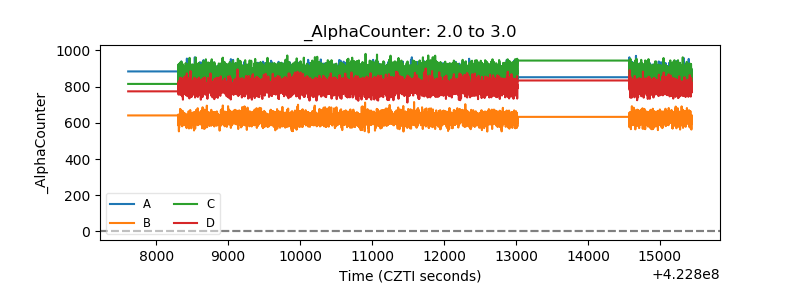 |
| _CPM_Rate | 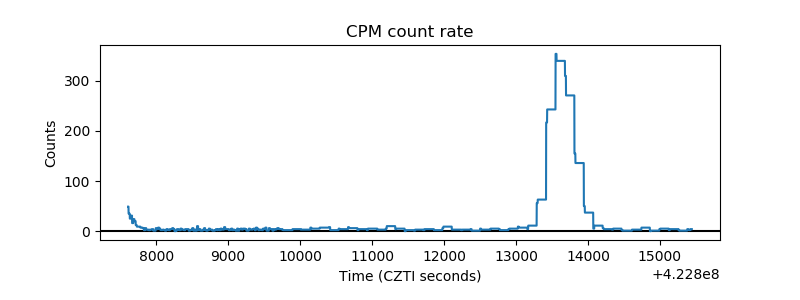 |
| CZT Counter | 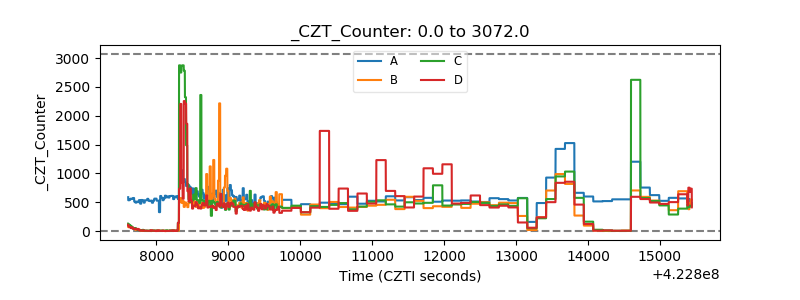 |
| +2.5 Volts monitor |  |
| +5 Volts monitor | 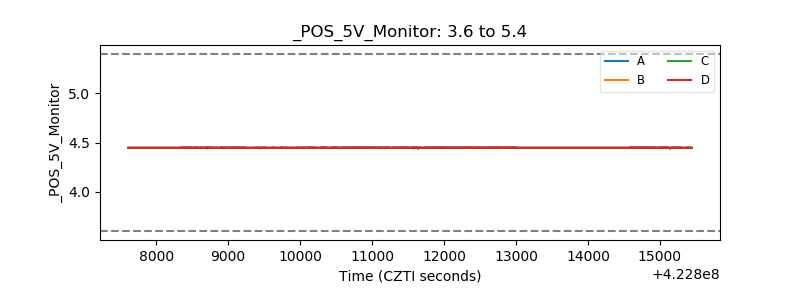 |
| _ROLL_ROT | 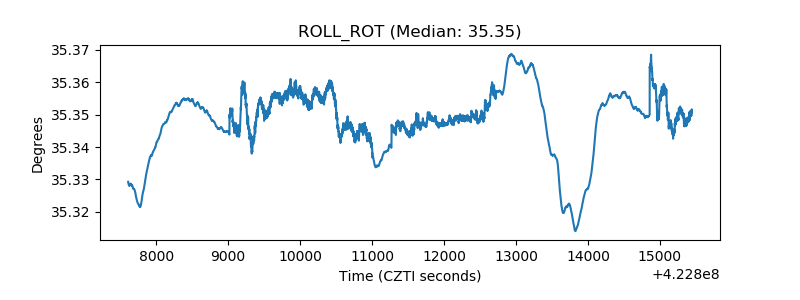 |
| _Roll_DEC | 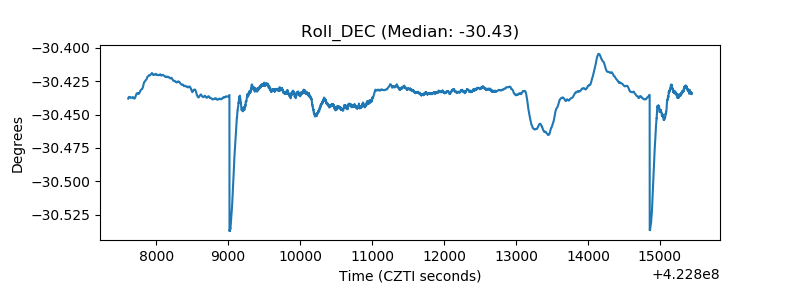 |
| _Roll_RA | 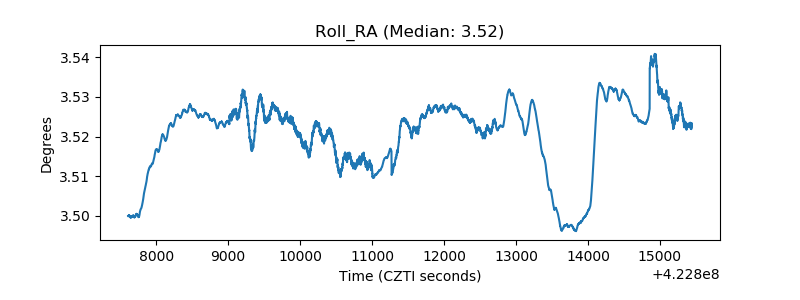 |
| Veto Counter | 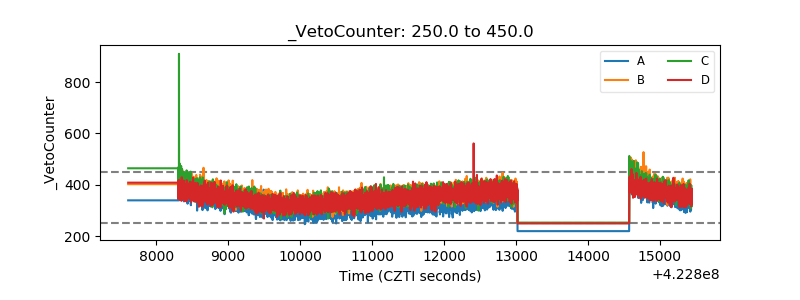 |