| Param | Original file | Final file |
|---|---|---|
| Filename | modeM0/AS1A12_044T22_9000005750_42118cztM0_level2.fits | modeM0/AS1A12_044T22_9000005750_42118cztM0_level2_quad_clean.evt |
| Size (bytes) | 132,140,160 | 36,172,800 |
| Size | 126.0 MB | 34.5 MB |
| Events in quadrant A | 1,124,282 | 244,942 |
| Events in quadrant B | 1,001,480 | 251,144 |
| Events in quadrant C | 1,059,754 | 235,721 |
| Events in quadrant D | 1,534,966 | 207,075 |
| Mode M0 | |||
|---|---|---|---|
| Quadrant | BADHDUFLAG | Total packets | Discarded packets |
| A | 0 | 4617 | 130 |
| B | 0 | 4471 | 85 |
| C | 0 | 4493 | 93 |
| D | 0 | 6485 | 443 |
| Mode M9 | |||
|---|---|---|---|
| Quadrant | BADHDUFLAG | Total packets | Discarded packets |
| A | 0 | 9 | 0 |
| B | 0 | 9 | 0 |
| C | 0 | 9 | 0 |
| D | 0 | 9 | 0 |
| Mode SS | |||
|---|---|---|---|
| Quadrant | BADHDUFLAG | Total packets | Discarded packets |
| A | 0 | 47 | 1 |
| B | 0 | 48 | 2 |
| C | 0 | 48 | 2 |
| D | 0 | 46 | 0 |
| Quadrant | Total seconds | Saturated seconds | Saturation percentage |
|---|---|---|---|
| A | 2163 | 2 | 0.092464% |
| B | 2168 | 2 | 0.092251% |
| C | 2165 | 1 | 0.046189% |
| D | 2157 | 145 | 6.722299% |
Noise dominated data is calculated using 1-second bins in cleaned event files. If a bin has >2000 counts, and if more than 50% of those come from <1% of pixels, then it is considered to be noise-dominated and hence unusable.
| Quadrant | # 1 sec bins | Bins with >0 counts | Bins with >2000 counts | High rate bins dominated by noise | Noise dominated (total time) | Noise dominated (detector-on time) | Marked lightcurve |
|---|---|---|---|---|---|---|---|
| A | 2184 | 2172 | 0 | 0 | 0.00% | 0.00% | 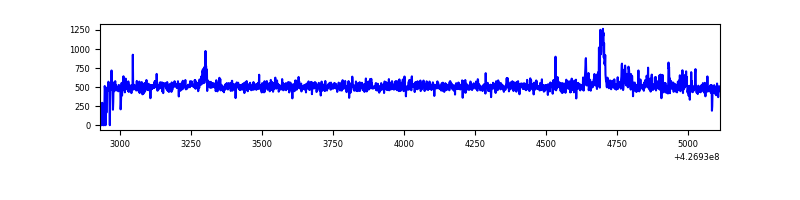 |
| B | 2184 | 2171 | 0 | 0 | 0.00% | 0.00% | 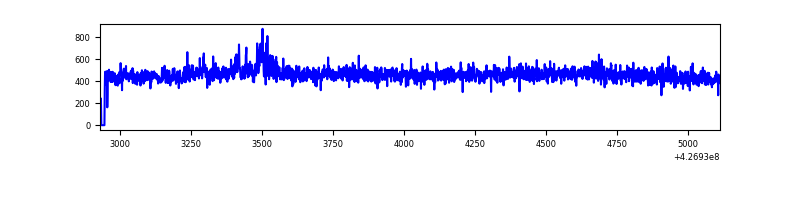 |
| C | 2183 | 2174 | 0 | 0 | 0.00% | 0.00% |  |
| D | 2168 | 2162 | 129 | 129 | 5.95% | 5.97% | 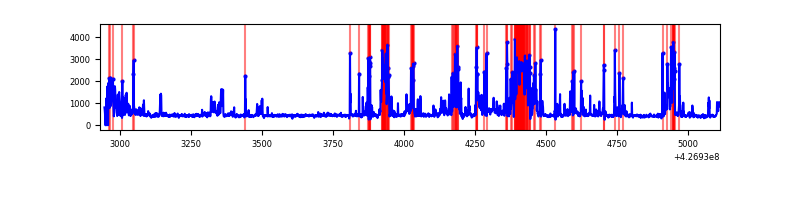 |
Top three noisy pixels from each quadrant. If the there are fewer than three noisy pixels in the level2.evt file, extra rows are filled as -1
| Pixel properties | Quadrant properties | ||||||
|---|---|---|---|---|---|---|---|
| Quadrant | DetID | PixID | Counts | Sigma | Mean | Median | Sigma |
| A | 10 | 83 | 135722 | 2552.66 | 246 | 242 | 53.1 |
| A | 15 | 222 | 35068 | 656.18 | 246 | 242 | 53.1 |
| A | 3 | 137 | 2875 | 49.61 | 246 | 242 | 53.1 |
| B | 4 | 81 | 12667 | 243.51 | 249 | 242 | 51.0 |
| B | 0 | 229 | 9025 | 172.13 | 249 | 242 | 51.0 |
| B | 12 | 111 | 6315 | 119.02 | 249 | 242 | 51.0 |
| C | 15 | 214 | 84720 | 1423.65 | 246 | 247 | 59.3 |
| C | 8 | 79 | 14714 | 243.82 | 246 | 247 | 59.3 |
| C | 13 | 61 | 1655 | 23.73 | 246 | 247 | 59.3 |
| D | 12 | 6 | 289608 | 4947.7 | 233 | 226 | 58.5 |
| D | 13 | 249 | 249422 | 4260.62 | 233 | 226 | 58.5 |
| D | 12 | 233 | 65070 | 1108.67 | 233 | 226 | 58.5 |
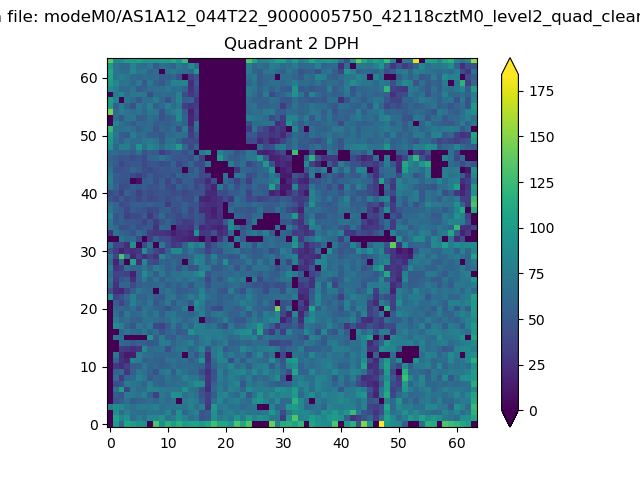
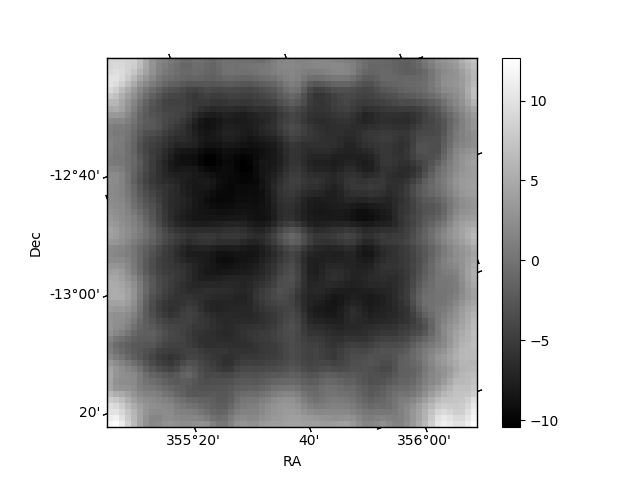
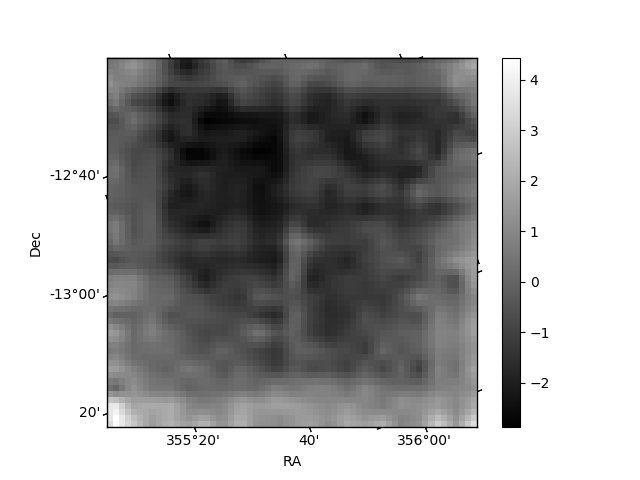
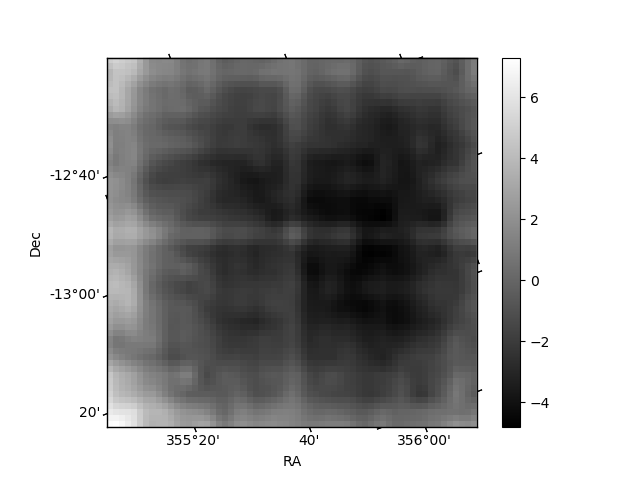
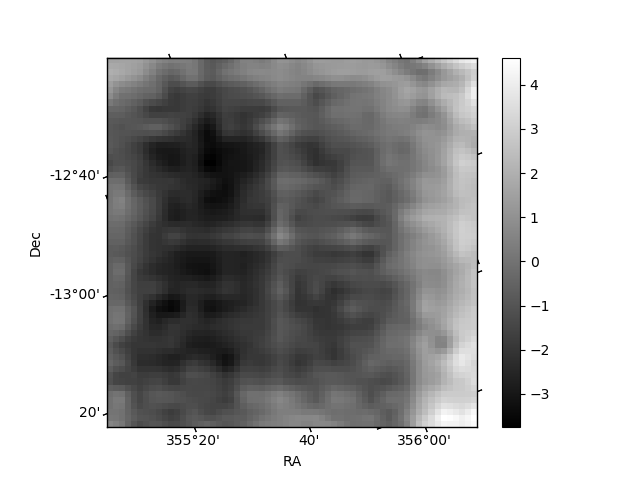
Histogram calculated using DETX and DETY for each event in the final _common_clean file
| Quadrant A | 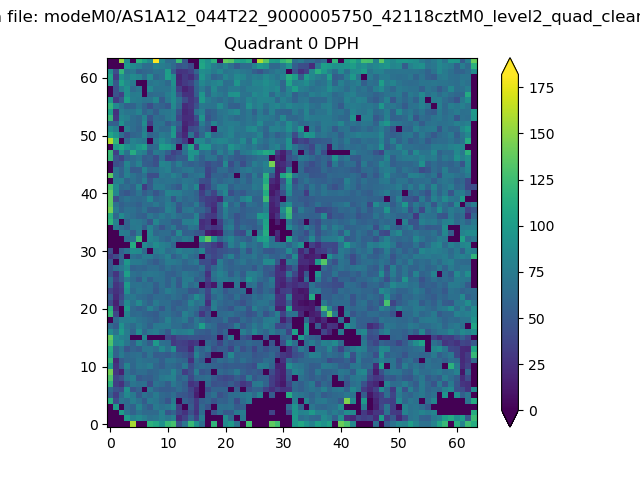 |
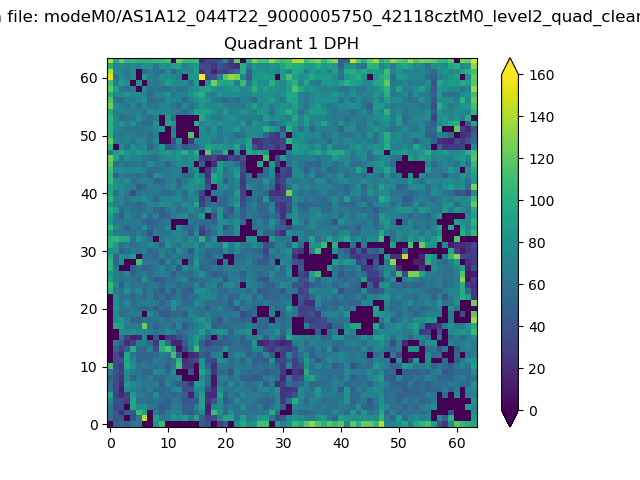 |
Quadrant B |
|---|---|---|---|
| Quadrant D | 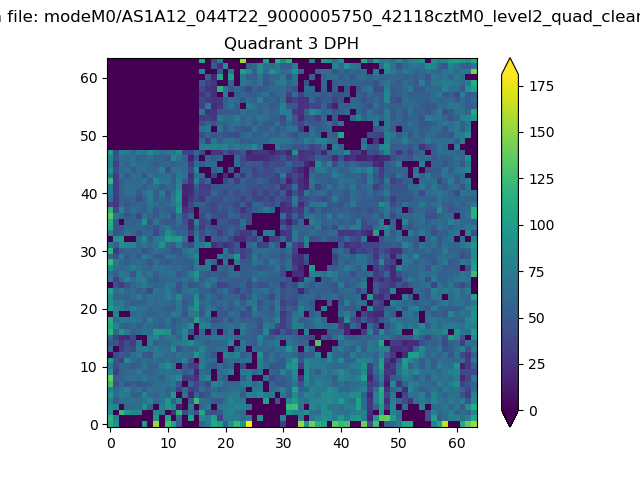 |
 |
Quadrant C |
| Plot type | Count rate plots | Images |
|---|---|---|
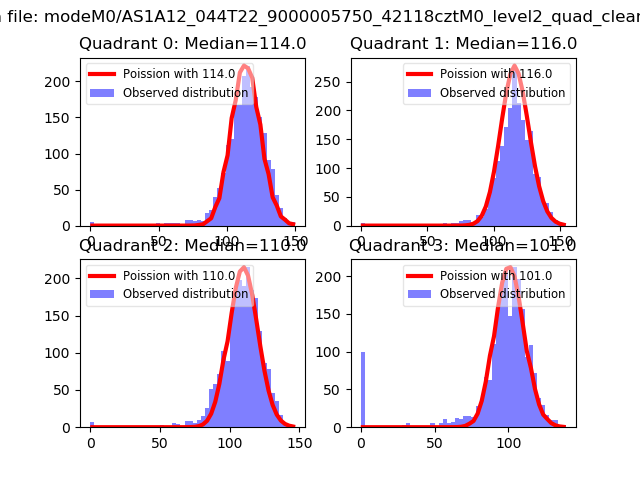
| Comparison with Poisson distribution Blue bars denote a histogram of data divided into 1 sec bins. Red curve is a Poisson curve with rate = median count rate of data. |
 |
 |
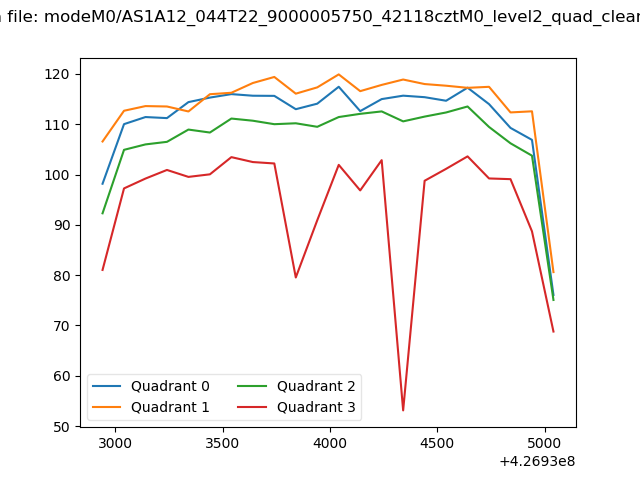
| Quadrant-wise count rates Data is divided into 100 sec bins |
 |
|
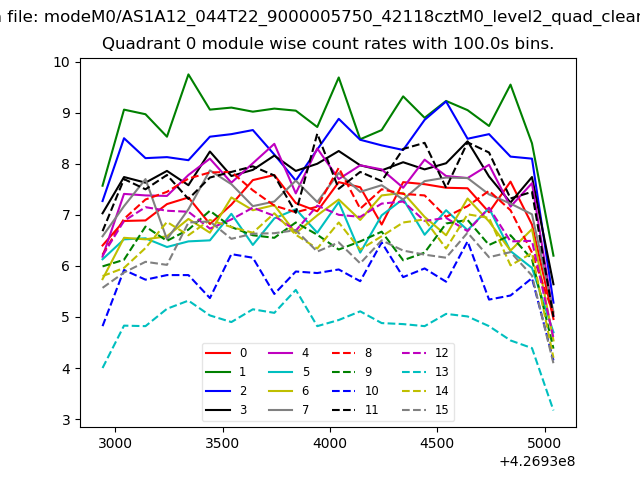
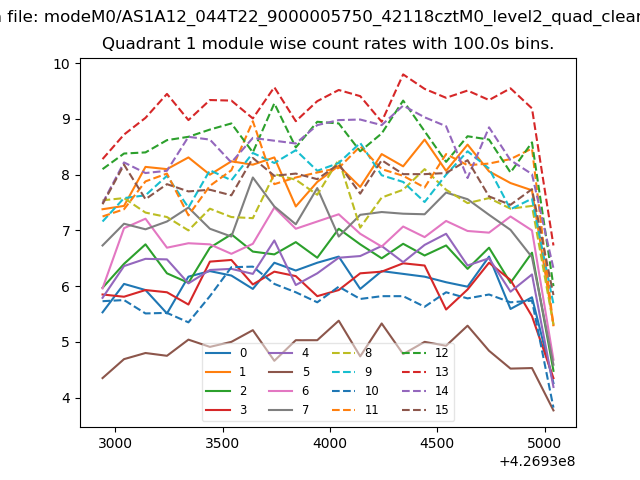
| Module-wise count rates for Quadrant A Data is divided into 100 sec bins |
 |
 |
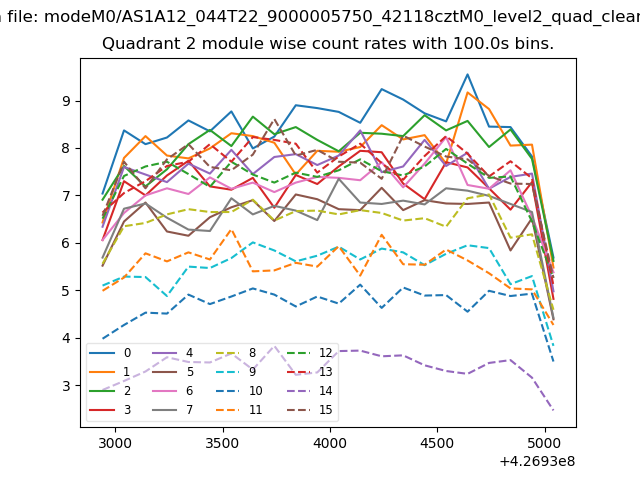
| Module-wise count rates for Quadrant B Data is divided into 100 sec bins |
 |
 |
| Module-wise count rates for Quadrant C Data is divided into 100 sec bins |
 |
 |
| Module-wise count rates for Quadrant D Data is divided into 100 sec bins |
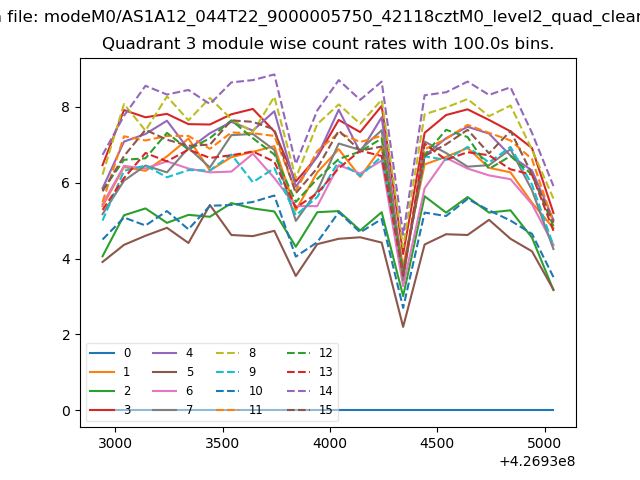 |
 |
| Parameter | Plot |
|---|---|
| CZT HV Monitor | 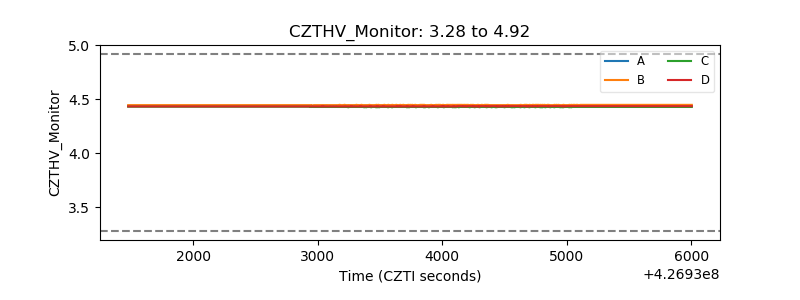 |
| D_VDD | 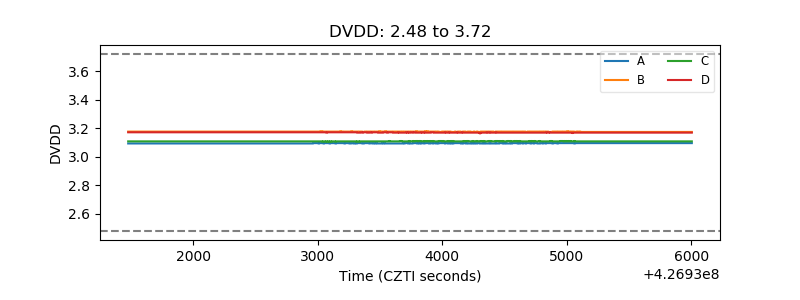 |
| Temperature 1 | 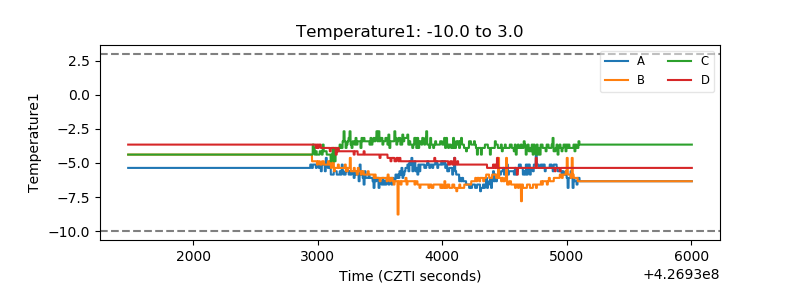 |
| Veto HV Monitor | 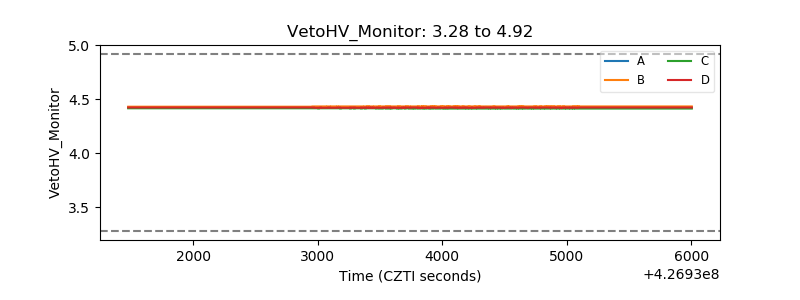 |
| Veto LLD | 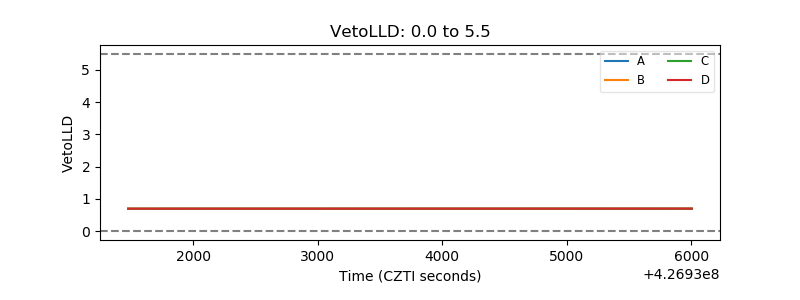 |
| Alpha Counter | 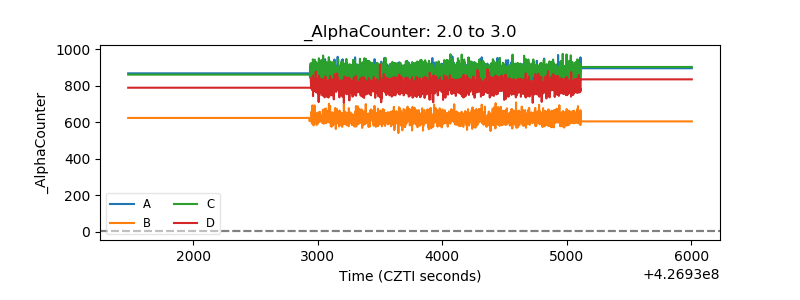 |
| _CPM_Rate |  |
| CZT Counter | 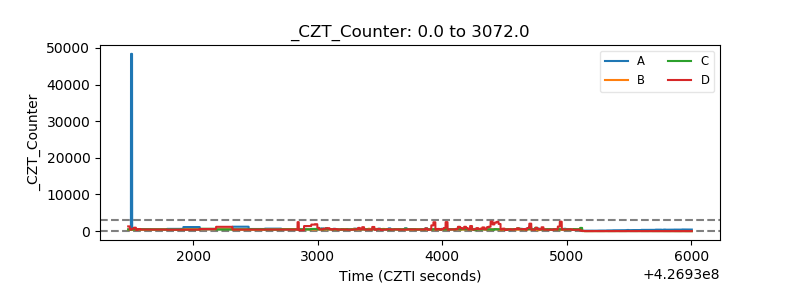 |
| +2.5 Volts monitor | 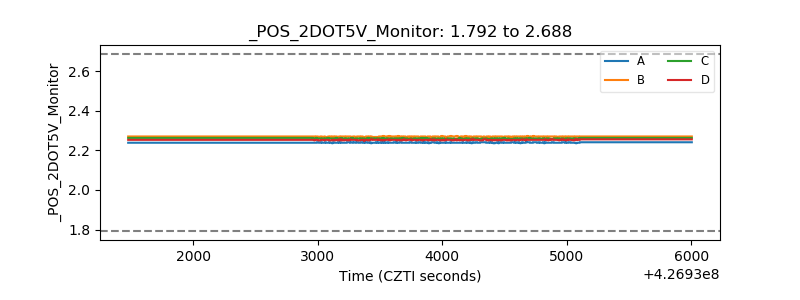 |
| +5 Volts monitor | 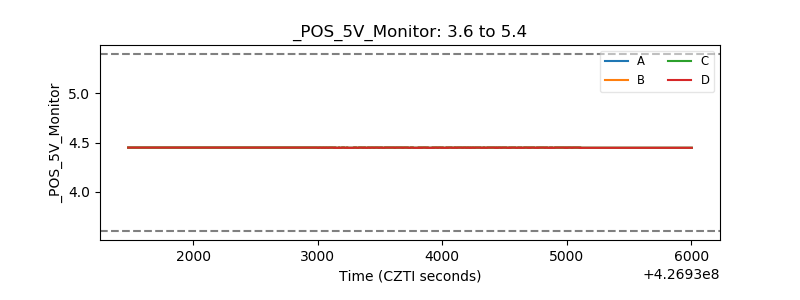 |
| _ROLL_ROT | 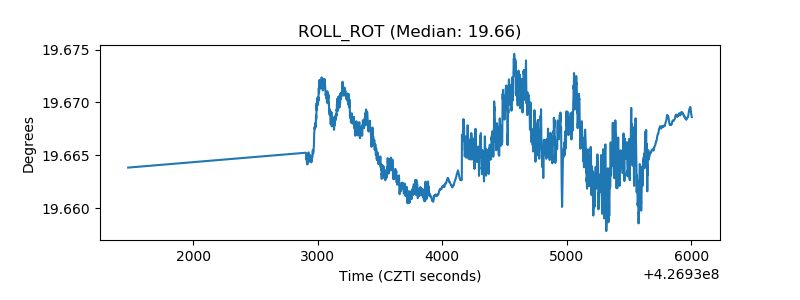 |
| _Roll_DEC | 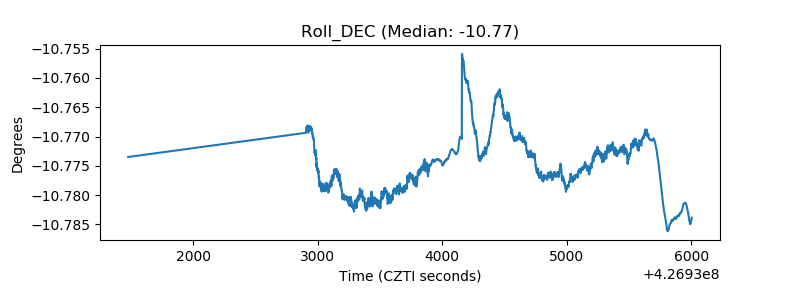 |
| _Roll_RA | 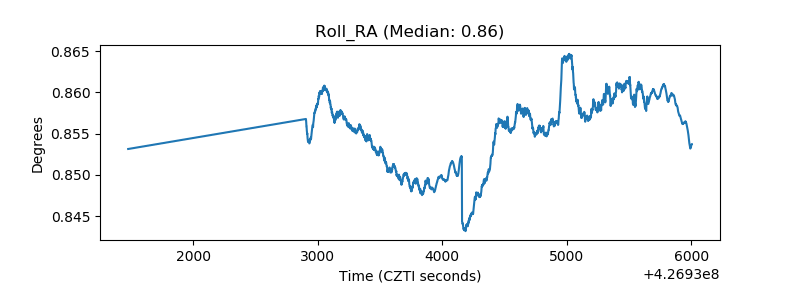 |
| Veto Counter | 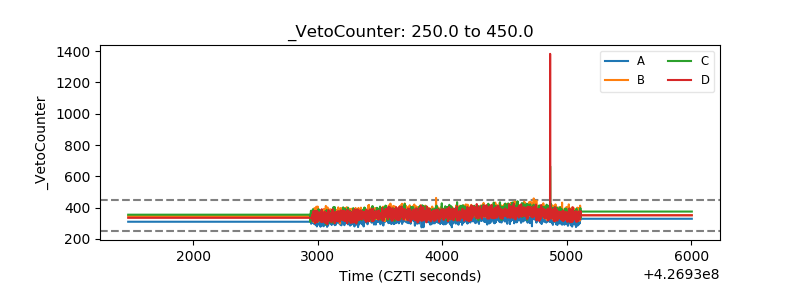 |