| Param | Original file | Final file |
|---|---|---|
| Filename | modeM0/AS1C06_010T01_9000005800_42378cztM0_level2.fits | modeM0/AS1C06_010T01_9000005800_42378cztM0_level2_quad_clean.evt |
| Size (bytes) | 339,903,360 | 92,828,160 |
| Size | 324.2 MB | 88.5 MB |
| Events in quadrant A | 3,012,834 | 618,599 |
| Events in quadrant B | 2,842,298 | 622,049 |
| Events in quadrant C | 2,966,613 | 607,050 |
| Events in quadrant D | 3,312,532 | 561,273 |
| Mode M9 | |||
|---|---|---|---|
| Quadrant | BADHDUFLAG | Total packets | Discarded packets |
| A | 0 | 25 | 0 |
| B | 0 | 26 | 0 |
| C | 0 | 26 | 0 |
| D | 0 | 26 | 0 |
| Mode M0 | |||
|---|---|---|---|
| Quadrant | BADHDUFLAG | Total packets | Discarded packets |
| A | 0 | 12684 | 2 |
| B | 0 | 12755 | 2 |
| C | 0 | 12759 | 2 |
| D | 0 | 14020 | 2 |
| Mode SS | |||
|---|---|---|---|
| Quadrant | BADHDUFLAG | Total packets | Discarded packets |
| A | 0 | 116 | 0 |
| B | 0 | 116 | 0 |
| C | 0 | 116 | 0 |
| D | 0 | 116 | 0 |
| Quadrant | Total seconds | Saturated seconds | Saturation percentage |
|---|---|---|---|
| A | 5748 | 17 | 0.295755% |
| B | 5748 | 62 | 1.078636% |
| C | 5748 | 93 | 1.617954% |
| D | 5748 | 161 | 2.800974% |
Noise dominated data is calculated using 1-second bins in cleaned event files. If a bin has >2000 counts, and if more than 50% of those come from <1% of pixels, then it is considered to be noise-dominated and hence unusable.
| Quadrant | # 1 sec bins | Bins with >0 counts | Bins with >2000 counts | High rate bins dominated by noise | Noise dominated (total time) | Noise dominated (detector-on time) | Marked lightcurve |
|---|---|---|---|---|---|---|---|
| A | 7060 | 5749 | 8 | 8 | 0.11% | 0.14% | 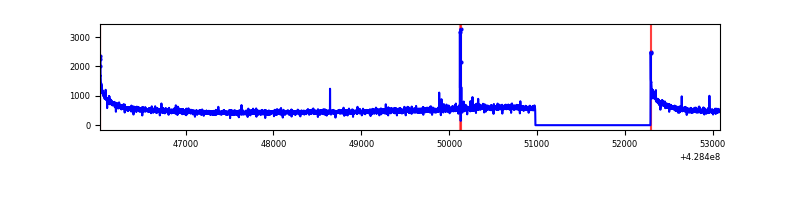 |
| B | 7060 | 5749 | 36 | 36 | 0.51% | 0.63% | 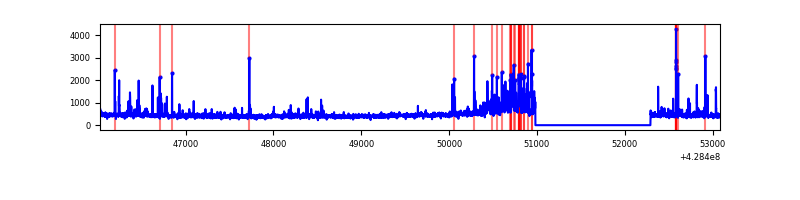 |
| C | 7060 | 5749 | 53 | 53 | 0.75% | 0.92% | 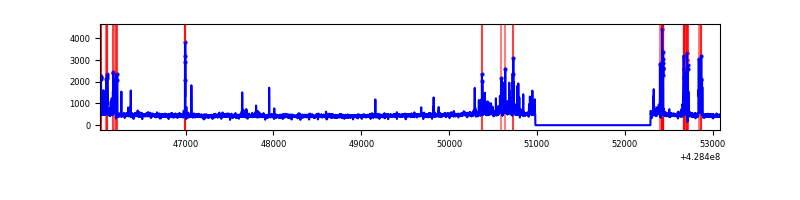 |
| D | 7060 | 5748 | 113 | 113 | 1.60% | 1.97% | 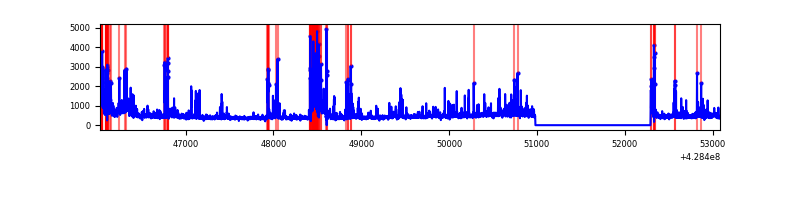 |
Top three noisy pixels from each quadrant. If the there are fewer than three noisy pixels in the level2.evt file, extra rows are filled as -1
| Pixel properties | Quadrant properties | ||||||
|---|---|---|---|---|---|---|---|
| Quadrant | DetID | PixID | Counts | Sigma | Mean | Median | Sigma |
| A | 10 | 83 | 618093 | 4922.65 | 608 | 594 | 125.4 |
| A | 13 | 248 | 25270 | 196.72 | 608 | 594 | 125.4 |
| A | 13 | 6 | 13004 | 98.93 | 608 | 594 | 125.4 |
| B | 4 | 81 | 148514 | 1284.84 | 601 | 583 | 115.1 |
| B | 5 | 172 | 80001 | 689.78 | 601 | 583 | 115.1 |
| B | 5 | 255 | 58295 | 501.25 | 601 | 583 | 115.1 |
| C | 14 | 254 | 357538 | 2591.23 | 591 | 593 | 137.8 |
| C | 15 | 214 | 238720 | 1728.67 | 591 | 593 | 137.8 |
| C | 3 | 233 | 25100 | 177.91 | 591 | 593 | 137.8 |
| D | 12 | 6 | 271470 | 1870.79 | 590 | 573 | 144.8 |
| D | 12 | 233 | 123339 | 847.81 | 590 | 573 | 144.8 |
| D | 1 | 52 | 106788 | 733.51 | 590 | 573 | 144.8 |
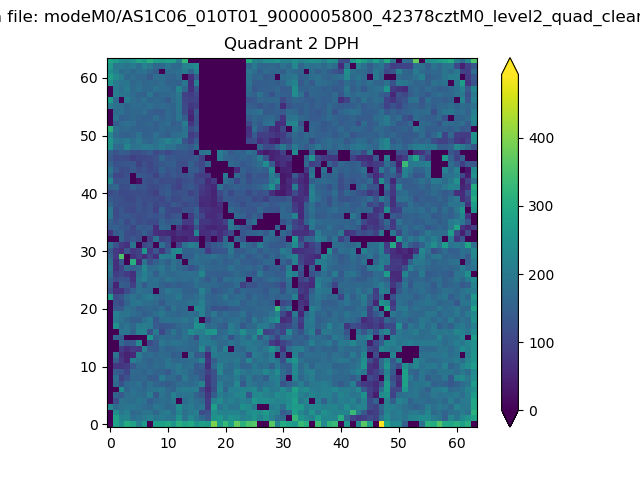
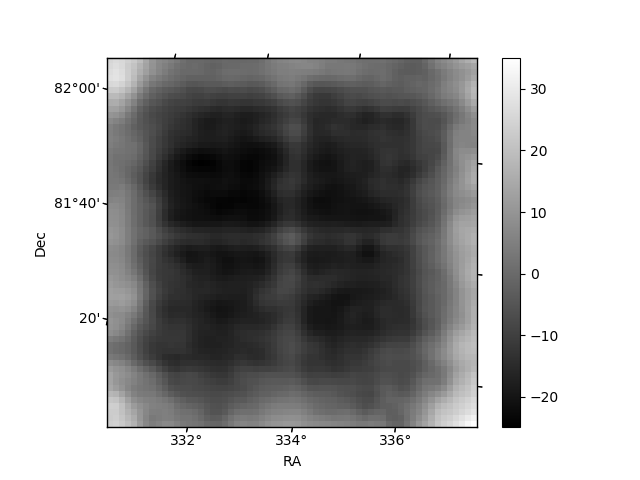
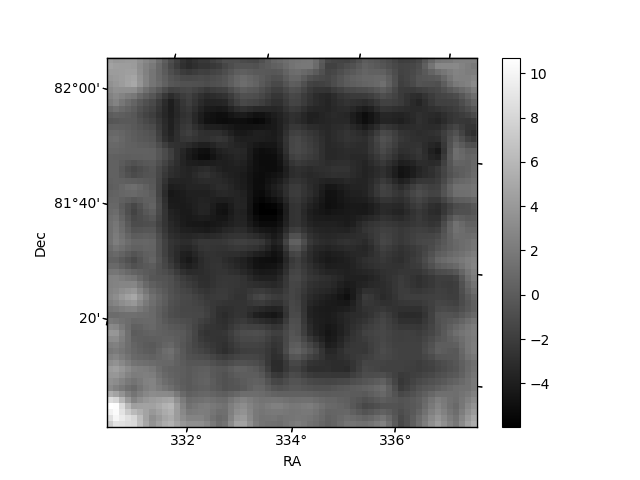
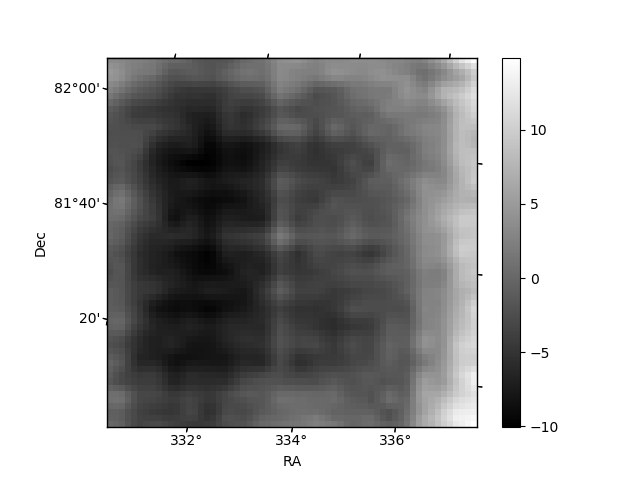
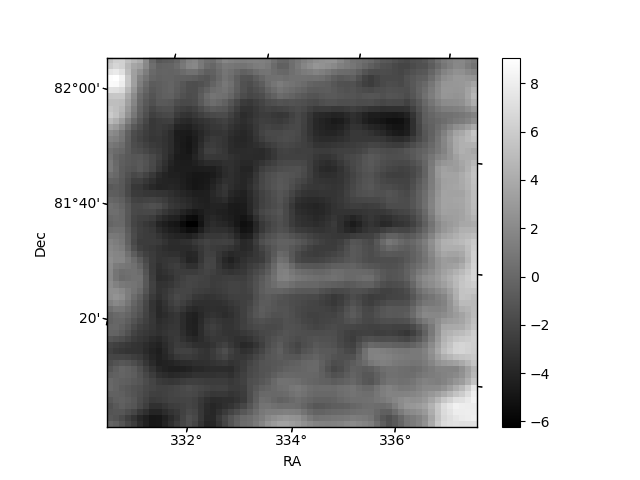
Histogram calculated using DETX and DETY for each event in the final _common_clean file
| Quadrant A | 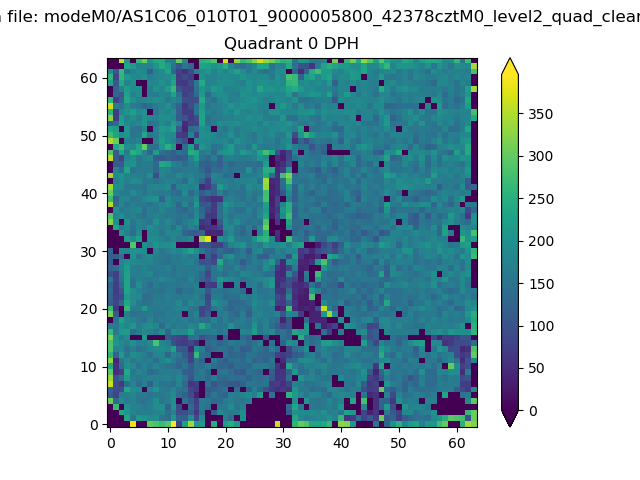 |
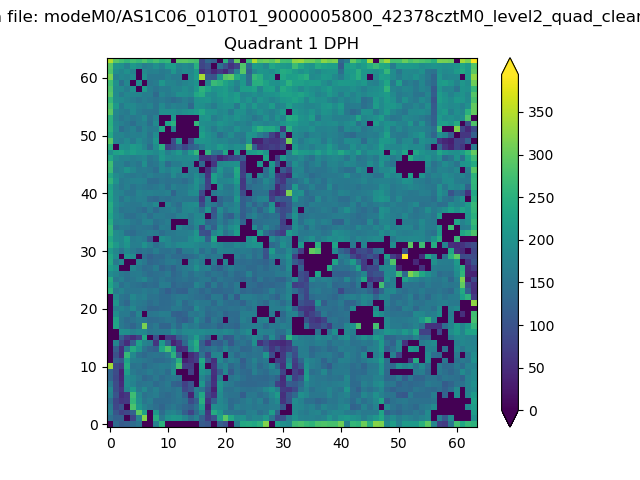 |
Quadrant B |
|---|---|---|---|
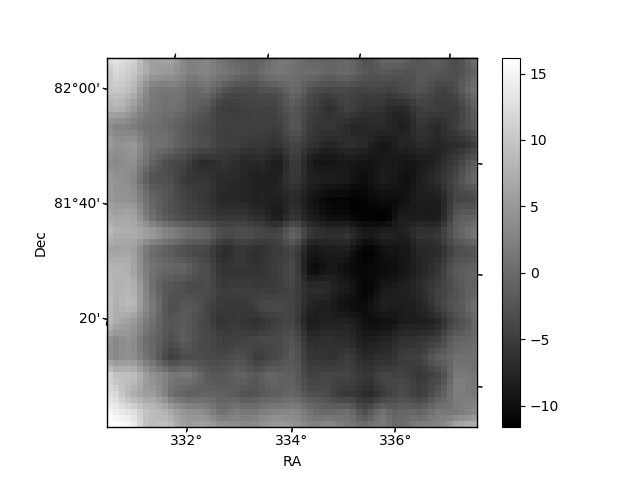
| Quadrant D | 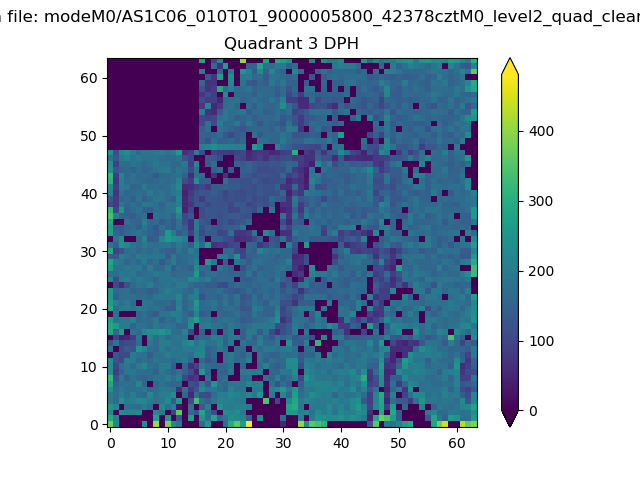 |
 |
Quadrant C |
| Plot type | Count rate plots | Images |
|---|---|---|
| Comparison with Poisson distribution Blue bars denote a histogram of data divided into 1 sec bins. Red curve is a Poisson curve with rate = median count rate of data. |
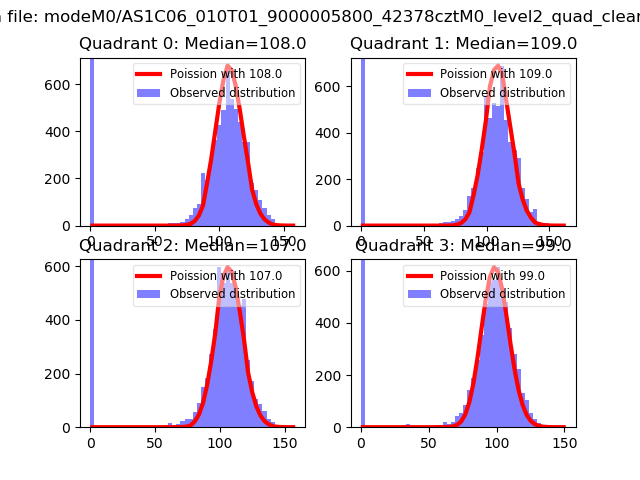 |
 |
| Quadrant-wise count rates Data is divided into 100 sec bins |
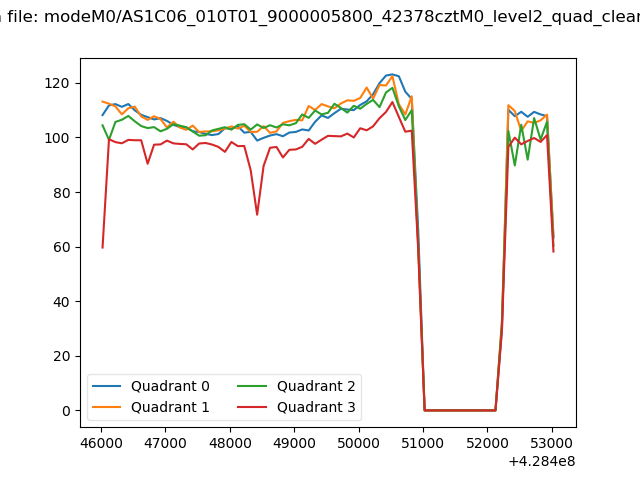 |
|
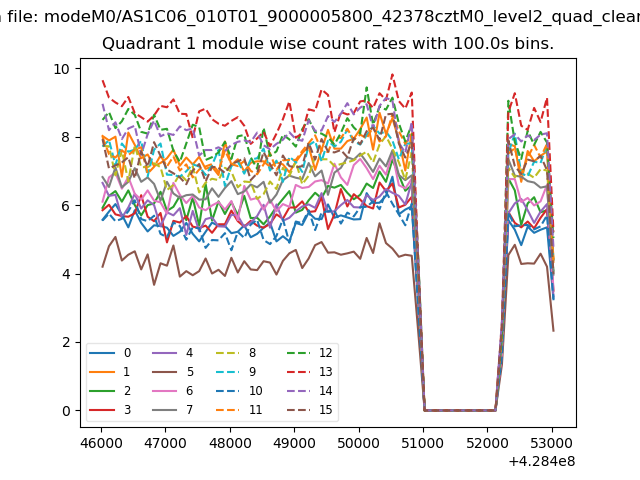
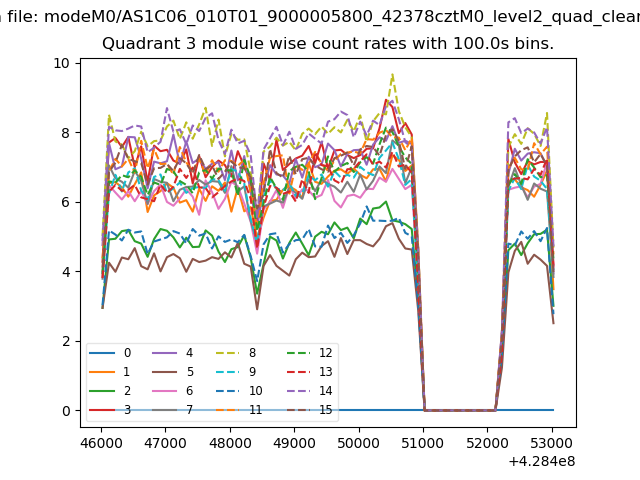
| Module-wise count rates for Quadrant A Data is divided into 100 sec bins |
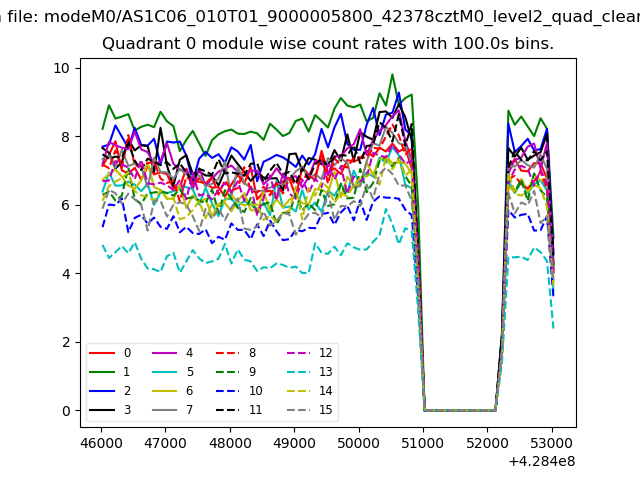 |
 |
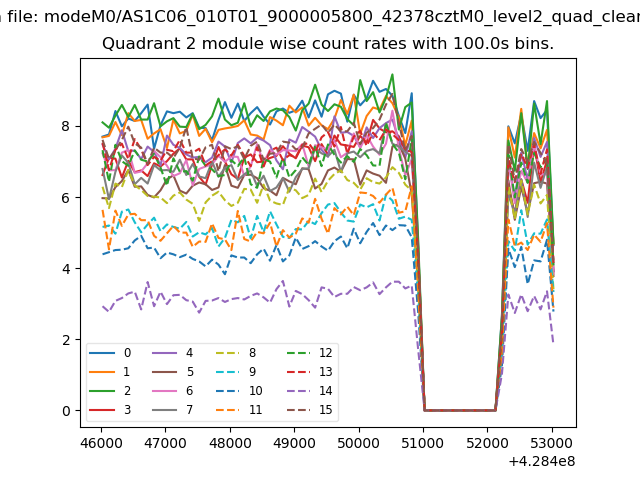
| Module-wise count rates for Quadrant B Data is divided into 100 sec bins |
 |
 |
| Module-wise count rates for Quadrant C Data is divided into 100 sec bins |
 |
 |
| Module-wise count rates for Quadrant D Data is divided into 100 sec bins |
 |
 |
| Parameter | Plot |
|---|---|
| CZT HV Monitor |  |
| D_VDD | 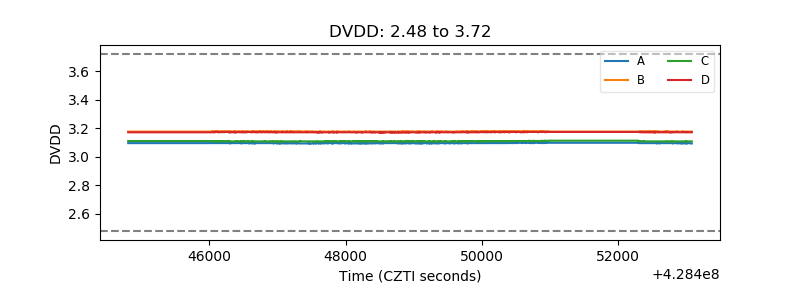 |
| Temperature 1 | 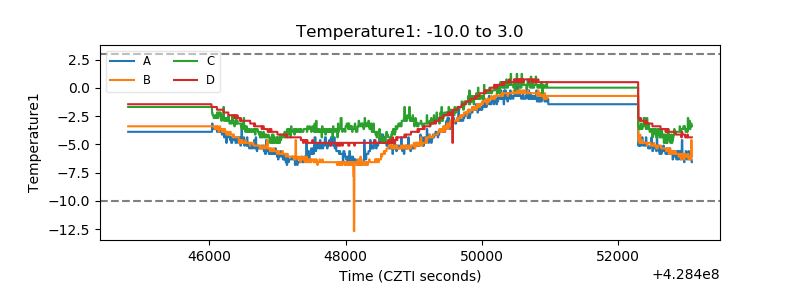 |
| Veto HV Monitor | 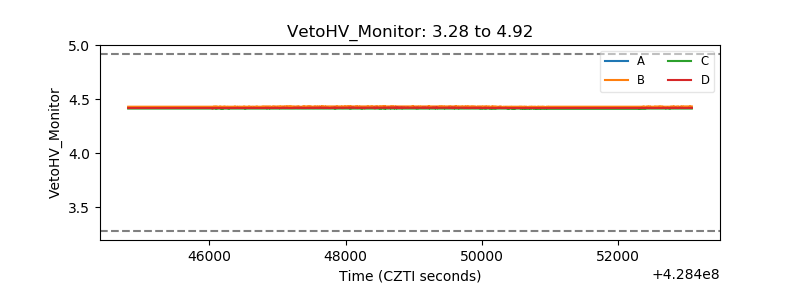 |
| Veto LLD | 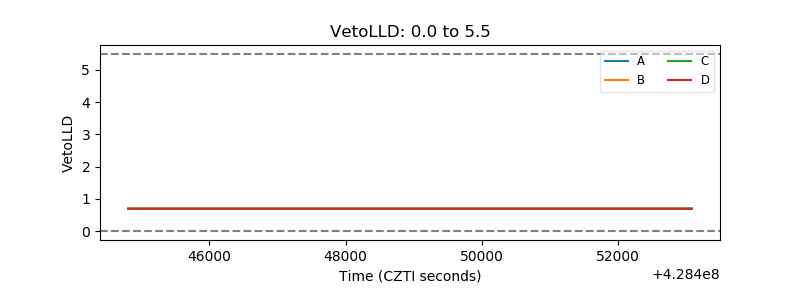 |
| Alpha Counter | 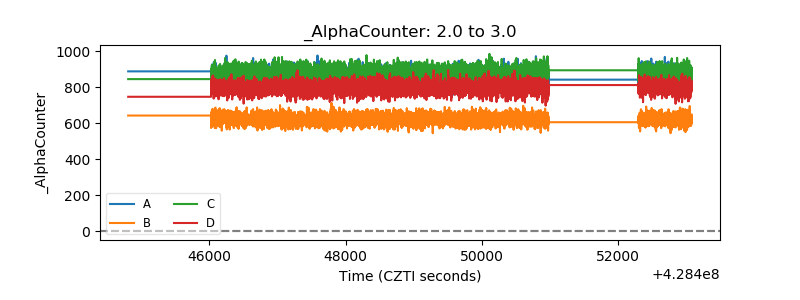 |
| _CPM_Rate | 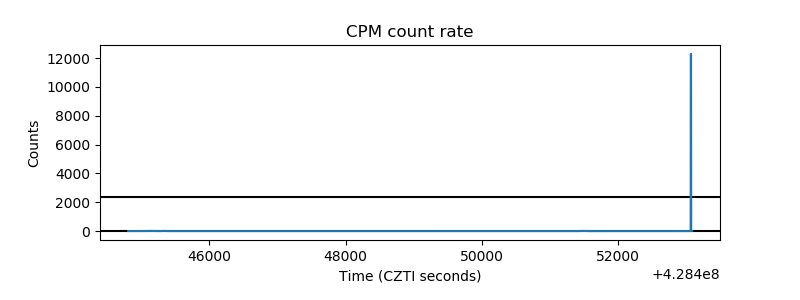 |
| CZT Counter | 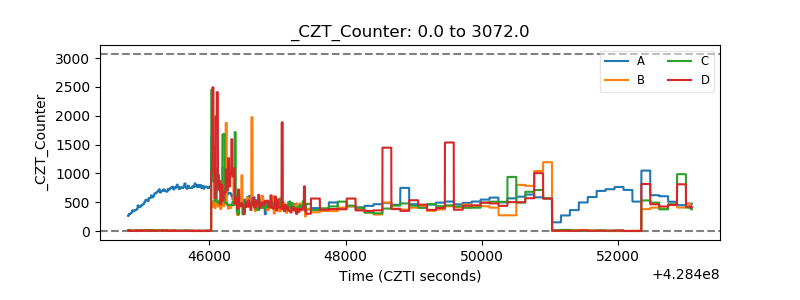 |
| +2.5 Volts monitor | 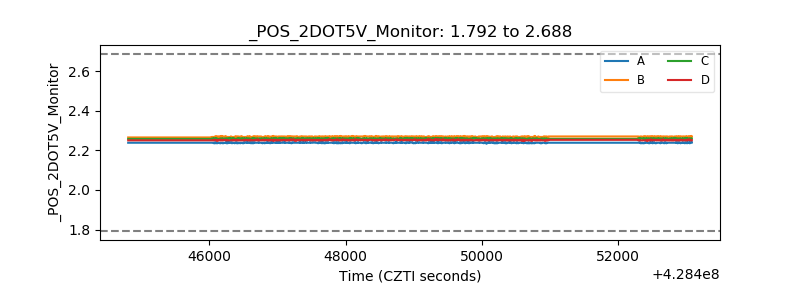 |
| +5 Volts monitor | 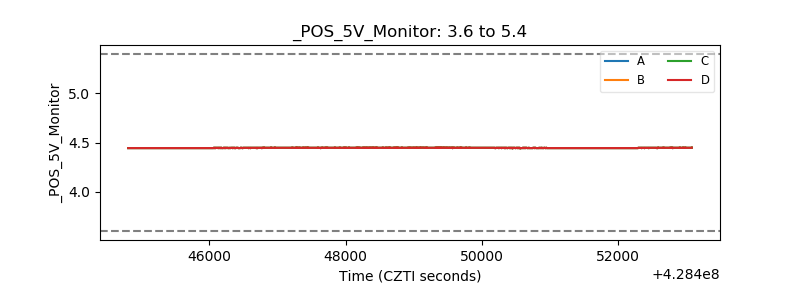 |
| _ROLL_ROT | 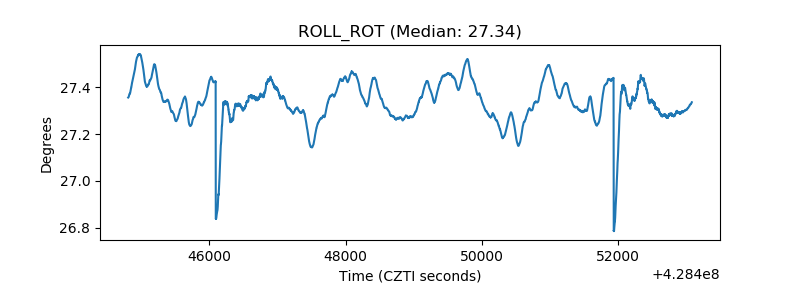 |
| _Roll_DEC | 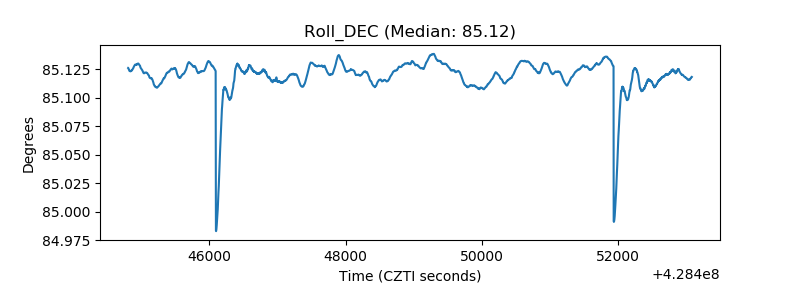 |
| _Roll_RA | 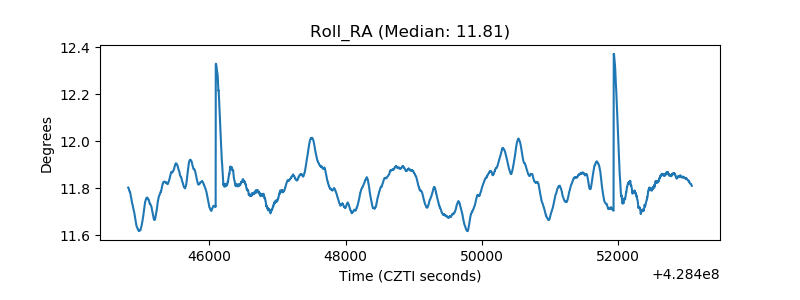 |
| Veto Counter | 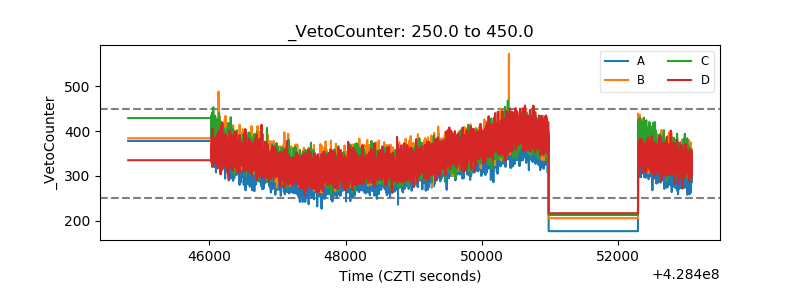 |