| Param | Original file | Final file |
|---|---|---|
| Filename | modeM0/AS1C07_001T10_9000005806_42428cztM0_level2.fits | modeM0/AS1C07_001T10_9000005806_42428cztM0_level2_quad_clean.evt |
| Size (bytes) | 315,685,440 | 88,015,680 |
| Size | 301.1 MB | 83.9 MB |
| Events in quadrant A | 2,864,895 | 588,638 |
| Events in quadrant B | 2,463,532 | 600,126 |
| Events in quadrant C | 2,429,360 | 578,381 |
| Events in quadrant D | 3,513,184 | 525,667 |
| Mode M9 | |||
|---|---|---|---|
| Quadrant | BADHDUFLAG | Total packets | Discarded packets |
| A | 0 | 27 | 0 |
| B | 0 | 28 | 0 |
| C | 0 | 28 | 0 |
| D | 0 | 28 | 0 |
| Mode SS | |||
|---|---|---|---|
| Quadrant | BADHDUFLAG | Total packets | Discarded packets |
| A | 0 | 108 | 0 |
| B | 0 | 108 | 0 |
| C | 0 | 108 | 0 |
| D | 0 | 108 | 0 |
| Mode M0 | |||
|---|---|---|---|
| Quadrant | BADHDUFLAG | Total packets | Discarded packets |
| A | 0 | 11641 | 2 |
| B | 0 | 11112 | 2 |
| C | 0 | 10715 | 2 |
| D | 0 | 14091 | 2 |
| Quadrant | Total seconds | Saturated seconds | Saturation percentage |
|---|---|---|---|
| A | 5319 | 16 | 0.300808% |
| B | 5319 | 32 | 0.601617% |
| C | 5319 | 7 | 0.131604% |
| D | 5319 | 167 | 3.139688% |
Noise dominated data is calculated using 1-second bins in cleaned event files. If a bin has >2000 counts, and if more than 50% of those come from <1% of pixels, then it is considered to be noise-dominated and hence unusable.
| Quadrant | # 1 sec bins | Bins with >0 counts | Bins with >2000 counts | High rate bins dominated by noise | Noise dominated (total time) | Noise dominated (detector-on time) | Marked lightcurve |
|---|---|---|---|---|---|---|---|
| A | 7113 | 5320 | 9 | 9 | 0.13% | 0.17% | 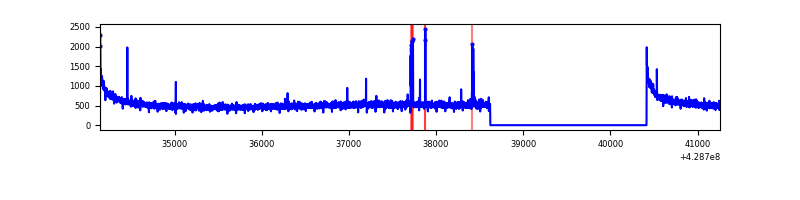 |
| B | 7113 | 5320 | 14 | 14 | 0.20% | 0.26% | 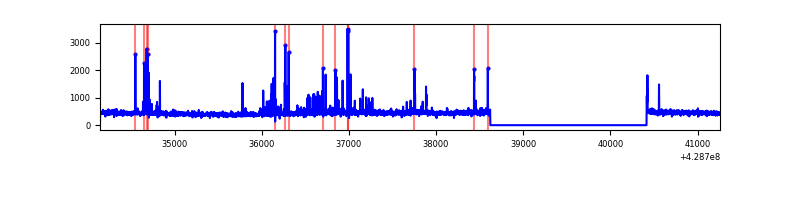 |
| C | 7113 | 5320 | 3 | 3 | 0.04% | 0.06% | 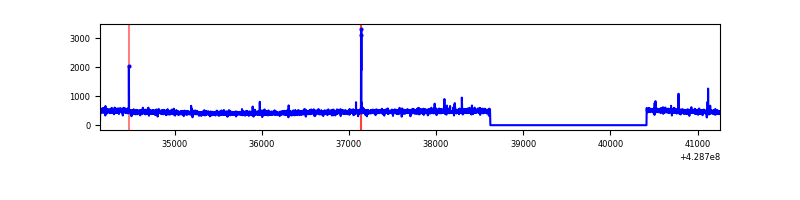 |
| D | 7113 | 5320 | 171 | 171 | 2.40% | 3.21% | 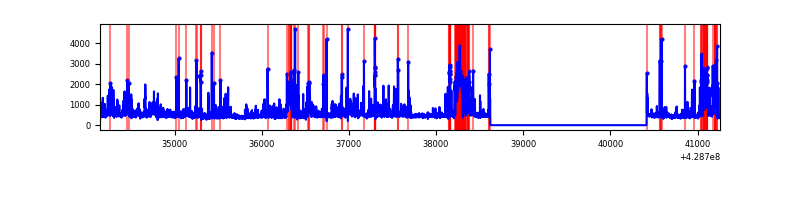 |
Top three noisy pixels from each quadrant. If the there are fewer than three noisy pixels in the level2.evt file, extra rows are filled as -1
| Pixel properties | Quadrant properties | ||||||
|---|---|---|---|---|---|---|---|
| Quadrant | DetID | PixID | Counts | Sigma | Mean | Median | Sigma |
| A | 10 | 83 | 563182 | 4705.54 | 579 | 566 | 119.6 |
| A | 15 | 223 | 37049 | 305.13 | 579 | 566 | 119.6 |
| A | 7 | 3 | 12725 | 101.69 | 579 | 566 | 119.6 |
| B | 5 | 172 | 76676 | 685.16 | 572 | 556 | 111.1 |
| B | 15 | 36 | 38135 | 338.25 | 572 | 556 | 111.1 |
| B | 3 | 112 | 30343 | 268.11 | 572 | 556 | 111.1 |
| C | 15 | 214 | 225387 | 1726.51 | 559 | 560 | 130.2 |
| C | 8 | 79 | 11130 | 81.17 | 559 | 560 | 130.2 |
| C | 15 | 111 | 7565 | 53.79 | 559 | 560 | 130.2 |
| D | 1 | 52 | 430210 | 3168.64 | 557 | 540 | 135.6 |
| D | 12 | 33 | 330690 | 2434.72 | 557 | 540 | 135.6 |
| D | 2 | 16 | 157806 | 1159.77 | 557 | 540 | 135.6 |
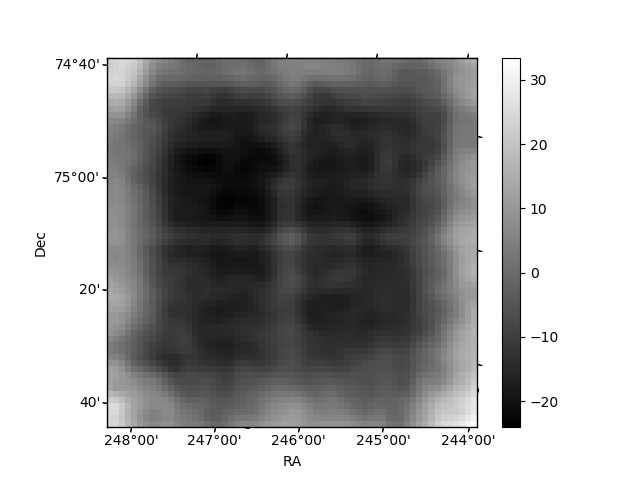
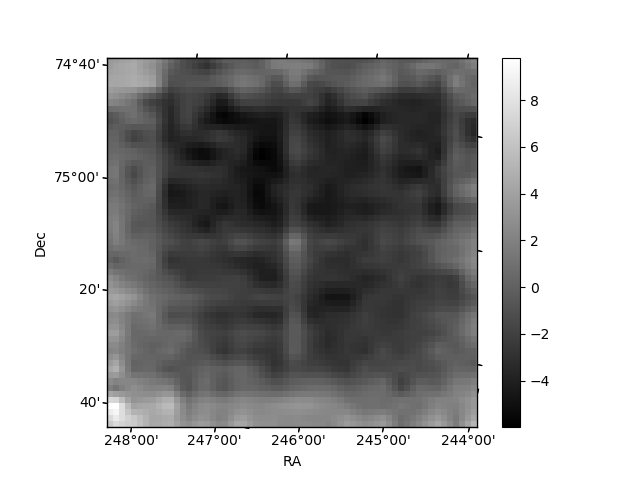
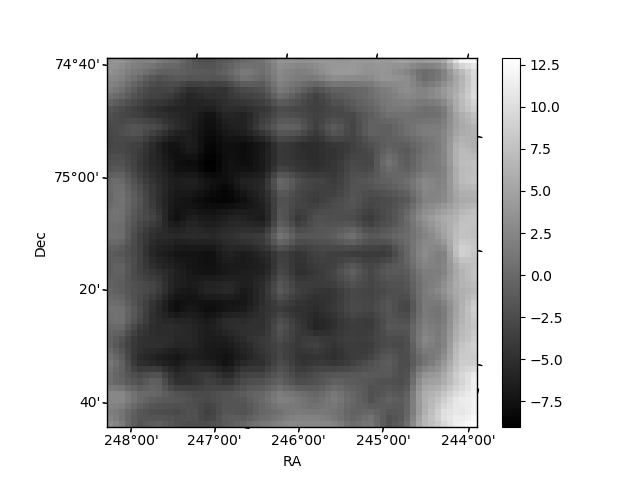
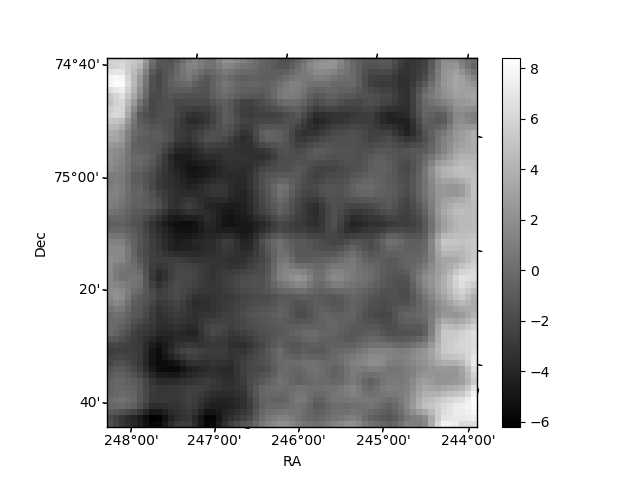
Histogram calculated using DETX and DETY for each event in the final _common_clean file
| Quadrant A | 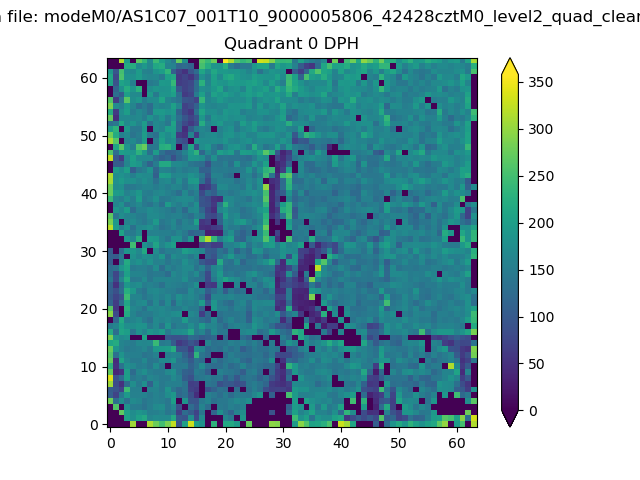 |
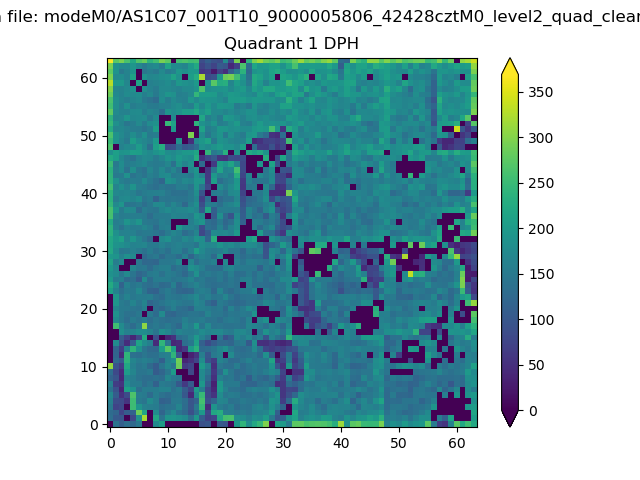 |
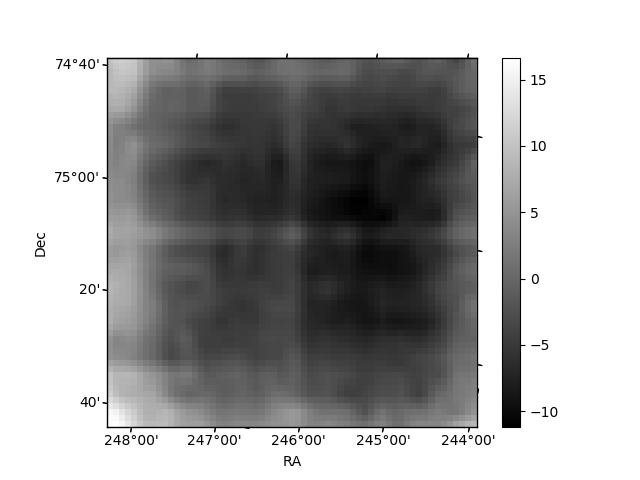
Quadrant B |
|---|---|---|---|
| Quadrant D | 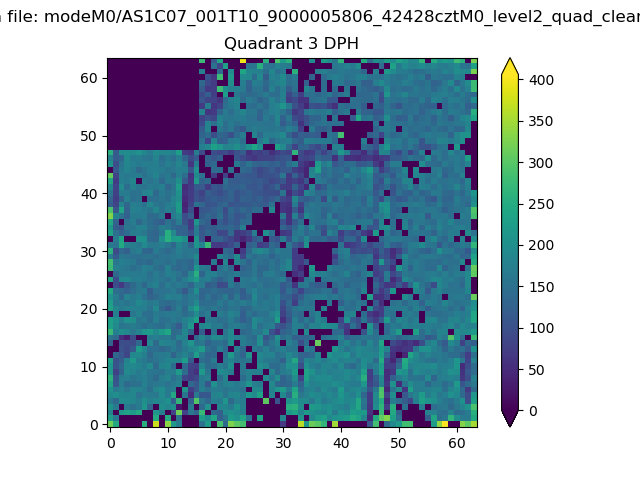 |
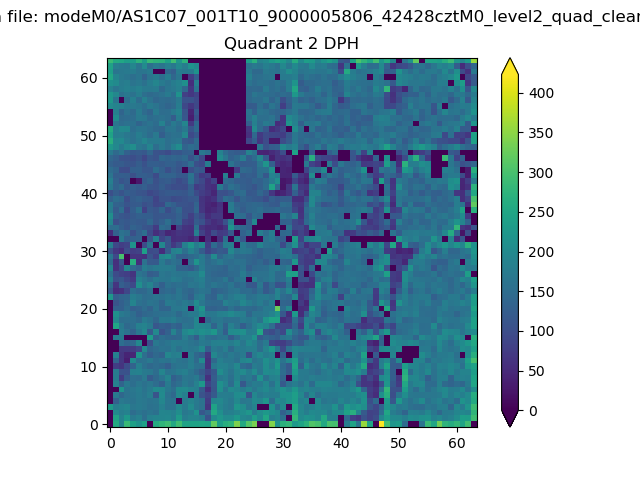 |
Quadrant C |
| Plot type | Count rate plots | Images |
|---|---|---|
| Comparison with Poisson distribution Blue bars denote a histogram of data divided into 1 sec bins. Red curve is a Poisson curve with rate = median count rate of data. |
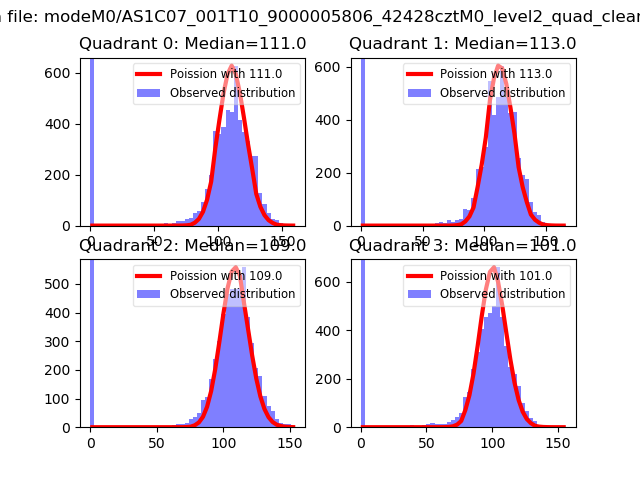 |
 |
| Quadrant-wise count rates Data is divided into 100 sec bins |
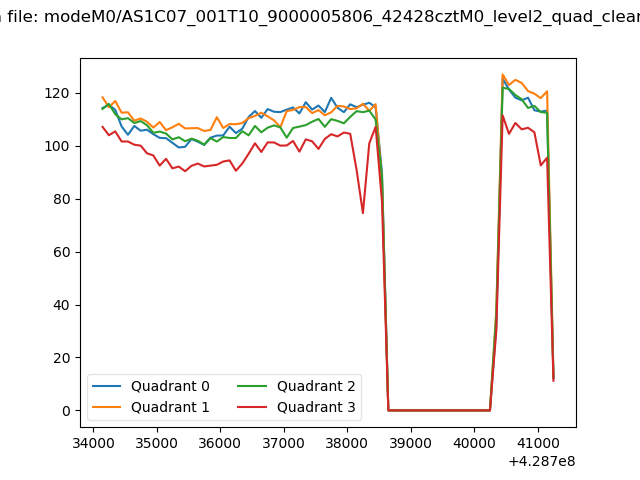 |
|
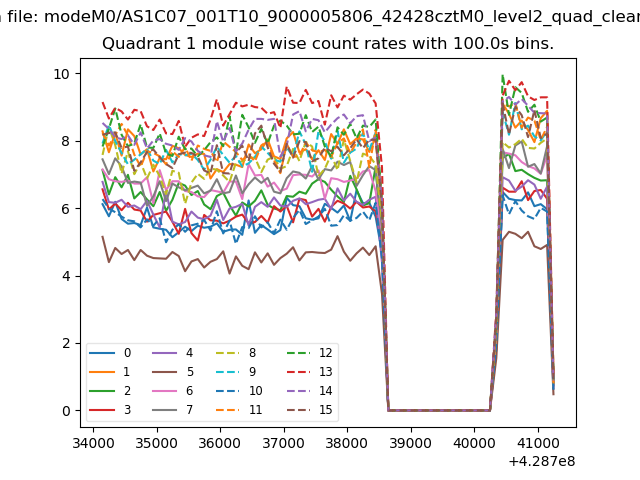
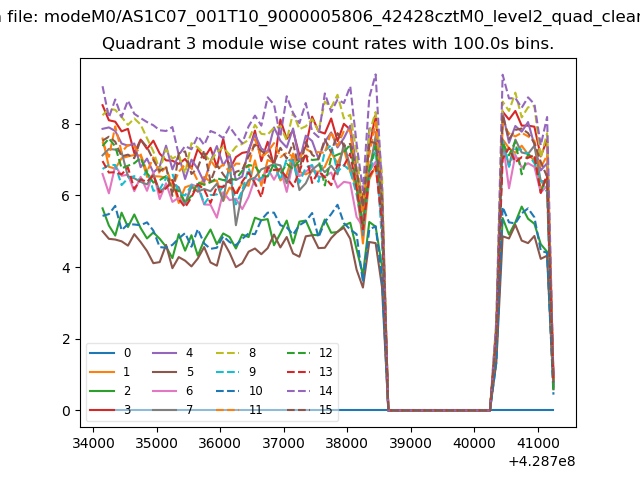
| Module-wise count rates for Quadrant A Data is divided into 100 sec bins |
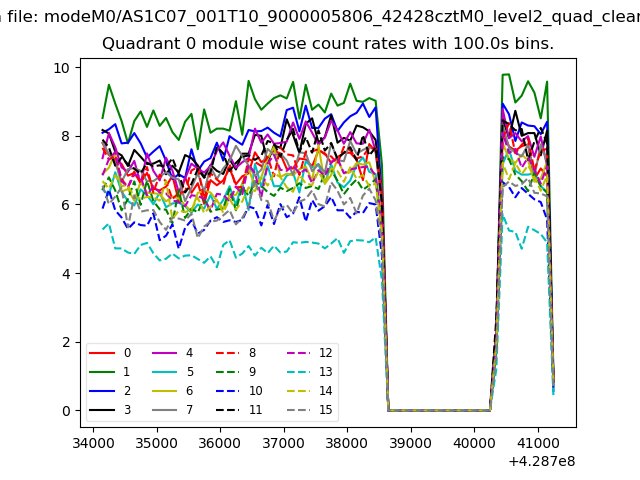 |
 |
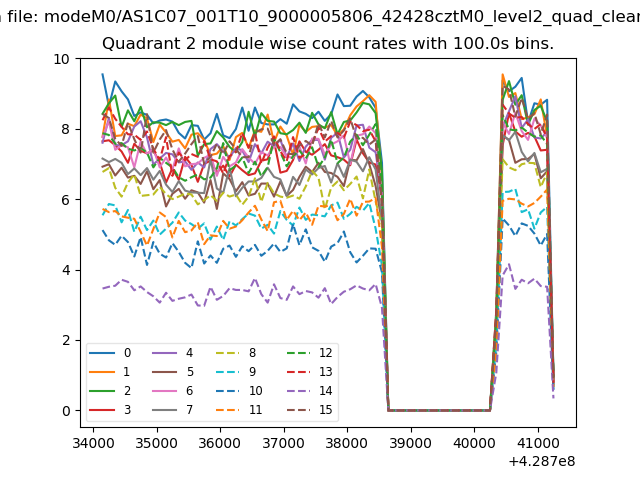
| Module-wise count rates for Quadrant B Data is divided into 100 sec bins |
 |
 |
| Module-wise count rates for Quadrant C Data is divided into 100 sec bins |
 |
 |
| Module-wise count rates for Quadrant D Data is divided into 100 sec bins |
 |
 |
| Parameter | Plot |
|---|---|
| CZT HV Monitor | 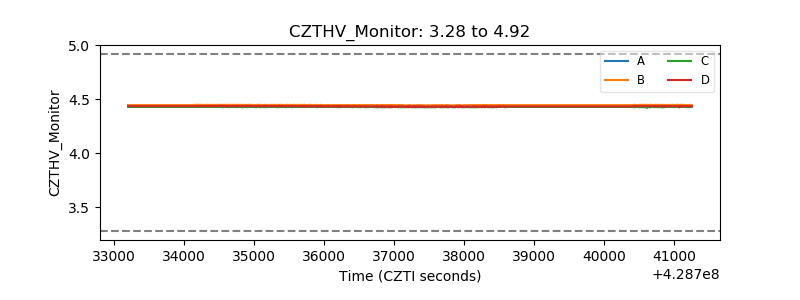 |
| D_VDD | 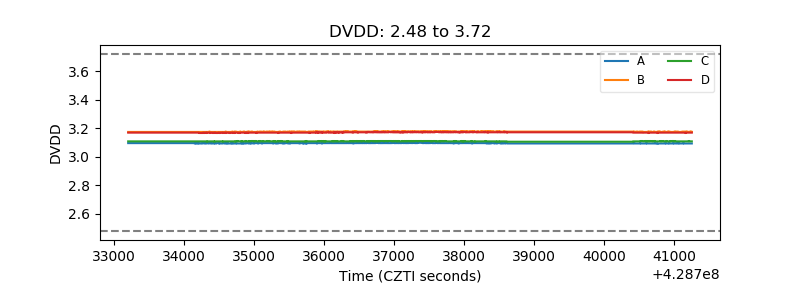 |
| Temperature 1 | 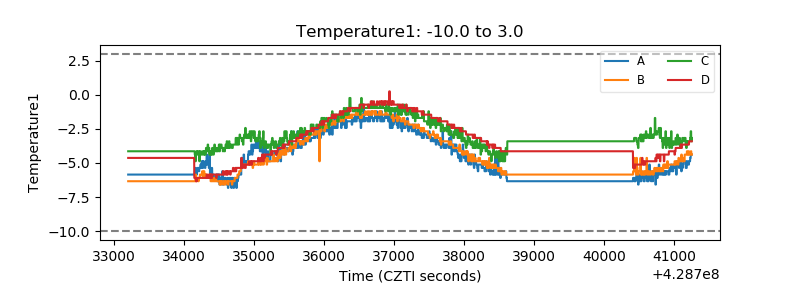 |
| Veto HV Monitor | 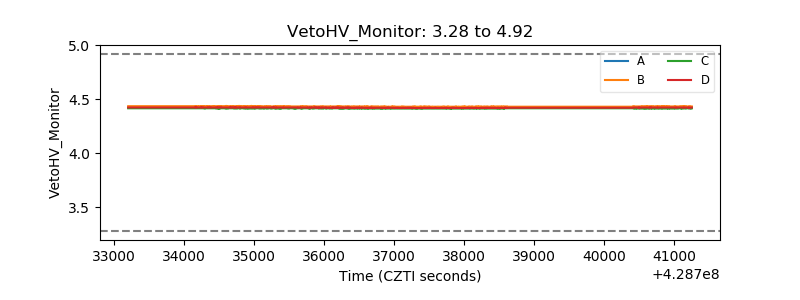 |
| Veto LLD | 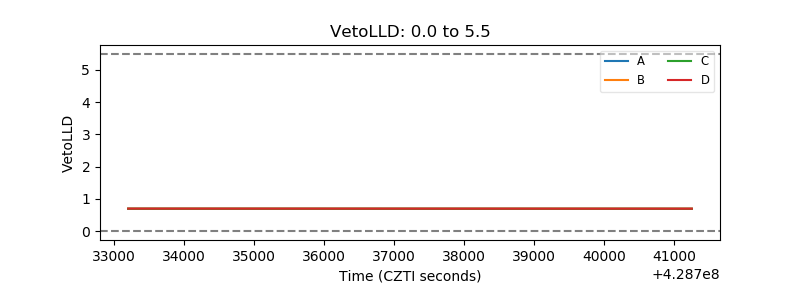 |
| Alpha Counter | 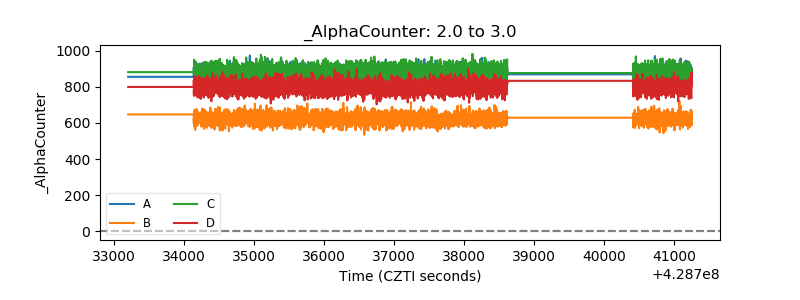 |
| _CPM_Rate | 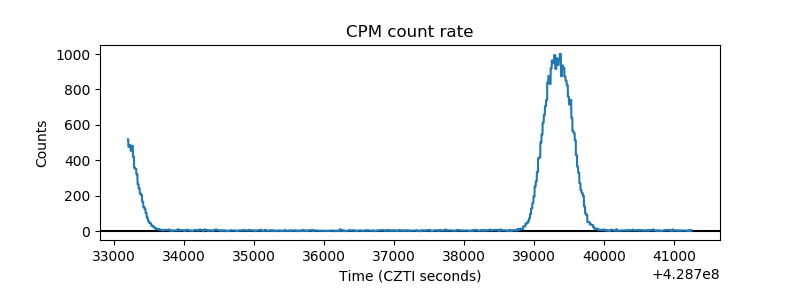 |
| CZT Counter | 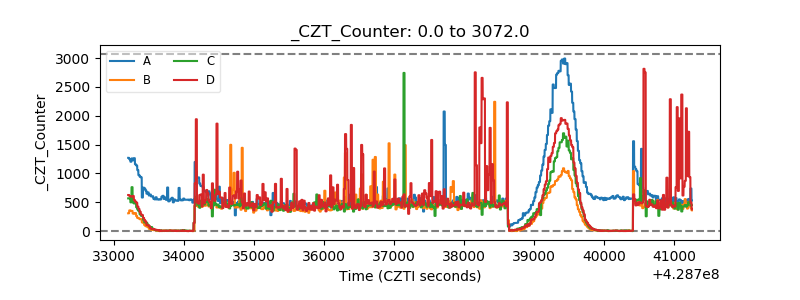 |
| +2.5 Volts monitor | 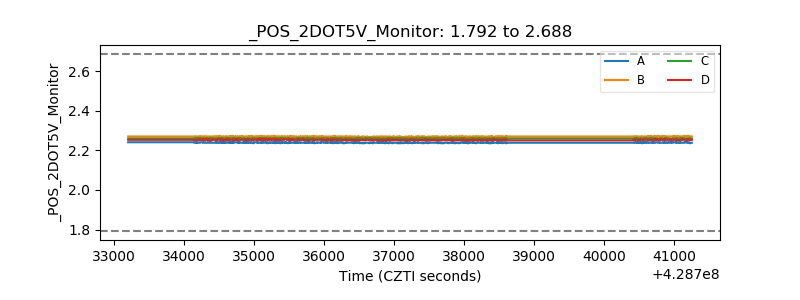 |
| +5 Volts monitor | 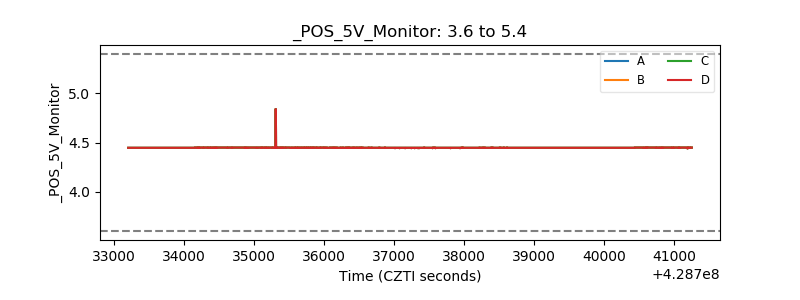 |
| _ROLL_ROT | 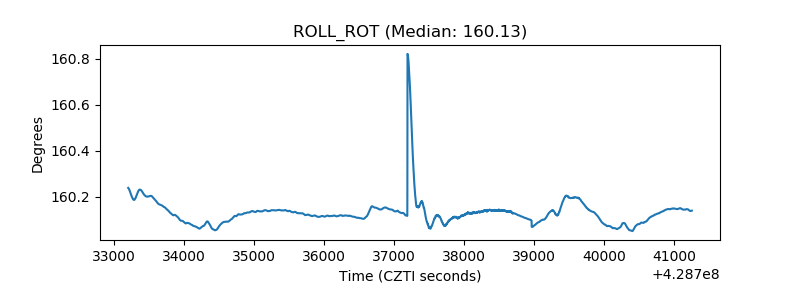 |
| _Roll_DEC | 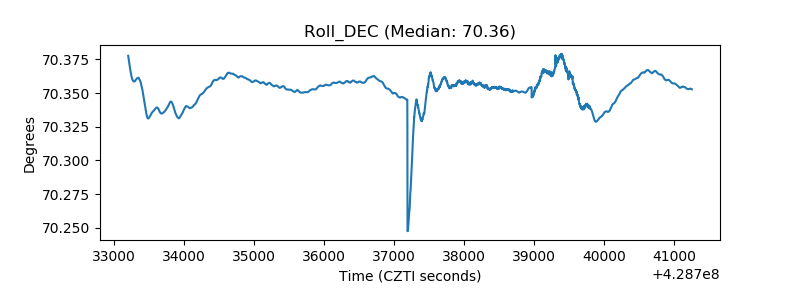 |
| _Roll_RA | 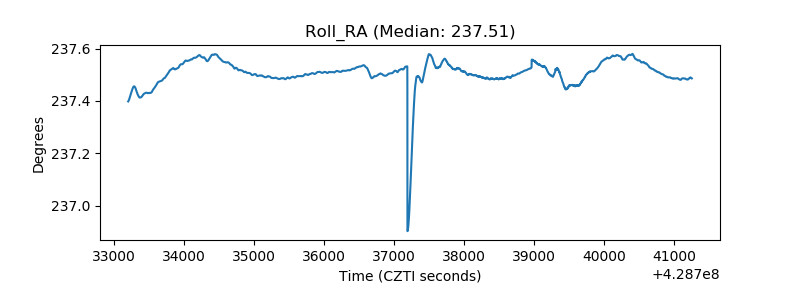 |
| Veto Counter | 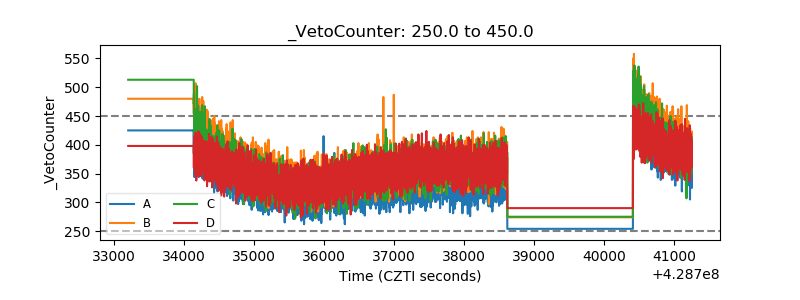 |