| Param | Original file | Final file |
|---|---|---|
| Filename | modeM0/AS1T05_138T01_9000005828_42860cztM0_level2.fits | modeM0/AS1T05_138T01_9000005828_42860cztM0_level2_quad_clean.evt |
| Size (bytes) | 364,132,800 | 92,793,600 |
| Size | 347.3 MB | 88.5 MB |
| Events in quadrant A | 3,452,532 | 605,959 |
| Events in quadrant B | 2,656,269 | 628,709 |
| Events in quadrant C | 2,786,659 | 636,551 |
| Events in quadrant D | 4,146,602 | 545,978 |
| Mode M0 | |||
|---|---|---|---|
| Quadrant | BADHDUFLAG | Total packets | Discarded packets |
| A | 0 | 13677 | 2 |
| B | 0 | 11734 | 2 |
| C | 0 | 11707 | 2 |
| D | 0 | 16005 | 2 |
| Mode M9 | |||
|---|---|---|---|
| Quadrant | BADHDUFLAG | Total packets | Discarded packets |
| A | 0 | 20 | 0 |
| B | 0 | 21 | 0 |
| C | 0 | 21 | 0 |
| D | 0 | 21 | 0 |
| Mode SS | |||
|---|---|---|---|
| Quadrant | BADHDUFLAG | Total packets | Discarded packets |
| A | 0 | 114 | 0 |
| B | 0 | 114 | 0 |
| C | 0 | 114 | 0 |
| D | 0 | 114 | 0 |
| Quadrant | Total seconds | Saturated seconds | Saturation percentage |
|---|---|---|---|
| A | 5613 | 106 | 1.888473% |
| B | 5613 | 25 | 0.445395% |
| C | 5613 | 17 | 0.302868% |
| D | 5613 | 376 | 6.698735% |
Noise dominated data is calculated using 1-second bins in cleaned event files. If a bin has >2000 counts, and if more than 50% of those come from <1% of pixels, then it is considered to be noise-dominated and hence unusable.
| Quadrant | # 1 sec bins | Bins with >0 counts | Bins with >2000 counts | High rate bins dominated by noise | Noise dominated (total time) | Noise dominated (detector-on time) | Marked lightcurve |
|---|---|---|---|---|---|---|---|
| A | 7195 | 5614 | 77 | 77 | 1.07% | 1.37% | 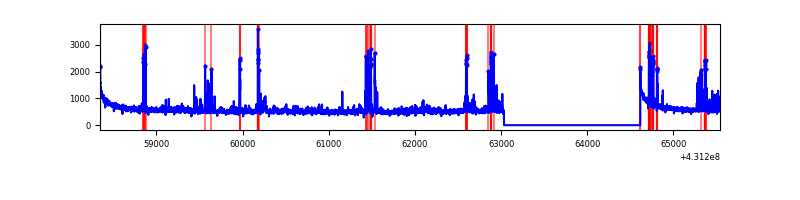 |
| B | 7195 | 5614 | 14 | 14 | 0.19% | 0.25% | 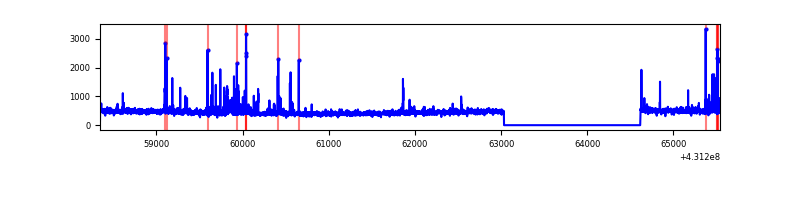 |
| C | 7195 | 5614 | 9 | 9 | 0.13% | 0.16% | 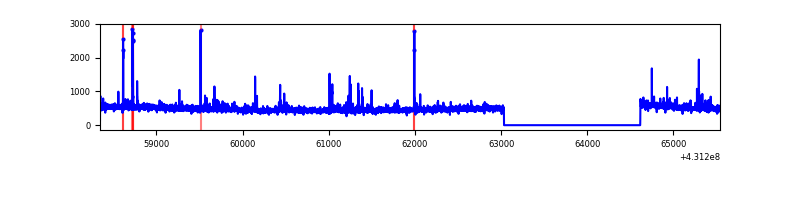 |
| D | 7195 | 5614 | 373 | 373 | 5.18% | 6.64% | 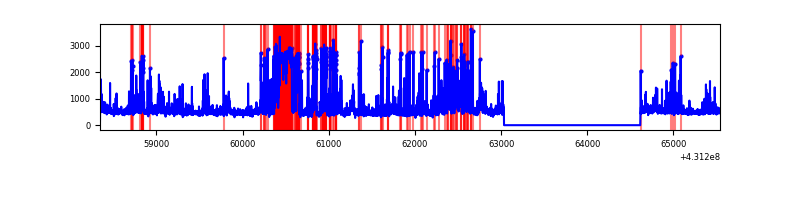 |
Top three noisy pixels from each quadrant. If the there are fewer than three noisy pixels in the level2.evt file, extra rows are filled as -1
| Pixel properties | Quadrant properties | ||||||
|---|---|---|---|---|---|---|---|
| Quadrant | DetID | PixID | Counts | Sigma | Mean | Median | Sigma |
| A | 10 | 83 | 618378 | 4773.32 | 618 | 606 | 129.4 |
| A | 15 | 237 | 201448 | 1551.84 | 618 | 606 | 129.4 |
| A | 12 | 189 | 135473 | 1042.07 | 618 | 606 | 129.4 |
| B | 5 | 255 | 83410 | 682.49 | 616 | 600 | 121.3 |
| B | 5 | 172 | 53156 | 433.15 | 616 | 600 | 121.3 |
| B | 0 | 229 | 25415 | 204.52 | 616 | 600 | 121.3 |
| C | 15 | 214 | 228601 | 1569.61 | 613 | 619 | 145.2 |
| C | 14 | 254 | 59713 | 406.85 | 613 | 619 | 145.2 |
| C | 12 | 249 | 38950 | 263.9 | 613 | 619 | 145.2 |
| D | 10 | 118 | 782358 | 5321.54 | 595 | 579 | 146.9 |
| D | 2 | 249 | 301003 | 2044.97 | 595 | 579 | 146.9 |
| D | 12 | 6 | 208201 | 1413.28 | 595 | 579 | 146.9 |
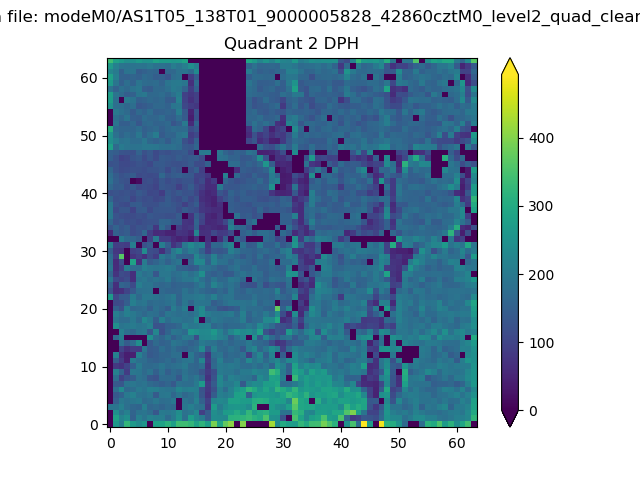
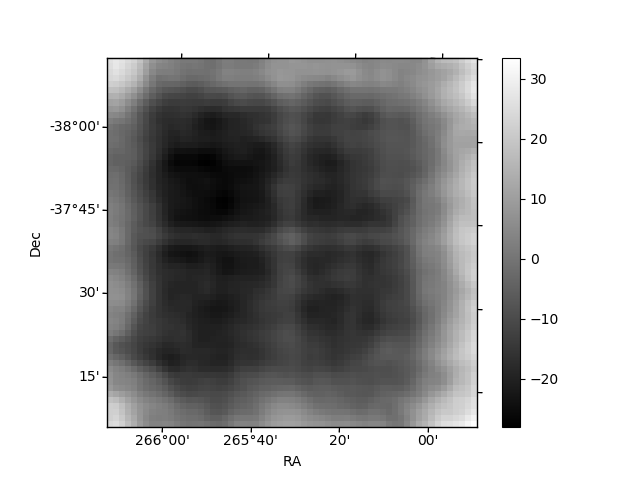
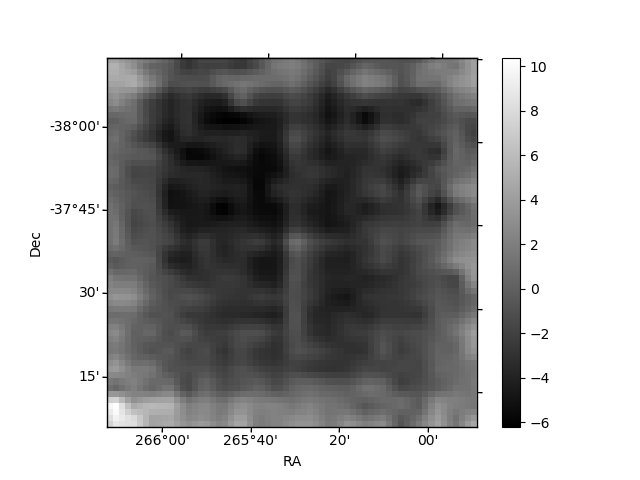
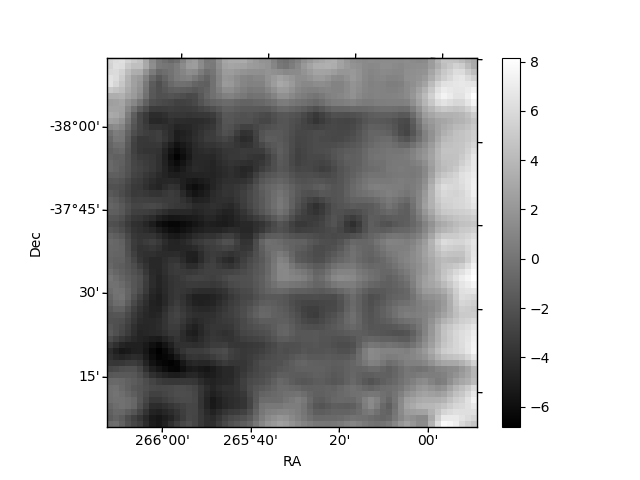
Histogram calculated using DETX and DETY for each event in the final _common_clean file
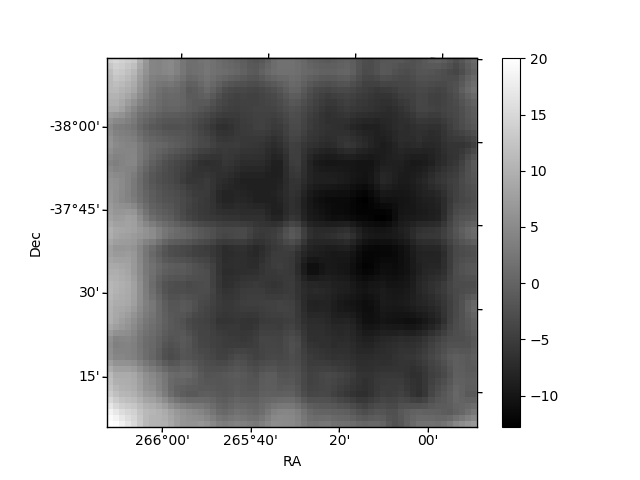
| Quadrant A | 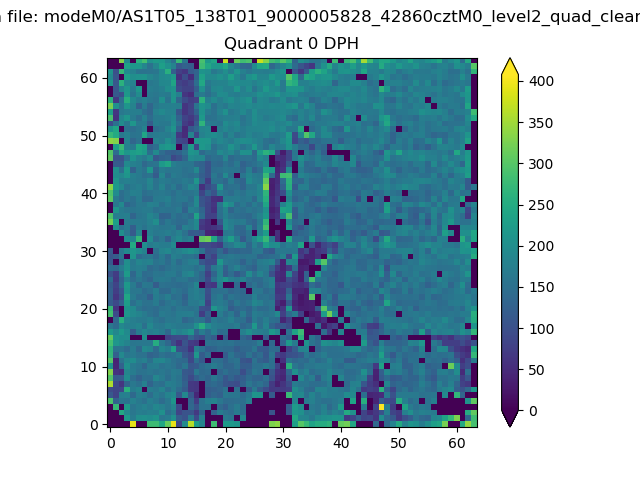 |
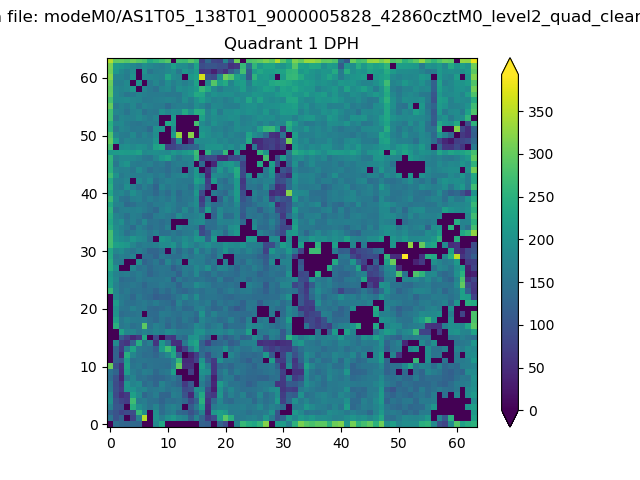 |
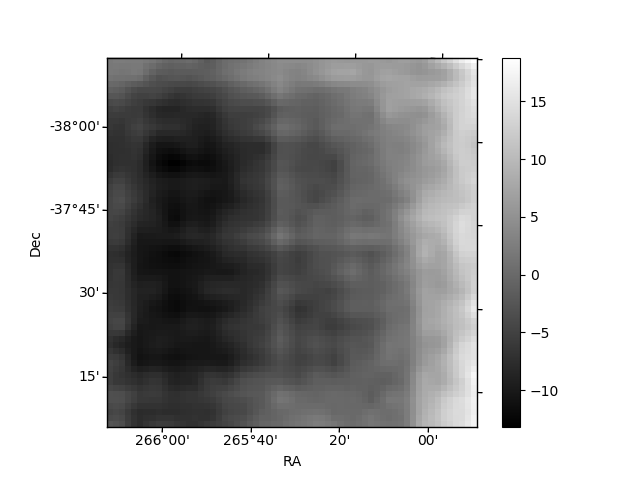
Quadrant B |
|---|---|---|---|
| Quadrant D | 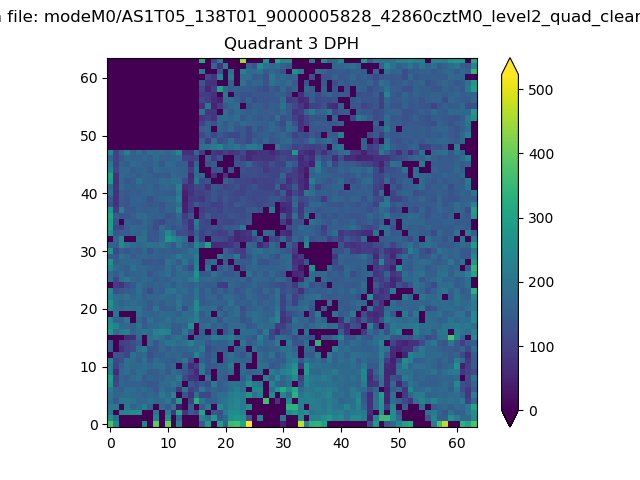 |
 |
Quadrant C |
| Plot type | Count rate plots | Images |
|---|---|---|
| Comparison with Poisson distribution Blue bars denote a histogram of data divided into 1 sec bins. Red curve is a Poisson curve with rate = median count rate of data. |
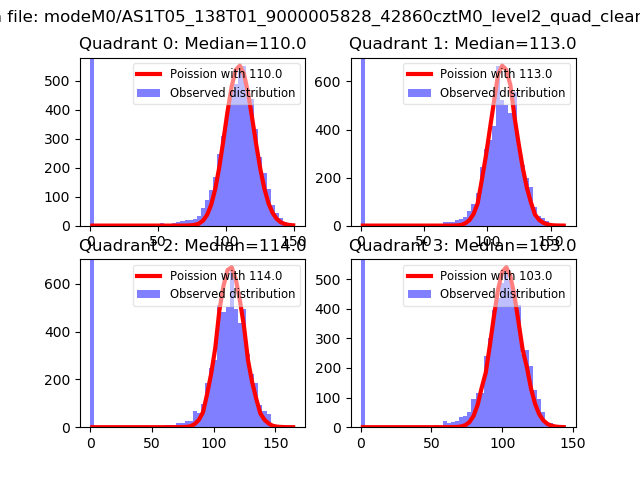 |
 |
| Quadrant-wise count rates Data is divided into 100 sec bins |
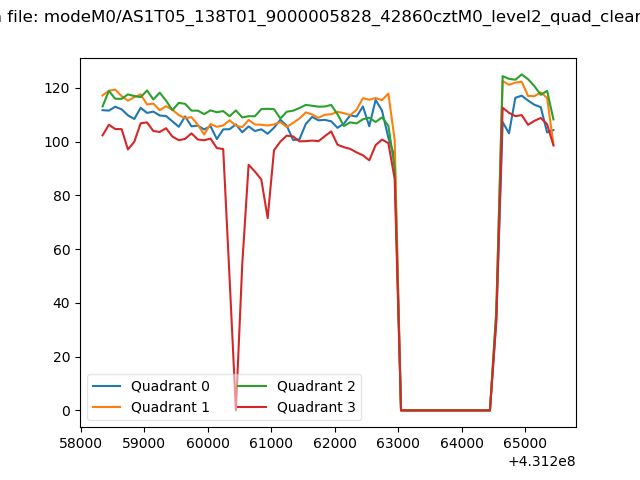 |
|
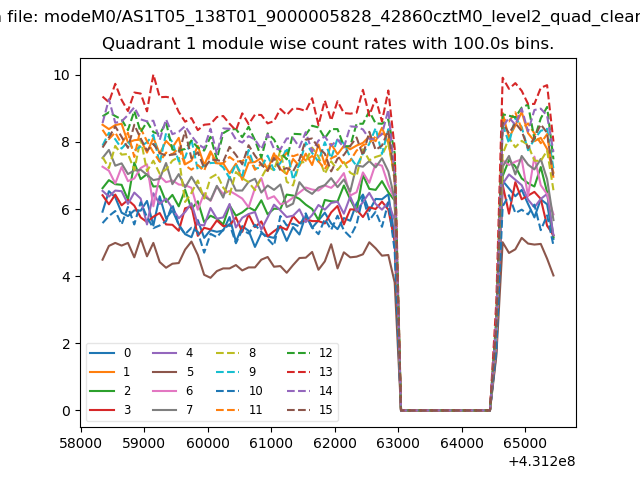
| Module-wise count rates for Quadrant A Data is divided into 100 sec bins |
 |
 |
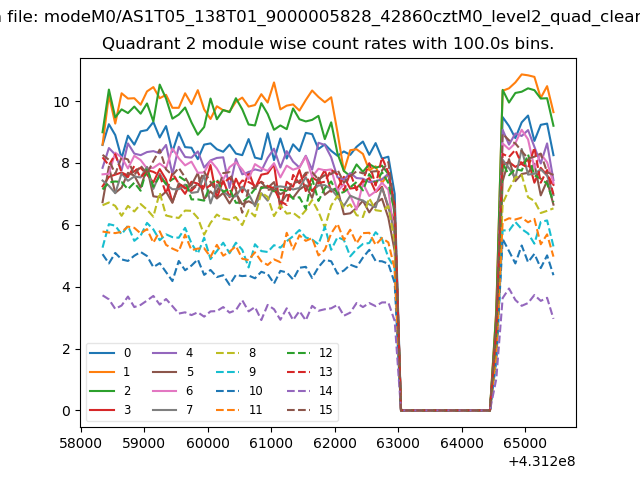
| Module-wise count rates for Quadrant B Data is divided into 100 sec bins |
 |
 |
| Module-wise count rates for Quadrant C Data is divided into 100 sec bins |
 |
 |
| Module-wise count rates for Quadrant D Data is divided into 100 sec bins |
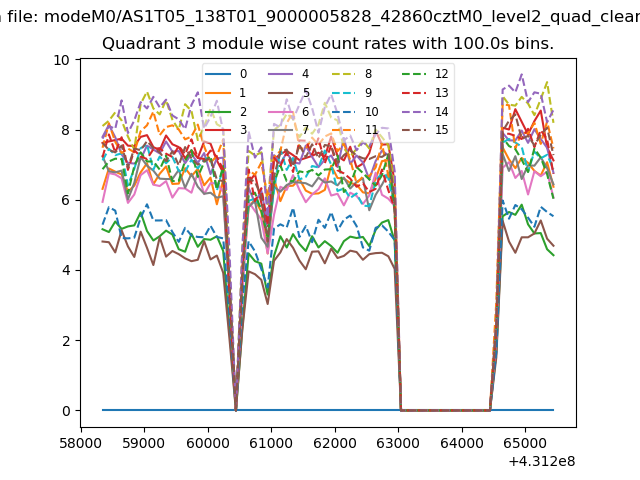 |
 |
| Parameter | Plot |
|---|---|
| CZT HV Monitor | 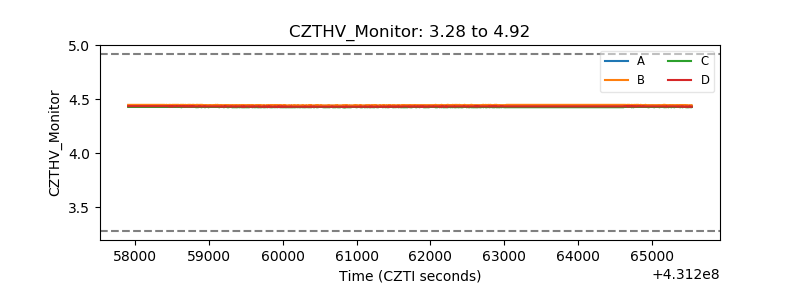 |
| D_VDD | 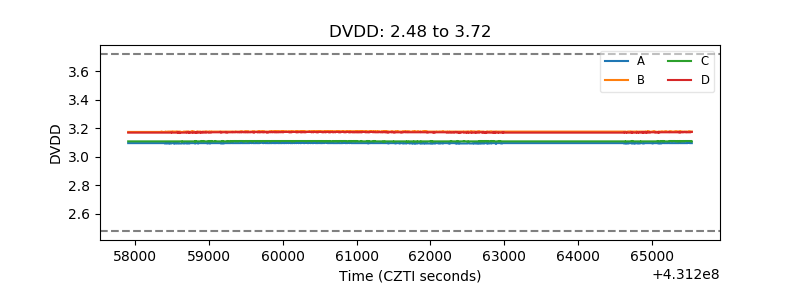 |
| Temperature 1 | 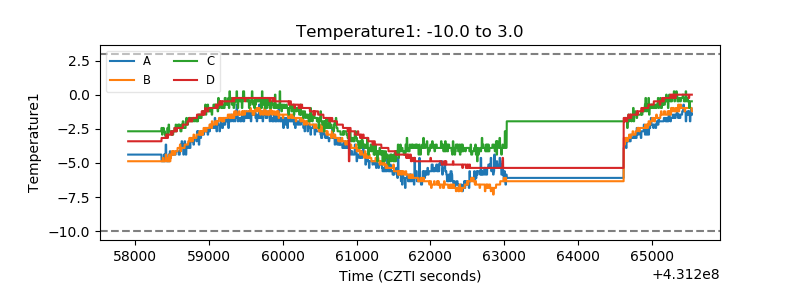 |
| Veto HV Monitor | 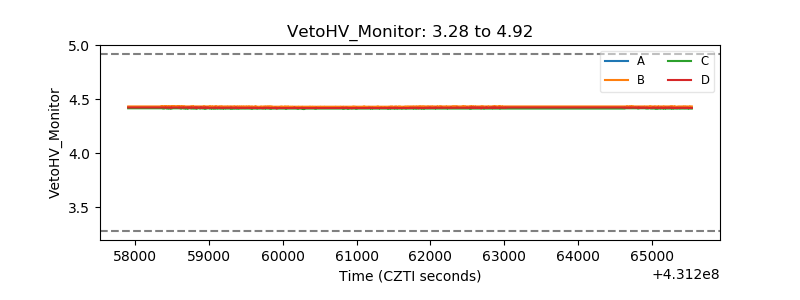 |
| Veto LLD | 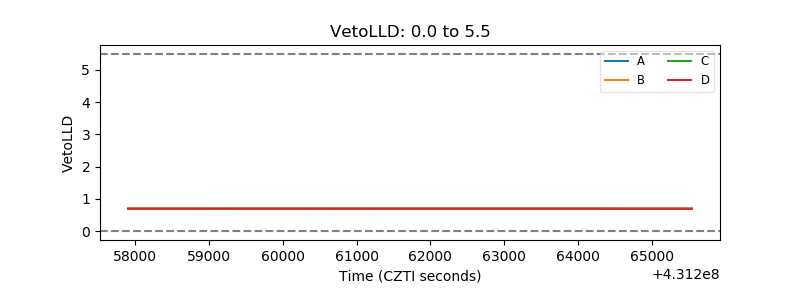 |
| Alpha Counter | 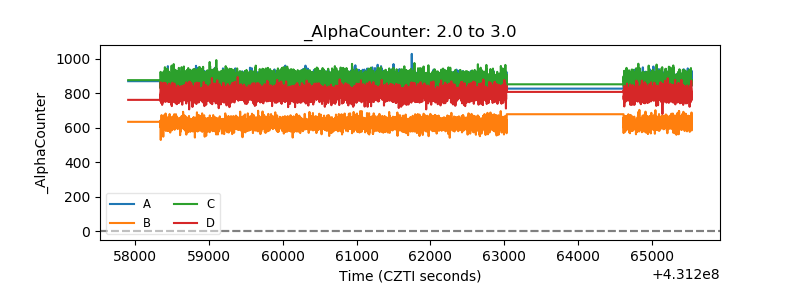 |
| _CPM_Rate | 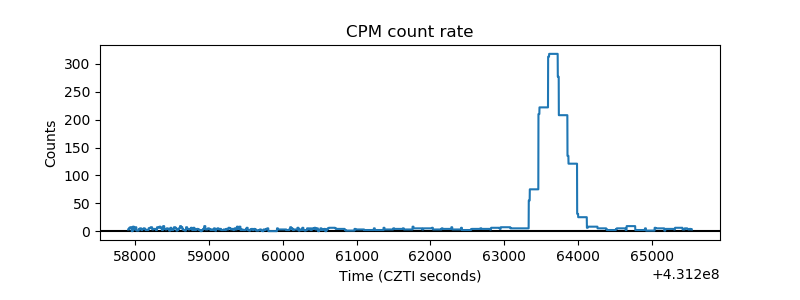 |
| CZT Counter | 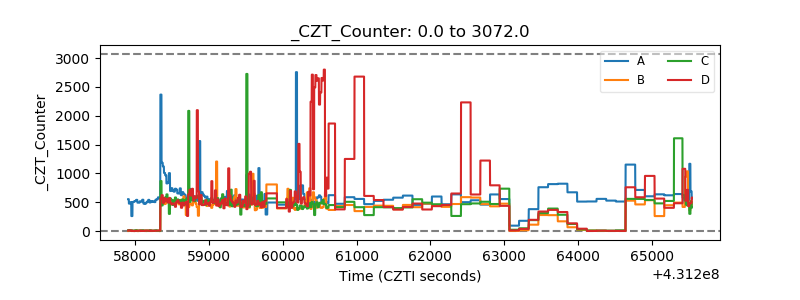 |
| +2.5 Volts monitor | 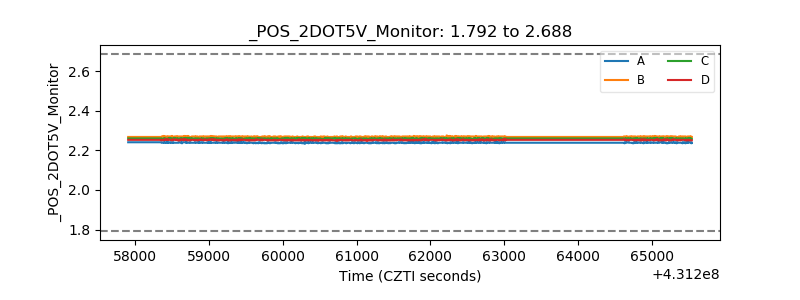 |
| +5 Volts monitor |  |
| _ROLL_ROT | 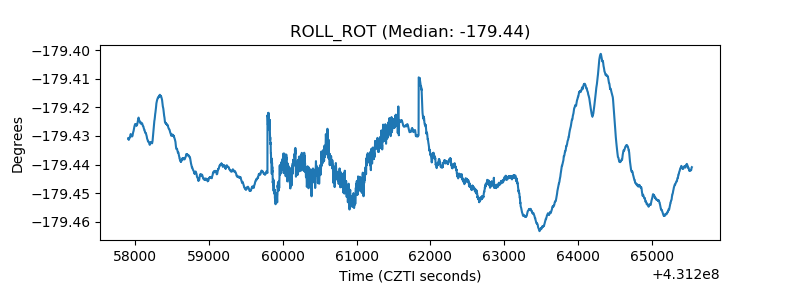 |
| _Roll_DEC | 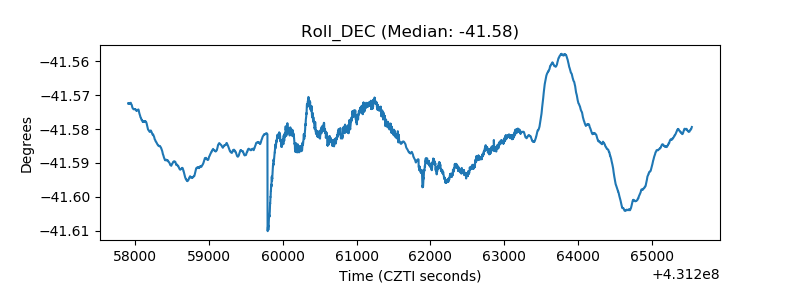 |
| _Roll_RA | 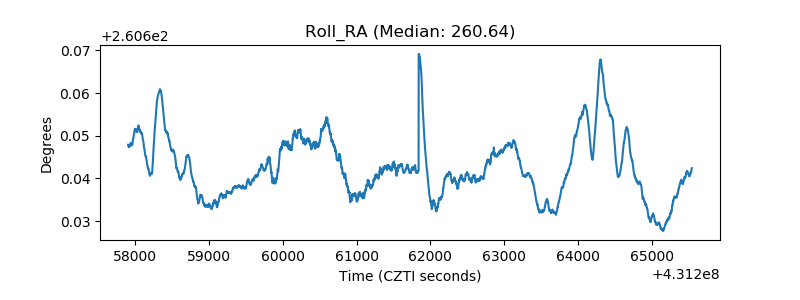 |
| Veto Counter | 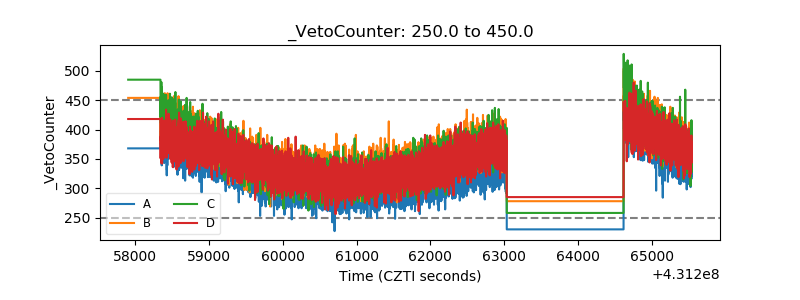 |