| Param | Original file | Final file |
|---|---|---|
| Filename | modeM0/AS1P01_003T01_9000000002cztM0_level2.fits | modeM0/AS1P01_003T01_9000000002cztM0_level2_quad_clean.evt |
| Size (bytes) | 440,409,600 | 420,206,400 |
| Size | 420.0 MB | 400.7 MB |
| Events in quadrant A | 2,503,630 | 2,357,713 |
| Events in quadrant B | 2,500,022 | 2,378,710 |
| Events in quadrant C | 2,529,322 | 2,266,712 |
| Events in quadrant D | 2,068,762 | 1,987,074 |
| Mode SS | |||
|---|---|---|---|
| Quadrant | BADHDUFLAG | Total packets | Discarded packets |
| A | 0 | 1120 | 0 |
| B | 0 | 1122 | 0 |
| C | 0 | 1118 | 0 |
| D | 0 | 1116 | 0 |
| Mode M9 | |||
|---|---|---|---|
| Quadrant | BADHDUFLAG | Total packets | Discarded packets |
| A | 0 | 188 | 0 |
| B | 0 | 188 | 0 |
| C | 0 | 188 | 0 |
| D | 0 | 188 | 0 |
| Mode M0 | |||
|---|---|---|---|
| Quadrant | BADHDUFLAG | Total packets | Discarded packets |
| A | 0 | 247876 | 0 |
| B | 0 | 247476 | 0 |
| C | 0 | 236426 | 0 |
| D | 0 | 257740 | 0 |
| Quadrant | Total seconds | Saturated seconds | Saturation percentage |
|---|---|---|---|
| A | 54651 | 705 | 1.290004% |
| B | 54449 | 300 | 0.550974% |
| C | 54651 | 593 | 1.085067% |
| D | 53980 | 1204 | 2.230456% |
Noise dominated data is calculated using 1-second bins in cleaned event files. If a bin has >2000 counts, and if more than 50% of those come from <1% of pixels, then it is considered to be noise-dominated and hence unusable.
| Quadrant | # 1 sec bins | Bins with >0 counts | Bins with >2000 counts | High rate bins dominated by noise | Noise dominated (total time) | Noise dominated (detector-on time) | Marked lightcurve |
|---|---|---|---|---|---|---|---|
| A | 84498 | 54752 | 0 | 0 | 0.00% | 0.00% | 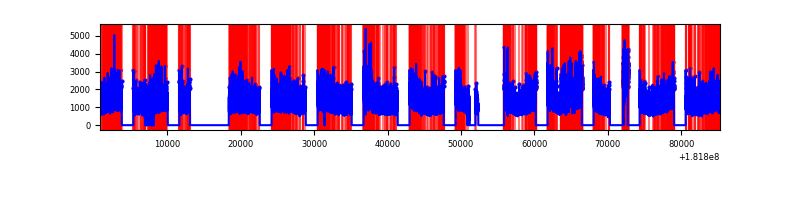 |
| B | 84498 | 54574 | 0 | 0 | 0.00% | 0.00% |  |
| C | 84498 | 54759 | 0 | 0 | 0.00% | 0.00% |  |
| D | 84498 | 54105 | 0 | 0 | 0.00% | 0.00% | 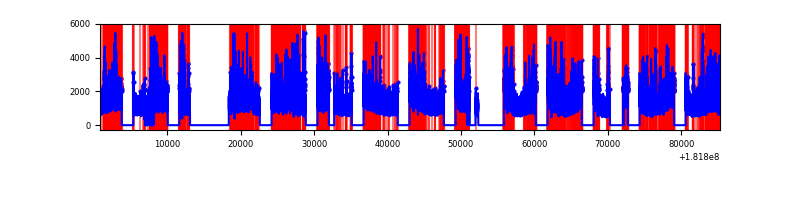 |
Top three noisy pixels from each quadrant. If the there are fewer than three noisy pixels in the level2.evt file, extra rows are filled as -1
| Pixel properties | Quadrant properties | ||||||
|---|---|---|---|---|---|---|---|
| Quadrant | DetID | PixID | Counts | Sigma | Mean | Median | Sigma |
| A | 7 | 110 | 2507 | 12.51 | 653 | 609 | 151.7 |
| A | 0 | 29 | 2235 | 10.72 | 653 | 609 | 151.7 |
| A | 9 | 108 | 1762 | 7.6 | 653 | 609 | 151.7 |
| B | 2 | 9 | 2077 | 12.39 | 667 | 636 | 116.3 |
| B | 14 | 254 | 1709 | 9.23 | 667 | 636 | 116.3 |
| B | 5 | 225 | 1565 | 7.99 | 667 | 636 | 116.3 |
| C | 3 | 203 | 2170 | 9.37 | 670 | 621 | 165.2 |
| C | 3 | 187 | 1780 | 7.01 | 670 | 621 | 165.2 |
| C | 3 | 202 | 1763 | 6.91 | 670 | 621 | 165.2 |
| D | 6 | 231 | 1647 | 7.48 | 600 | 548 | 146.8 |
| D | 11 | 82 | 1595 | 7.13 | 600 | 548 | 146.8 |
| D | 10 | 189 | 1565 | 6.93 | 600 | 548 | 146.8 |
Histogram calculated using DETX and DETY for each event in the final _common_clean file
| Quadrant A | 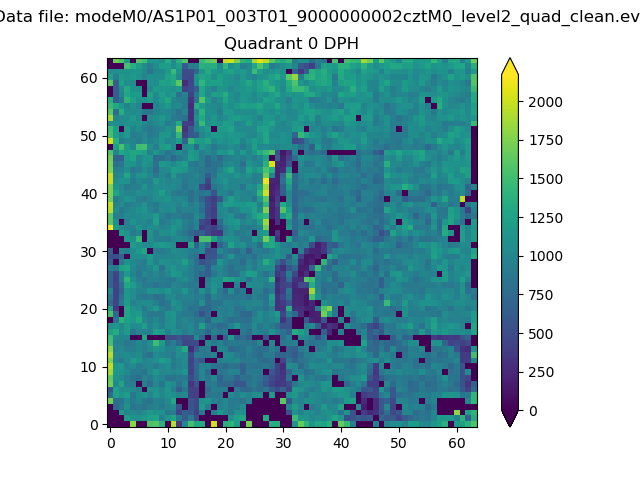 |
 |
Quadrant B |
|---|---|---|---|
| Quadrant D |  |
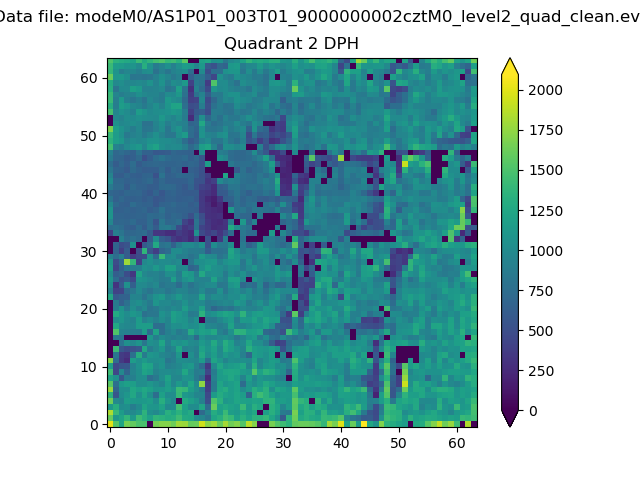 |
Quadrant C |
| Plot type | Count rate plots | Images |
|---|---|---|
| Comparison with Poisson distribution Blue bars denote a histogram of data divided into 1 sec bins. Red curve is a Poisson curve with rate = median count rate of data. |
 |
 |
| Quadrant-wise count rates Data is divided into 100 sec bins |
 |
|
| Module-wise count rates for Quadrant A Data is divided into 100 sec bins |
 |
 |
| Module-wise count rates for Quadrant B Data is divided into 100 sec bins |
 |
 |
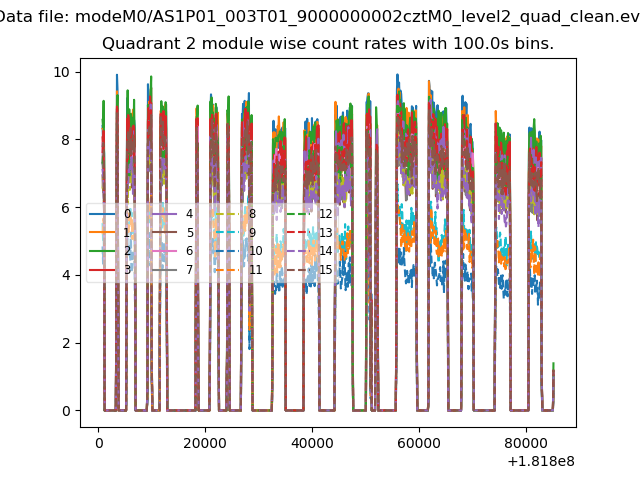
| Module-wise count rates for Quadrant C Data is divided into 100 sec bins |
 |
 |
| Module-wise count rates for Quadrant D Data is divided into 100 sec bins |
 |
 |
| Parameter | Plot |
|---|---|
| CZT HV Monitor |  |
| D_VDD | 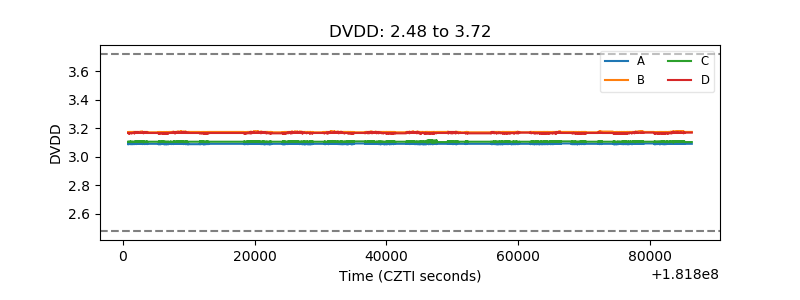 |
| Temperature 1 |  |
| Veto HV Monitor |  |
| Veto LLD | 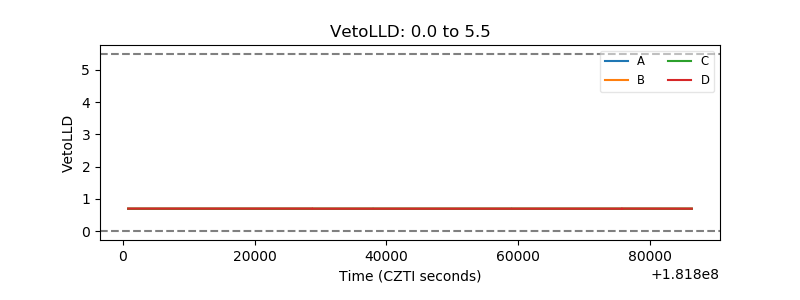 |
| Alpha Counter |  |
| _CPM_Rate |  |
| CZT Counter |  |
| +2.5 Volts monitor |  |
| +5 Volts monitor |  |
| _ROLL_ROT | 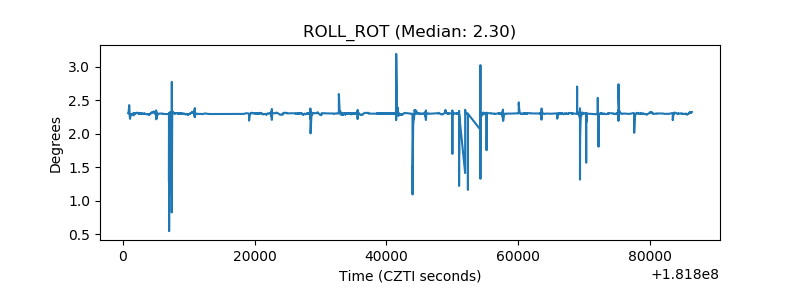 |
| _Roll_DEC |  |
| _Roll_RA | 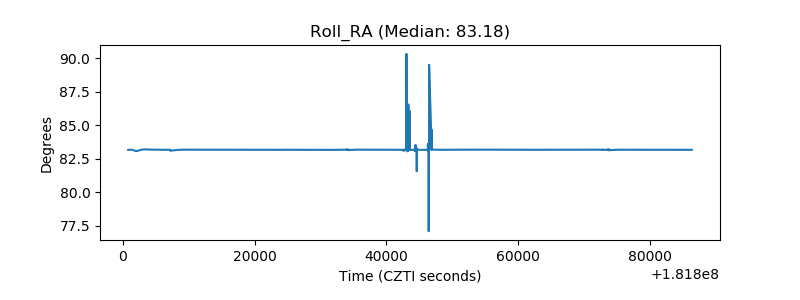 |
| Veto Counter |  |