| Param | Original file | Final file |
|---|---|---|
| Filename | modeM0/AS1P01_003T01_9000000002_00120cztM0_level2.fits | modeM0/AS1P01_003T01_9000000002_00120cztM0_level2_quad_clean.evt |
| Size (bytes) | 622,428,480 | 44,104,320 |
| Size | 593.6 MB | 42.1 MB |
| Events in quadrant A | 5,620,389 | 253,932 |
| Events in quadrant B | 5,689,024 | 259,827 |
| Events in quadrant C | 5,257,578 | 256,687 |
| Events in quadrant D | 6,133,103 | 251,294 |
| Mode SS | |||
|---|---|---|---|
| Quadrant | BADHDUFLAG | Total packets | Discarded packets |
| A | 0 | 92 | 0 |
| B | 0 | 92 | 0 |
| C | 0 | 92 | 0 |
| D | 0 | 92 | 0 |
| Mode M9 | |||
|---|---|---|---|
| Quadrant | BADHDUFLAG | Total packets | Discarded packets |
| A | 0 | 15 | 0 |
| B | 0 | 15 | 0 |
| C | 0 | 15 | 0 |
| D | 0 | 15 | 0 |
| Mode M0 | |||
|---|---|---|---|
| Quadrant | BADHDUFLAG | Total packets | Discarded packets |
| A | 0 | 19835 | 2 |
| B | 0 | 20028 | 1 |
| C | 0 | 18747 | 1 |
| D | 0 | 21366 | 1 |
| Quadrant | Total seconds | Saturated seconds | Saturation percentage |
|---|---|---|---|
| A | 4448 | 13 | 0.292266% |
| B | 4448 | 48 | 1.079137% |
| C | 4448 | 12 | 0.269784% |
| D | 4448 | 145 | 3.259892% |
Noise dominated data is calculated using 1-second bins in cleaned event files. If a bin has >2000 counts, and if more than 50% of those come from <1% of pixels, then it is considered to be noise-dominated and hence unusable.
| Quadrant | # 1 sec bins | Bins with >0 counts | Bins with >2000 counts | High rate bins dominated by noise | Noise dominated (total time) | Noise dominated (detector-on time) | Marked lightcurve |
|---|---|---|---|---|---|---|---|
| A | 6038 | 4449 | 170 | 170 | 2.82% | 3.82% | 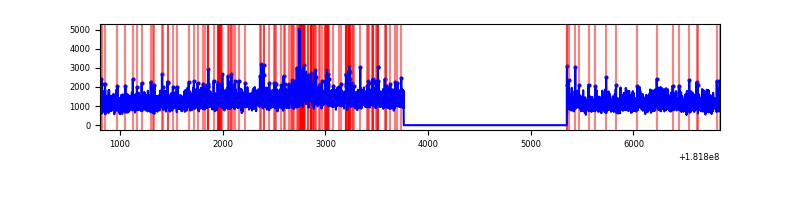 |
| B | 6038 | 4449 | 171 | 171 | 2.83% | 3.84% | 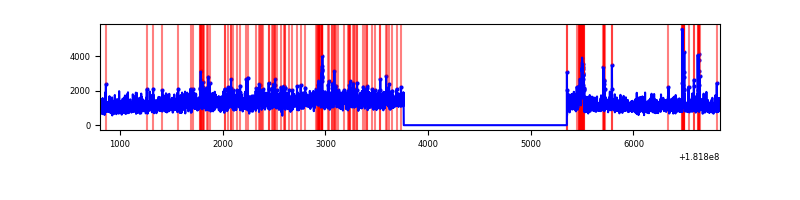 |
| C | 6038 | 4449 | 116 | 116 | 1.92% | 2.61% | 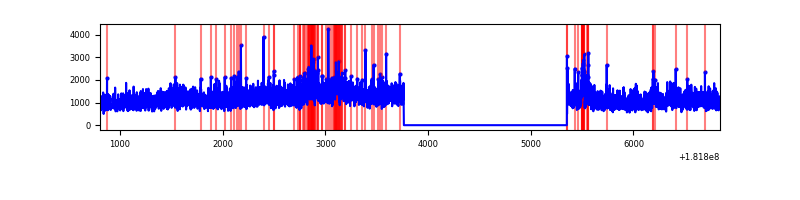 |
| D | 6038 | 4449 | 500 | 500 | 8.28% | 11.24% | 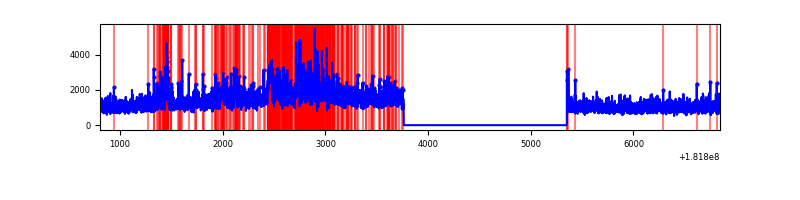 |
Top three noisy pixels from each quadrant. If the there are fewer than three noisy pixels in the level2.evt file, extra rows are filled as -1
| Pixel properties | Quadrant properties | ||||||
|---|---|---|---|---|---|---|---|
| Quadrant | DetID | PixID | Counts | Sigma | Mean | Median | Sigma |
| A | 8 | 3 | 42647 | 178.55 | 1392 | 1360 | 231.2 |
| A | 15 | 22 | 35271 | 146.65 | 1392 | 1360 | 231.2 |
| A | 14 | 35 | 28809 | 118.71 | 1392 | 1360 | 231.2 |
| B | 3 | 2 | 75143 | 273.24 | 1374 | 1361 | 270.0 |
| B | 5 | 85 | 64744 | 234.73 | 1374 | 1361 | 270.0 |
| B | 8 | 236 | 45168 | 162.23 | 1374 | 1361 | 270.0 |
| C | 8 | 224 | 219520 | 624.61 | 1231 | 1273 | 349.4 |
| C | 2 | 52 | 57159 | 159.94 | 1231 | 1273 | 349.4 |
| C | 10 | 57 | 46020 | 128.06 | 1231 | 1273 | 349.4 |
| D | 10 | 82 | 518195 | 1501.66 | 1300 | 1311 | 344.2 |
| D | 9 | 35 | 63912 | 181.87 | 1300 | 1311 | 344.2 |
| D | 5 | 35 | 48461 | 136.98 | 1300 | 1311 | 344.2 |
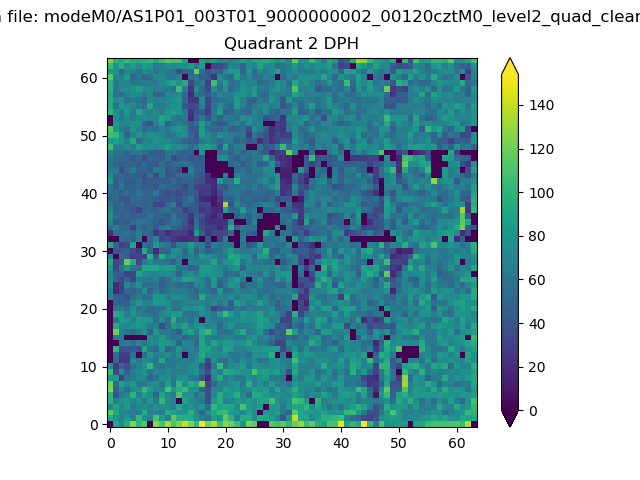
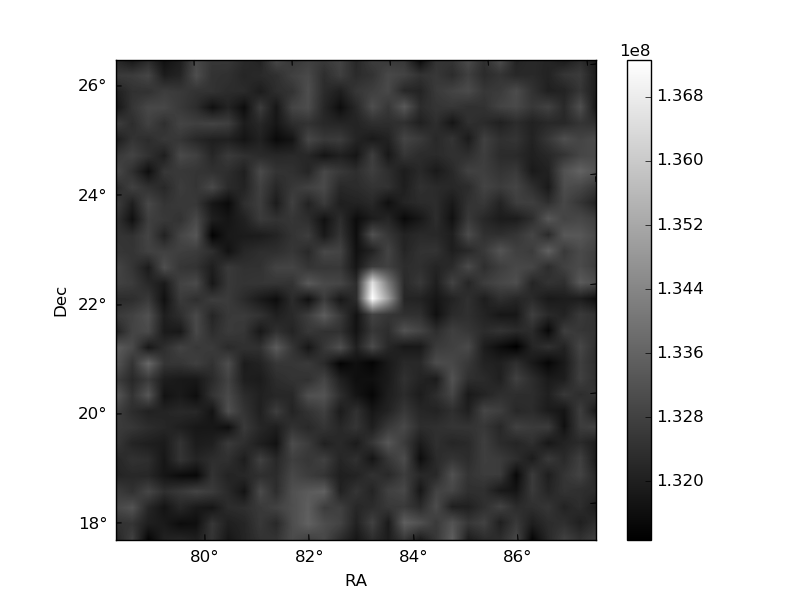
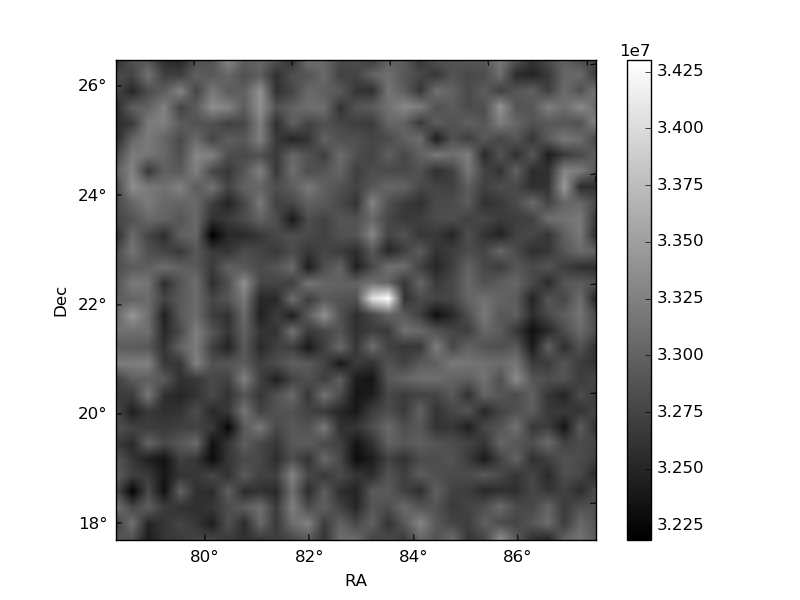
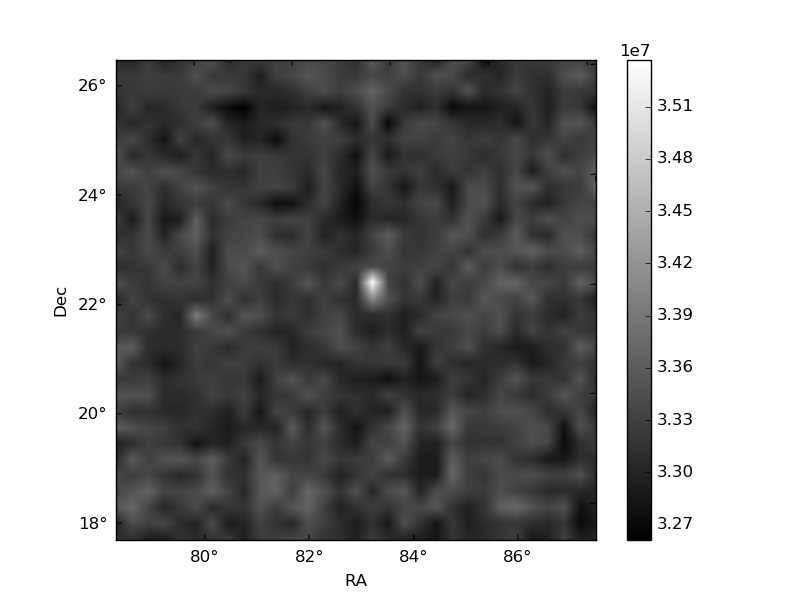
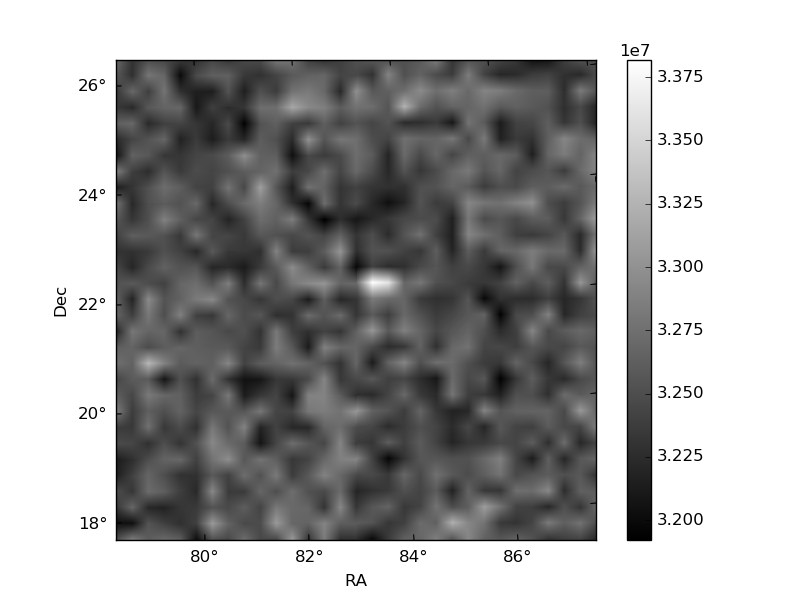
Histogram calculated using DETX and DETY for each event in the final _common_clean file
| Quadrant A | 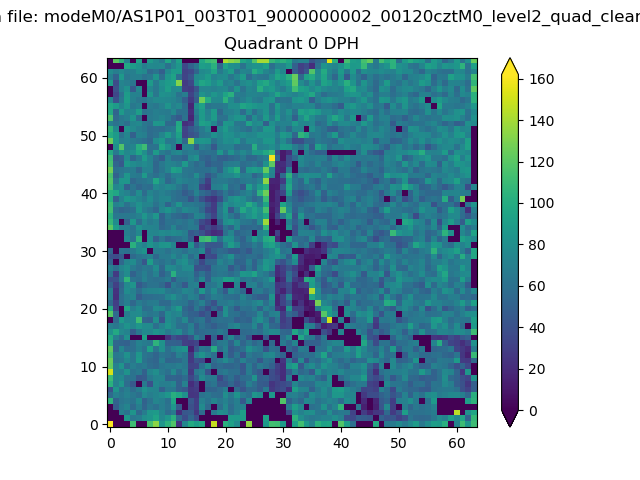 |
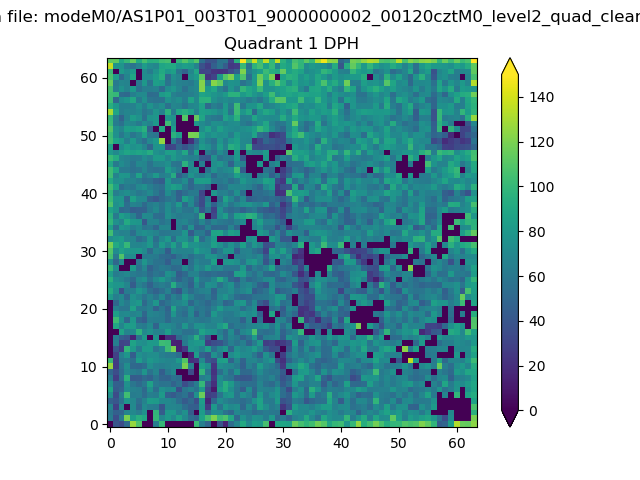 |
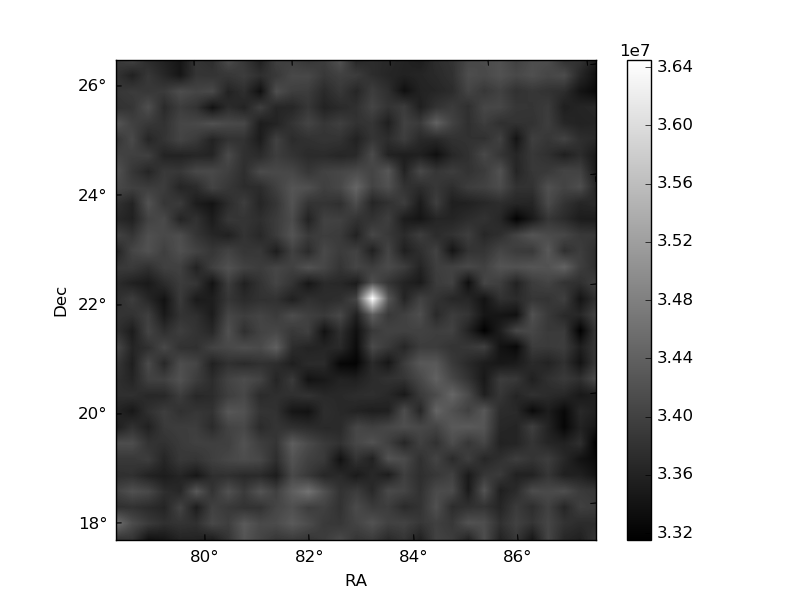
Quadrant B |
|---|---|---|---|
| Quadrant D | 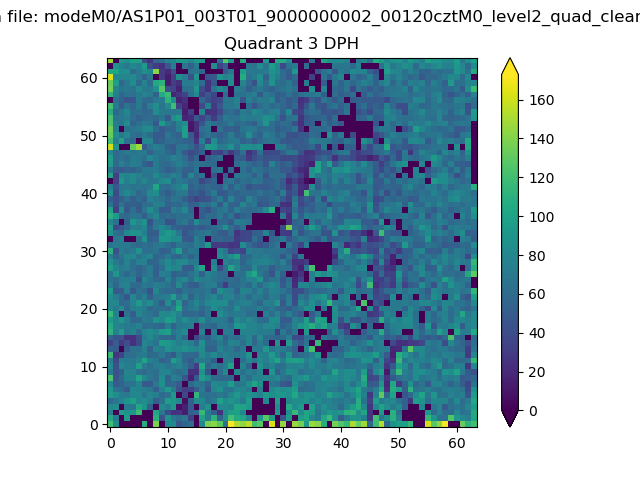 |
 |
Quadrant C |
| Plot type | Count rate plots | Images |
|---|---|---|
| Comparison with Poisson distribution Blue bars denote a histogram of data divided into 1 sec bins. Red curve is a Poisson curve with rate = median count rate of data. |
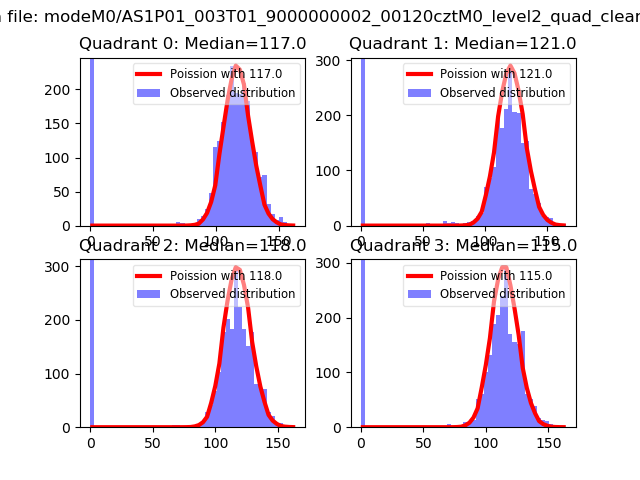 |
 |
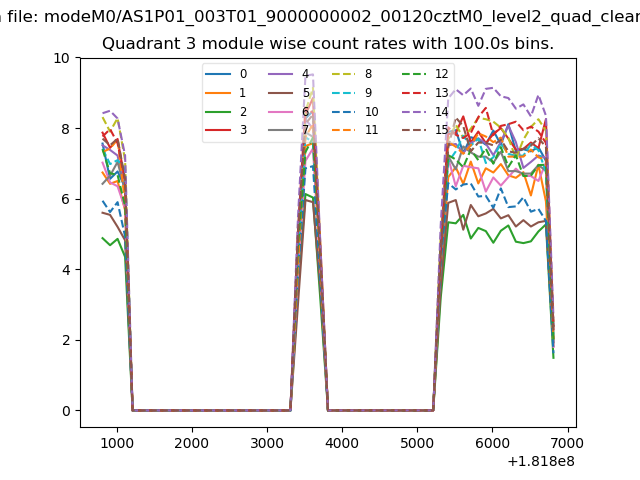
| Quadrant-wise count rates Data is divided into 100 sec bins |
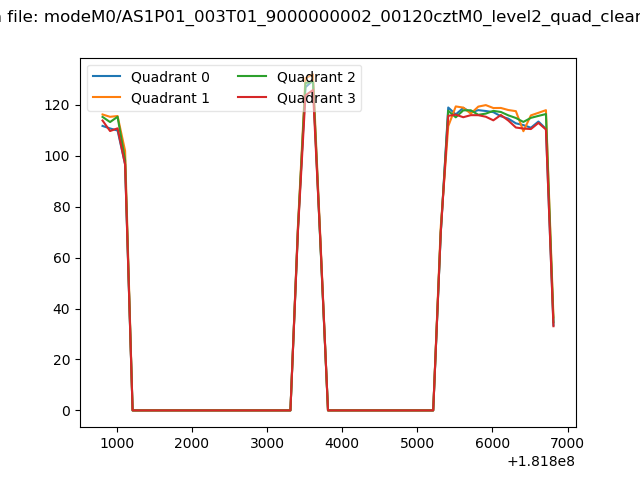 |
|
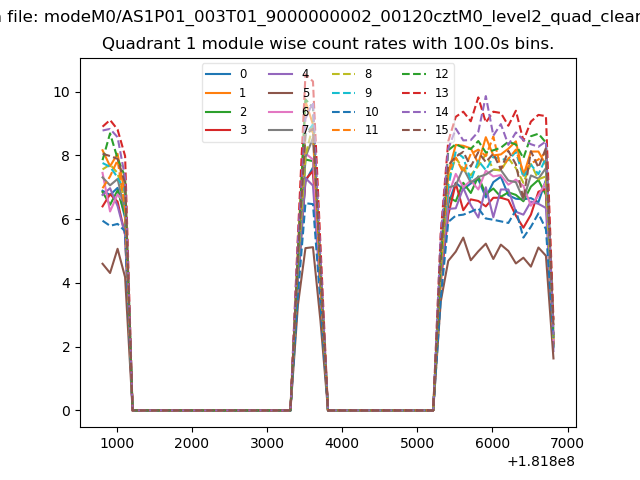
| Module-wise count rates for Quadrant A Data is divided into 100 sec bins |
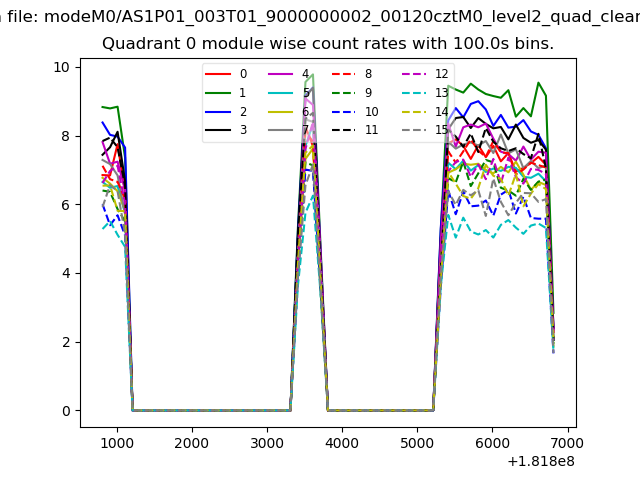 |
 |
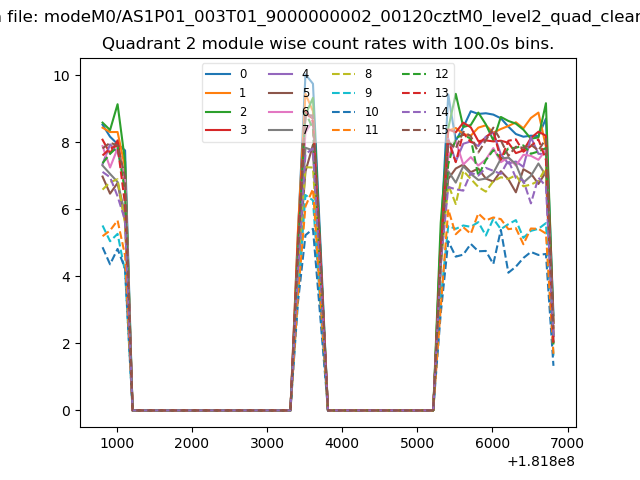
| Module-wise count rates for Quadrant B Data is divided into 100 sec bins |
 |
 |
| Module-wise count rates for Quadrant C Data is divided into 100 sec bins |
 |
 |
| Module-wise count rates for Quadrant D Data is divided into 100 sec bins |
 |
 |
| Parameter | Plot |
|---|---|
| CZT HV Monitor | 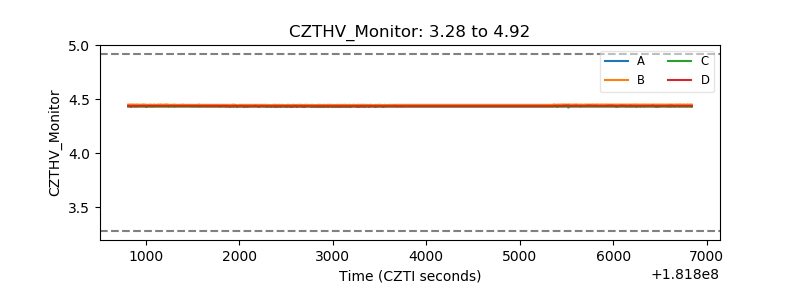 |
| D_VDD | 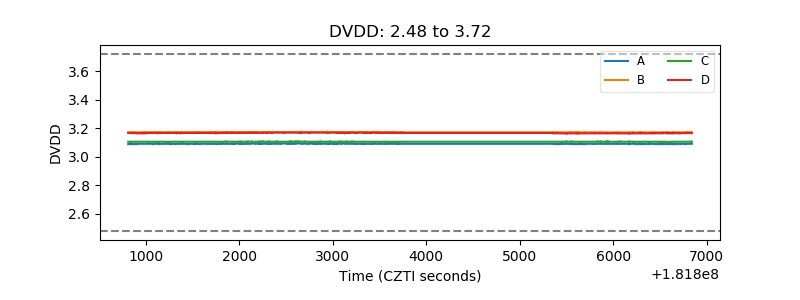 |
| Temperature 1 | 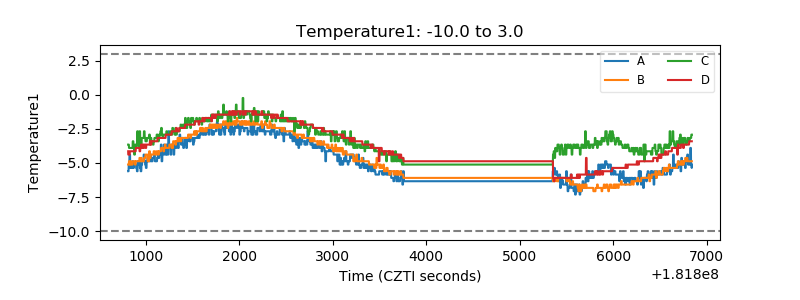 |
| Veto HV Monitor | 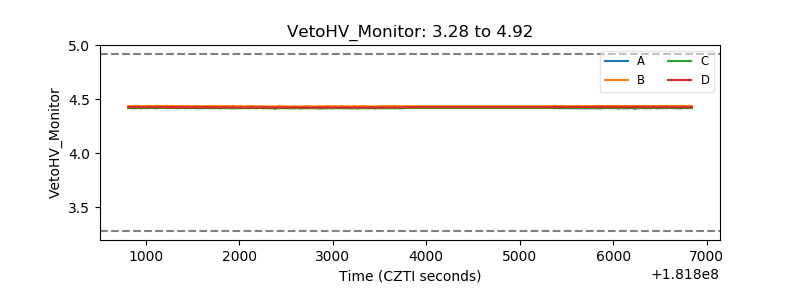 |
| Veto LLD |  |
| Alpha Counter |  |
| _CPM_Rate | 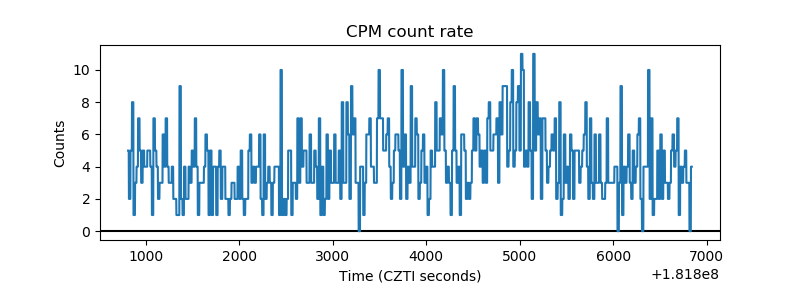 |
| CZT Counter | 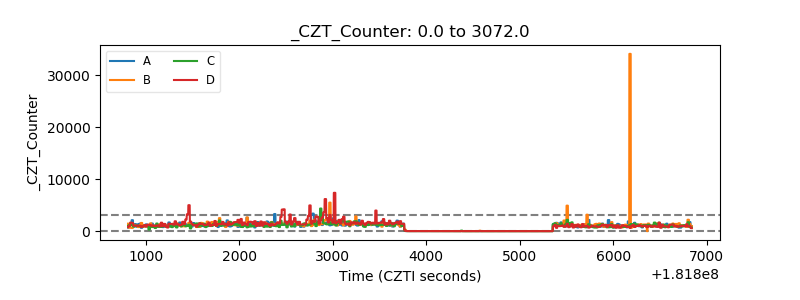 |
| +2.5 Volts monitor |  |
| +5 Volts monitor |  |
| _ROLL_ROT | 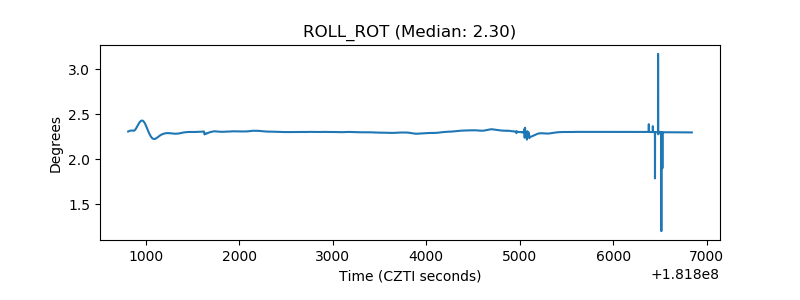 |
| _Roll_DEC | 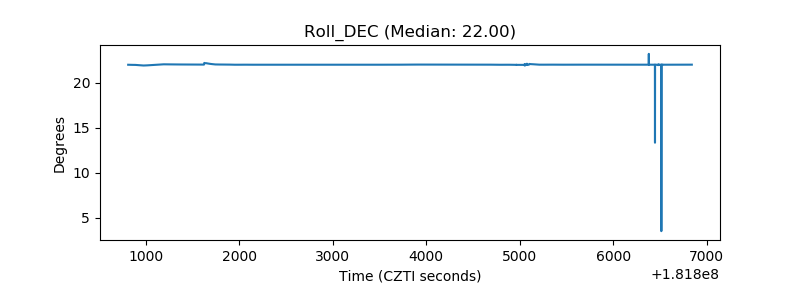 |
| _Roll_RA | 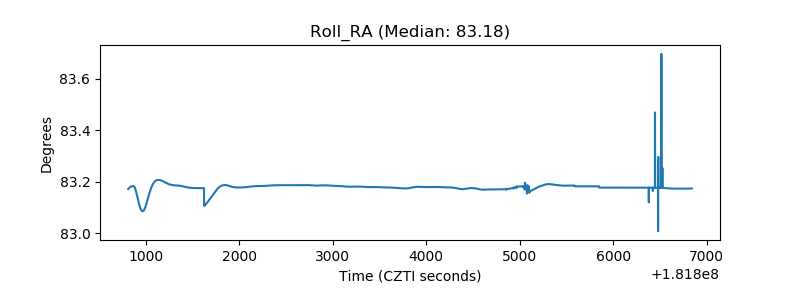 |
| Veto Counter | 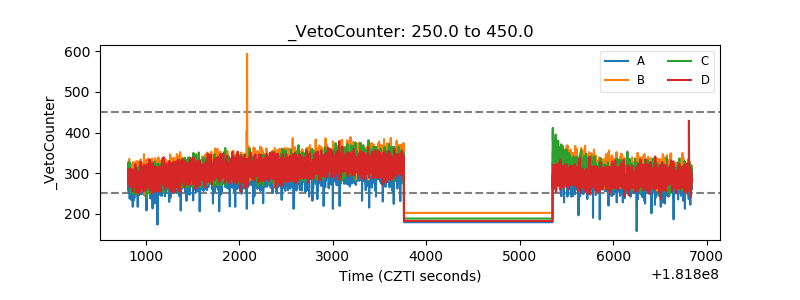 |