| Param | Original file | Final file |
|---|---|---|
| Filename | modeM0/AS1P01_003T01_9000000002_00121cztM0_level2.evt | modeM0/AS1P01_003T01_9000000002_00121cztM0_level2_quad_clean.evt |
| Size (bytes) | 774,048,960 | 46,733,760 |
| Size | 738.2 MB | 44.6 MB |
| Events in quadrant A | 5,743,324 | 277,717 |
| Events in quadrant B | 5,564,419 | 283,162 |
| Events in quadrant C | 5,270,317 | 278,364 |
| Events in quadrant D | 6,570,152 | 264,085 |
| Mode SS | |||
|---|---|---|---|
| Quadrant | BADHDUFLAG | Total packets | Discarded packets |
| A | 0 | 108 | 16 |
| B | 0 | 107 | 13 |
| C | 0 | 106 | 14 |
| D | 0 | 107 | 17 |
| Mode M9 | |||
|---|---|---|---|
| Quadrant | BADHDUFLAG | Total packets | Discarded packets |
| A | 0 | 16 | 0 |
| B | 0 | 16 | 0 |
| C | 0 | 17 | 1 |
| D | 0 | 17 | 1 |
| Mode M0 | |||
|---|---|---|---|
| Quadrant | BADHDUFLAG | Total packets | Discarded packets |
| A | 0 | 23648 | 3423 |
| B | 0 | 23222 | 3592 |
| C | 0 | 22194 | 3419 |
| D | 0 | 26091 | 3439 |
| Quadrant | Total seconds | Saturated seconds | Saturation percentage |
|---|---|---|---|
| A | 4449 | 6 | 0.134862% |
| B | 4408 | 9 | 0.204174% |
| C | 4403 | 11 | 0.249830% |
| D | 4412 | 220 | 4.986401% |
Noise dominated data is calculated using 1-second bins in cleaned event files. If a bin has >2000 counts, and if more than 50% of those come from <1% of pixels, then it is considered to be noise-dominated and hence unusable.
| Quadrant | # 1 sec bins | Bins with >0 counts | Bins with >2000 counts | High rate bins dominated by noise | Noise dominated (total time) | Noise dominated (detector-on time) | Marked lightcurve |
|---|---|---|---|---|---|---|---|
| A | 6685 | 4580 | 161 | 161 | 2.41% | 3.52% | 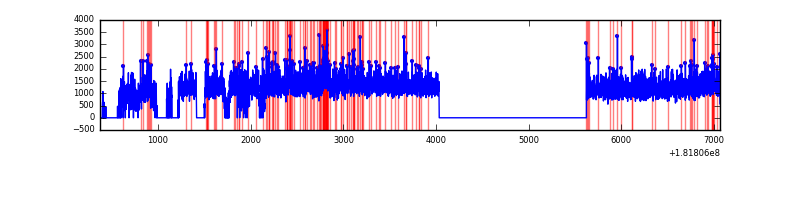 |
| B | 6691 | 4554 | 90 | 90 | 1.35% | 1.98% | 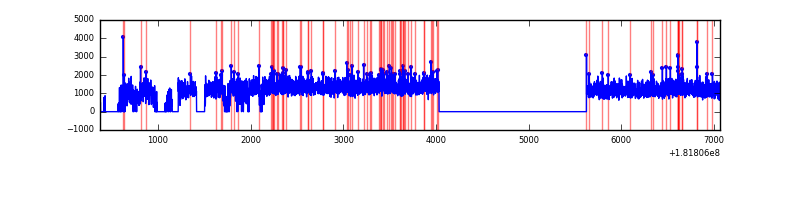 |
| C | 6664 | 4551 | 107 | 107 | 1.61% | 2.35% | 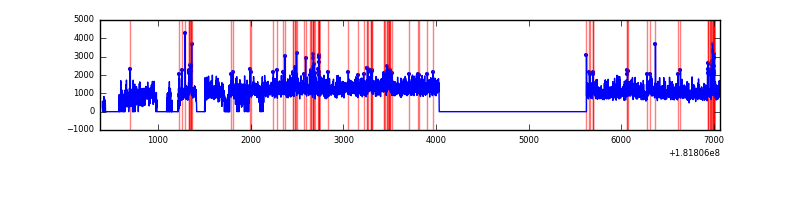 |
| D | 6677 | 4567 | 564 | 564 | 8.45% | 12.35% | 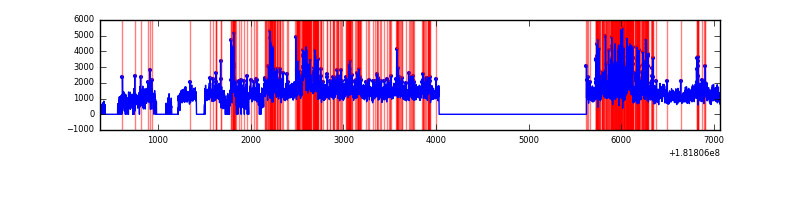 |
Top three noisy pixels from each quadrant. If the there are fewer than three noisy pixels in the level2.evt file, extra rows are filled as -1
| Pixel properties | Quadrant properties | ||||||
|---|---|---|---|---|---|---|---|
| Quadrant | DetID | PixID | Counts | Sigma | Mean | Median | Sigma |
| A | 13 | 174 | 70051 | 296.23 | 1407 | 1374 | 231.8 |
| A | 13 | 65 | 51919 | 218.02 | 1407 | 1374 | 231.8 |
| A | 15 | 94 | 35278 | 146.24 | 1407 | 1374 | 231.8 |
| B | 0 | 169 | 40549 | 145.8 | 1380 | 1366 | 268.8 |
| B | 0 | 236 | 22783 | 79.69 | 1380 | 1366 | 268.8 |
| B | 4 | 238 | 21989 | 76.74 | 1380 | 1366 | 268.8 |
| C | 8 | 224 | 215580 | 614.53 | 1233 | 1279 | 348.7 |
| C | 0 | 203 | 58188 | 163.19 | 1233 | 1279 | 348.7 |
| C | 9 | 230 | 47533 | 132.64 | 1233 | 1279 | 348.7 |
| D | 12 | 207 | 585887 | 1719.15 | 1293 | 1302 | 340.0 |
| D | 2 | 107 | 158591 | 462.55 | 1293 | 1302 | 340.0 |
| D | 10 | 82 | 134866 | 392.78 | 1293 | 1302 | 340.0 |
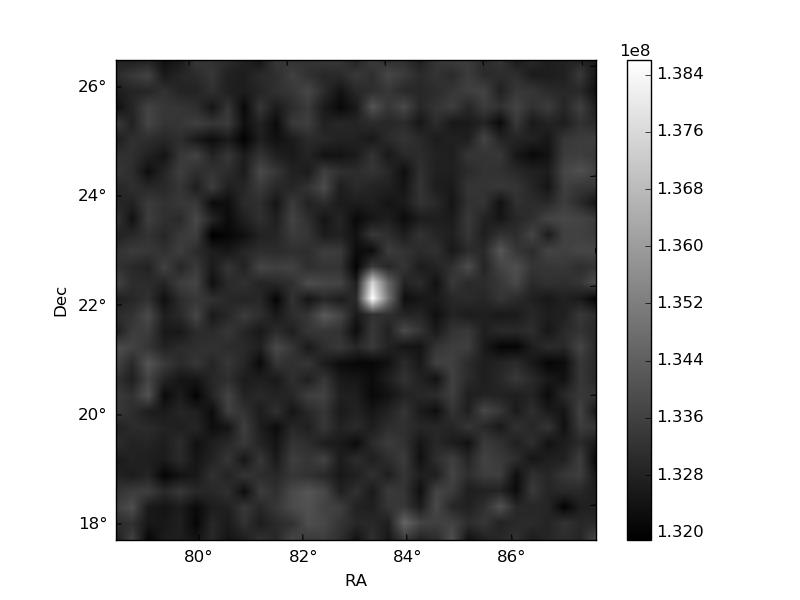
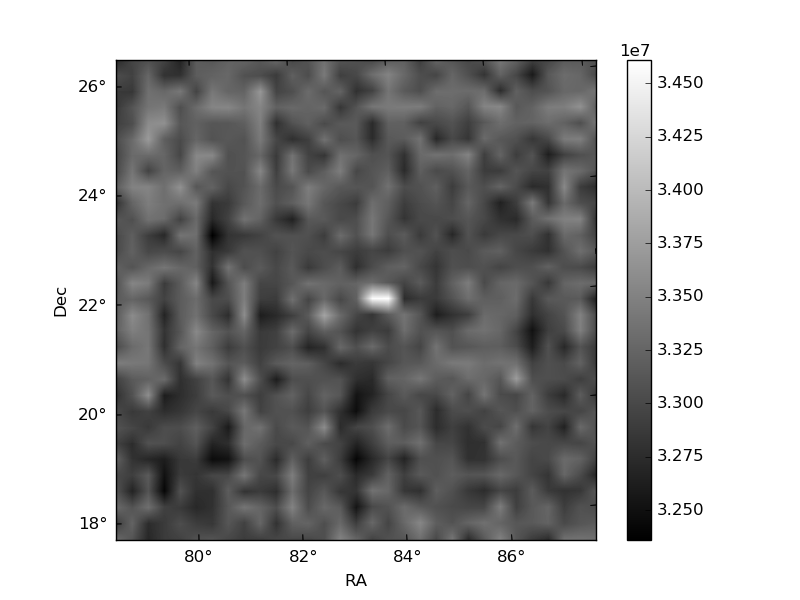
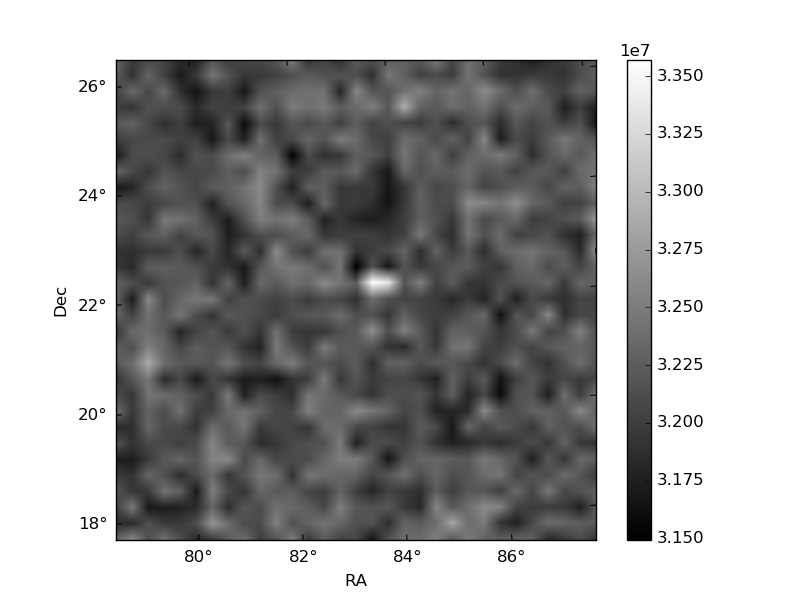
Histogram calculated using DETX and DETY for each event in the final _common_clean file
| Quadrant A | 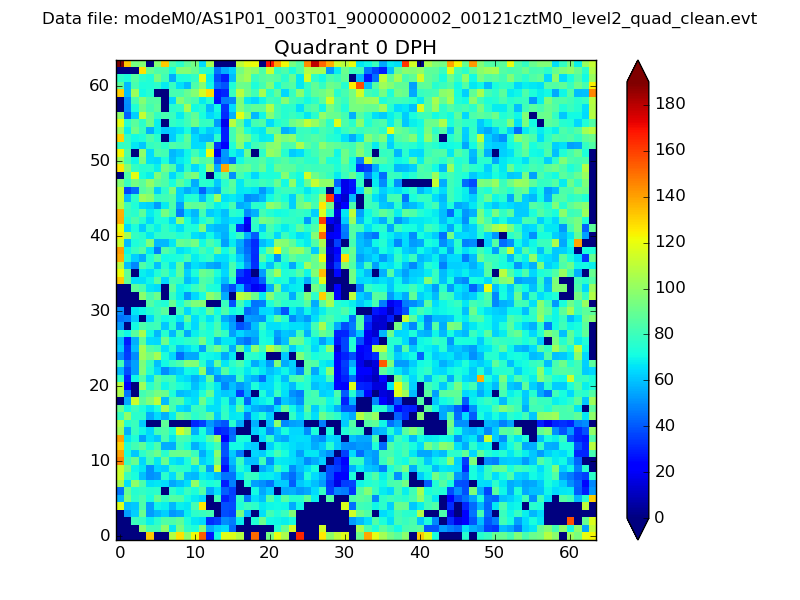 |
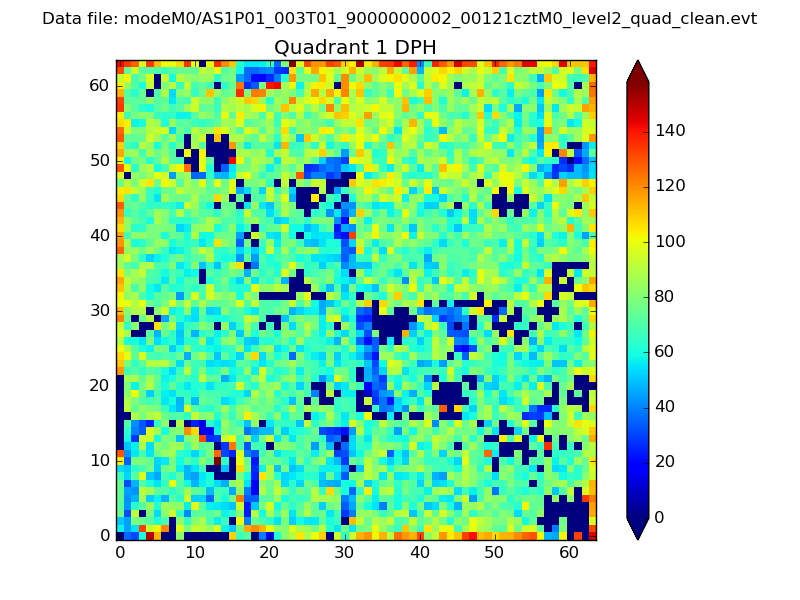 |
Quadrant B |
|---|---|---|---|
| Quadrant D |  |
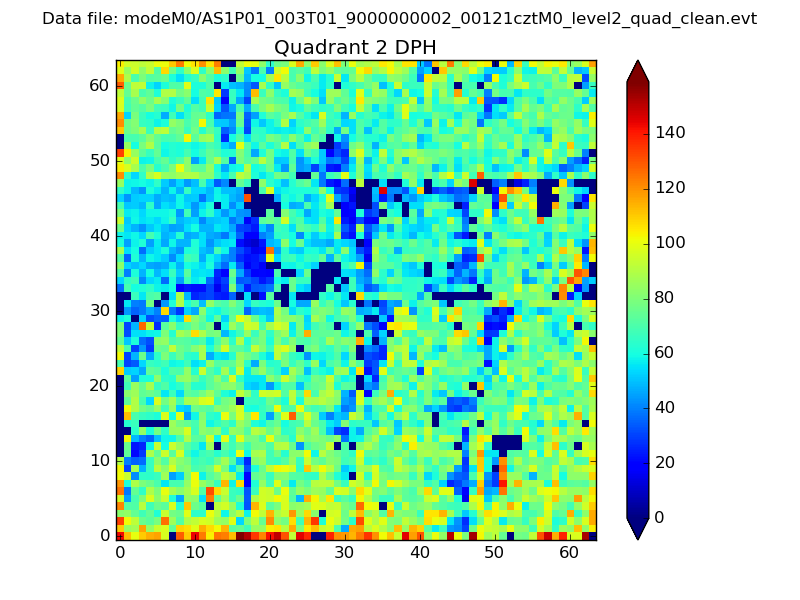 |
Quadrant C |
| Plot type | Count rate plots | Images |
|---|---|---|
| Comparison with Poisson distribution Blue bars denote a histogram of data divided into 1 sec bins. Red curve is a Poisson curve with rate = median count rate of data. |
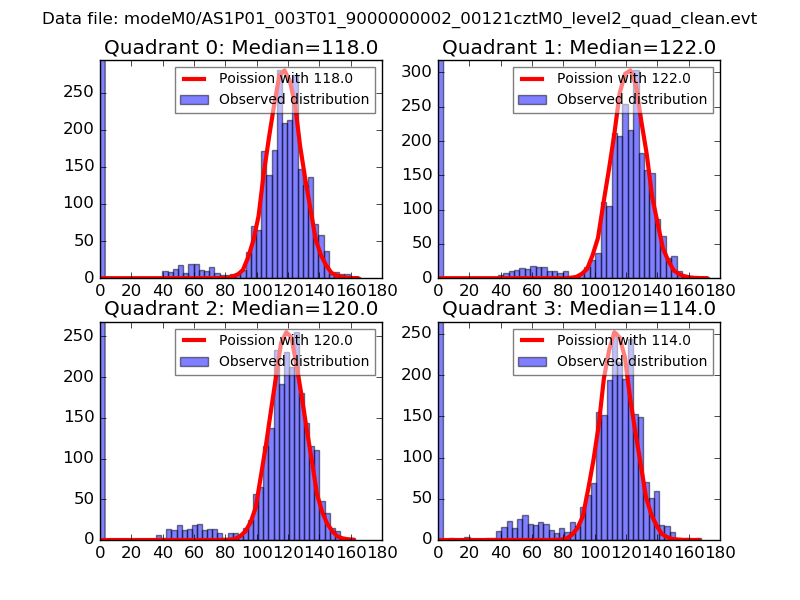 |
 |
| Quadrant-wise count rates Data is divided into 100 sec bins |
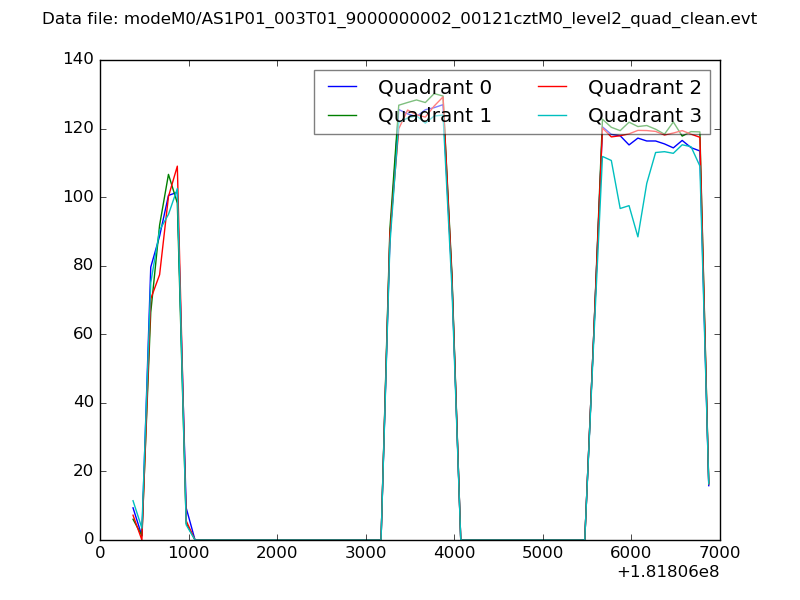 |
|
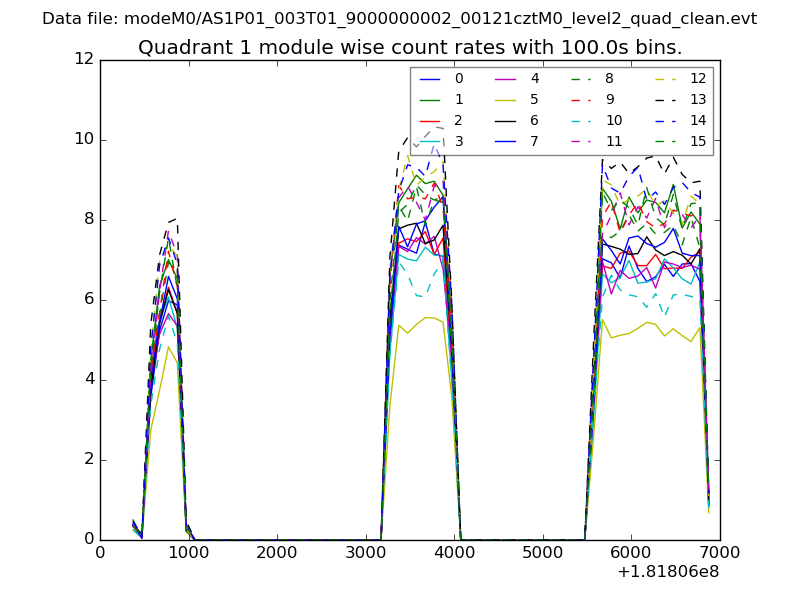
| Module-wise count rates for Quadrant A Data is divided into 100 sec bins |
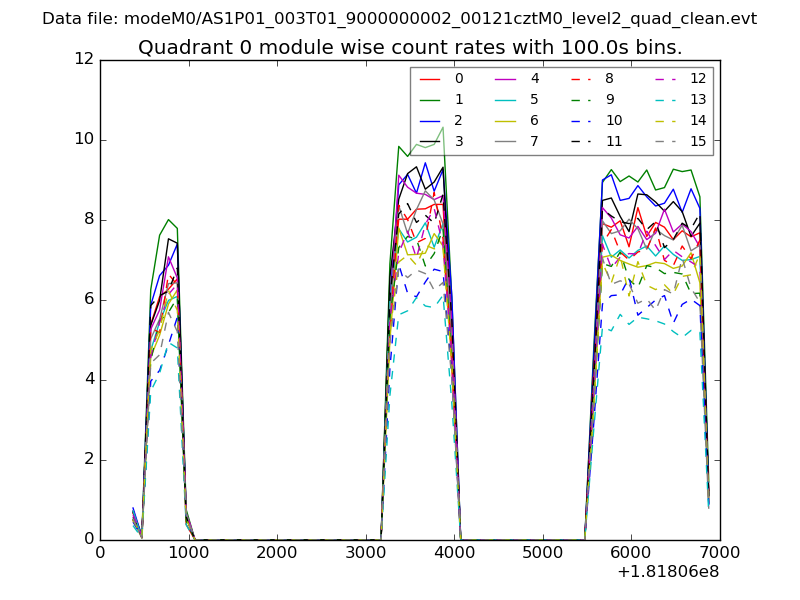 |
 |
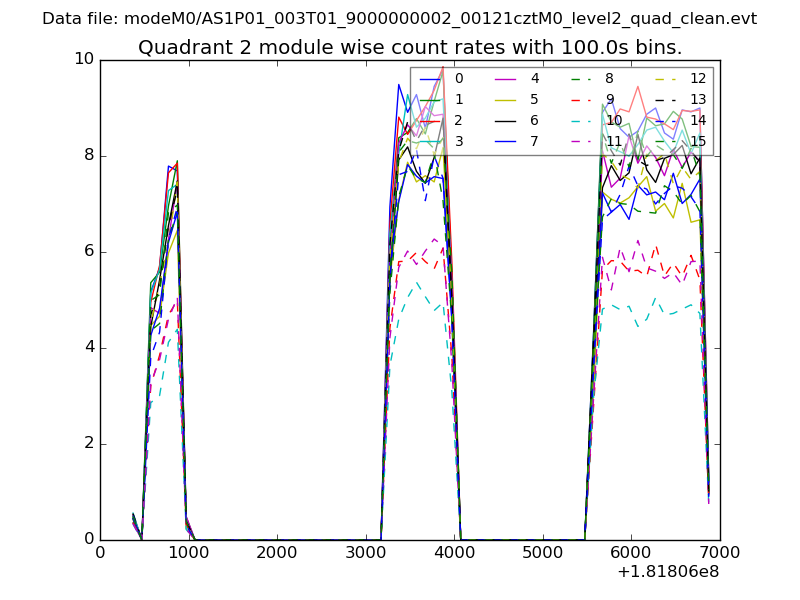
| Module-wise count rates for Quadrant B Data is divided into 100 sec bins |
 |
 |
| Module-wise count rates for Quadrant C Data is divided into 100 sec bins |
 |
 |
| Module-wise count rates for Quadrant D Data is divided into 100 sec bins |
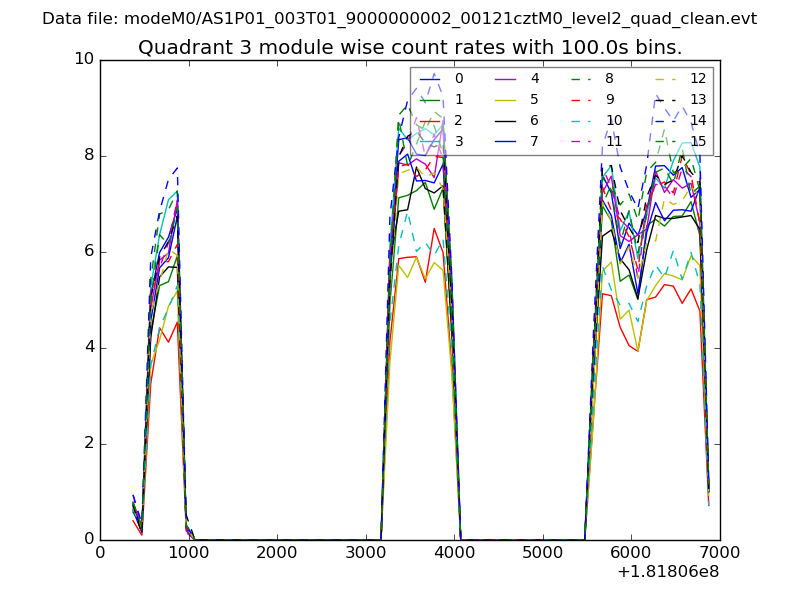 |
 |
| Parameter | Plot |
|---|---|
| CZT HV Monitor | 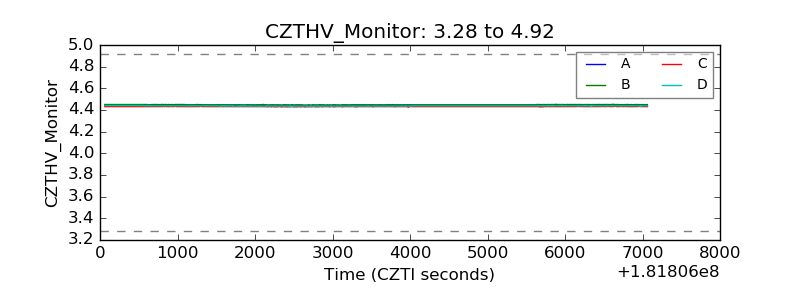 |
| D_VDD | 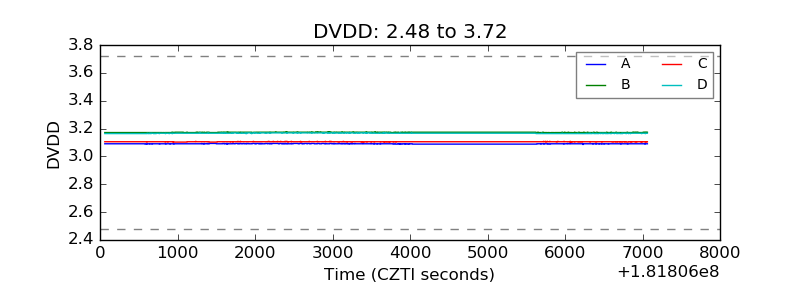 |
| Temperature 1 | 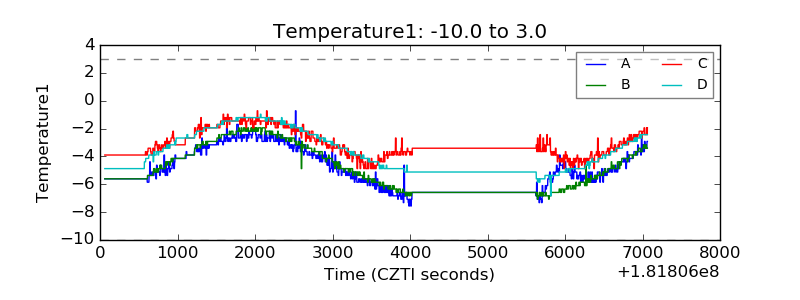 |
| Veto HV Monitor |  |
| Veto LLD | 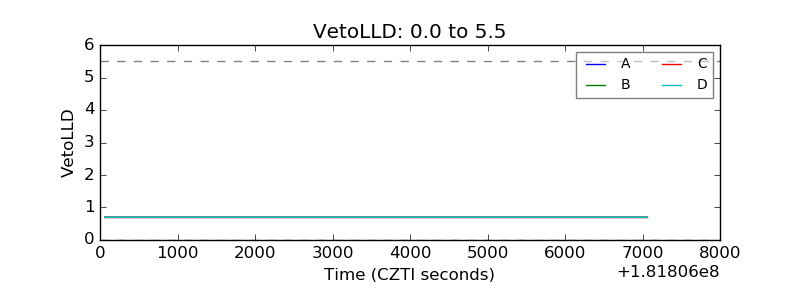 |
| Alpha Counter | 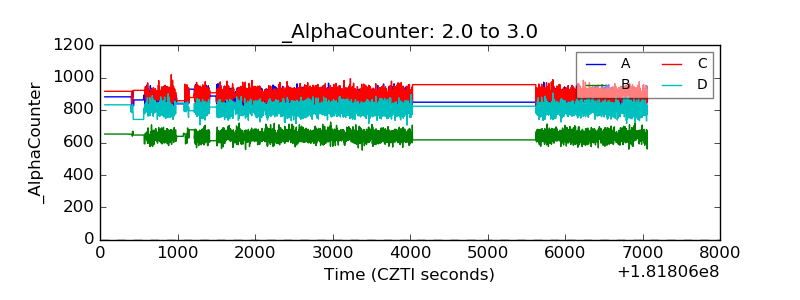 |
| _CPM_Rate | 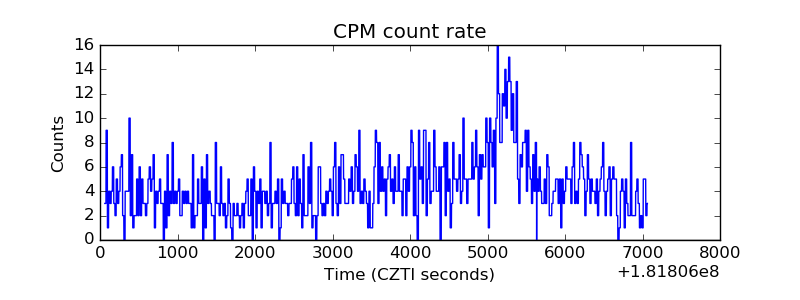 |
| CZT Counter | 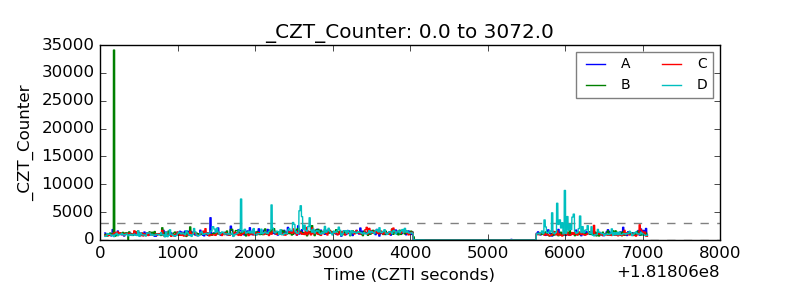 |
| +2.5 Volts monitor | 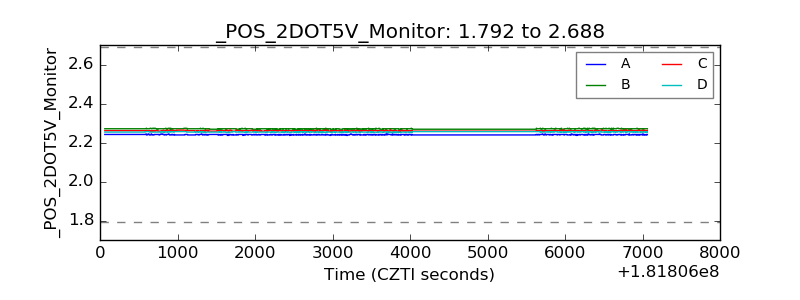 |
| +5 Volts monitor |  |
| _ROLL_ROT | 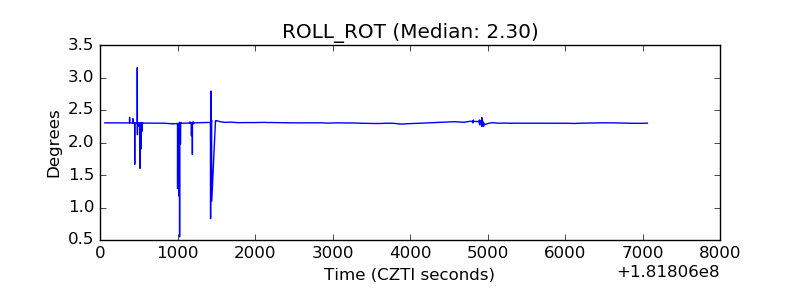 |
| _Roll_DEC | 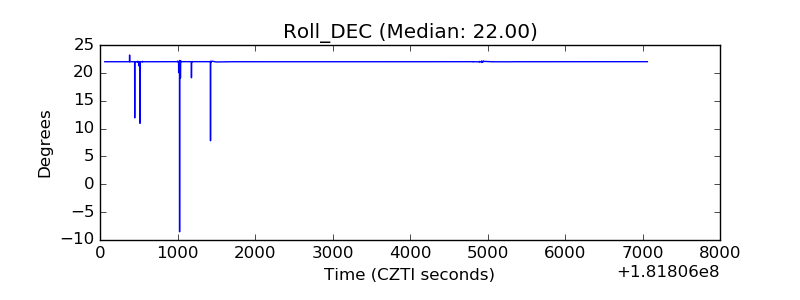 |
| _Roll_RA | 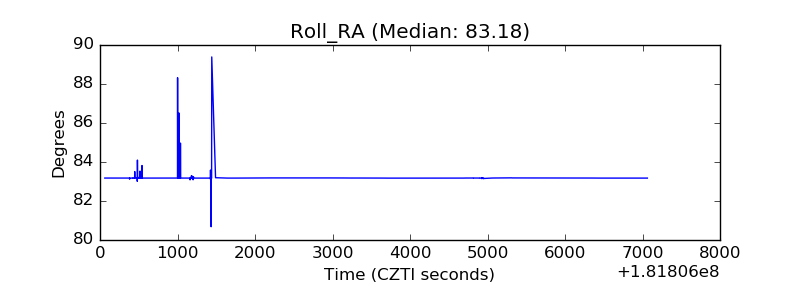 |
| Veto Counter | 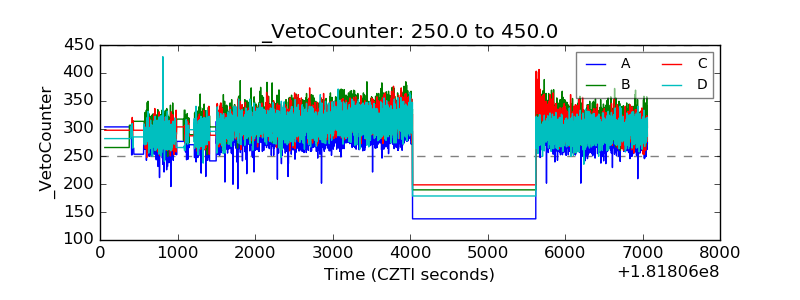 |