| Param | Original file | Final file |
|---|---|---|
| Filename | modeM0/AS1P01_003T01_9000000002_00123cztM0_level2.evt | modeM0/AS1P01_003T01_9000000002_00123cztM0_level2_quad_clean.evt |
| Size (bytes) | 1,048,841,280 | 50,287,680 |
| Size | 1000.3 MB | 48.0 MB |
| Events in quadrant A | 7,261,246 | 285,624 |
| Events in quadrant B | 7,625,959 | 291,890 |
| Events in quadrant C | 8,474,406 | 273,265 |
| Events in quadrant D | 8,029,758 | 276,122 |
| Mode SS | |||
|---|---|---|---|
| Quadrant | BADHDUFLAG | Total packets | Discarded packets |
| A | 0 | 114 | 0 |
| B | 0 | 114 | 0 |
| C | 0 | 114 | 0 |
| D | 0 | 114 | 0 |
| Mode M9 | |||
|---|---|---|---|
| Quadrant | BADHDUFLAG | Total packets | Discarded packets |
| A | 0 | 16 | 0 |
| B | 0 | 16 | 0 |
| C | 0 | 16 | 0 |
| D | 0 | 16 | 0 |
| Mode M0 | |||
|---|---|---|---|
| Quadrant | BADHDUFLAG | Total packets | Discarded packets |
| A | 0 | 25540 | 2 |
| B | 0 | 26668 | 1 |
| C | 0 | 29202 | 1 |
| D | 0 | 27809 | 1 |
| Quadrant | Total seconds | Saturated seconds | Saturation percentage |
|---|---|---|---|
| A | 5654 | 5 | 0.088433% |
| B | 5654 | 6 | 0.106120% |
| C | 5654 | 228 | 4.032543% |
| D | 5654 | 107 | 1.892466% |
Noise dominated data is calculated using 1-second bins in cleaned event files. If a bin has >2000 counts, and if more than 50% of those come from <1% of pixels, then it is considered to be noise-dominated and hence unusable.
| Quadrant | # 1 sec bins | Bins with >0 counts | Bins with >2000 counts | High rate bins dominated by noise | Noise dominated (total time) | Noise dominated (detector-on time) | Marked lightcurve |
|---|---|---|---|---|---|---|---|
| A | 7277 | 5656 | 211 | 211 | 2.90% | 3.73% | 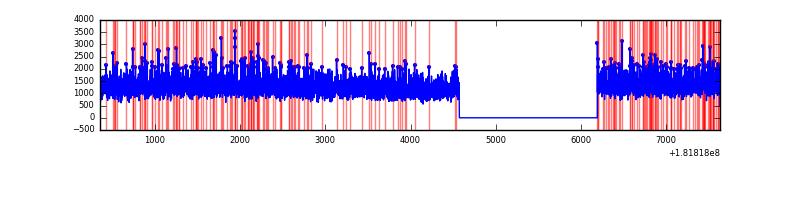 |
| B | 7277 | 5656 | 259 | 259 | 3.56% | 4.58% | 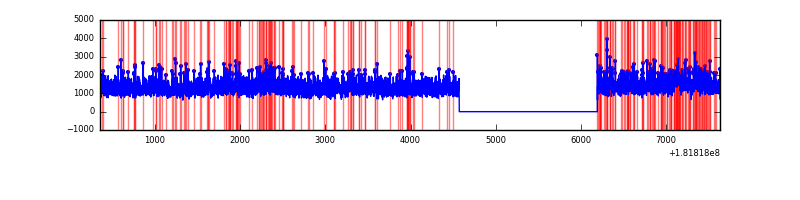 |
| C | 7277 | 5656 | 979 | 979 | 13.45% | 17.31% |  |
| D | 7277 | 5656 | 477 | 477 | 6.55% | 8.43% | 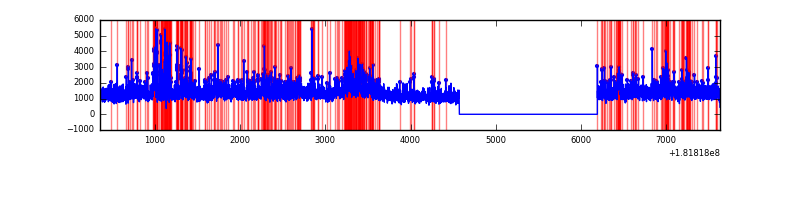 |
Top three noisy pixels from each quadrant. If the there are fewer than three noisy pixels in the level2.evt file, extra rows are filled as -1
| Pixel properties | Quadrant properties | ||||||
|---|---|---|---|---|---|---|---|
| Quadrant | DetID | PixID | Counts | Sigma | Mean | Median | Sigma |
| A | 13 | 1 | 22409 | 67.35 | 1830 | 1785 | 306.2 |
| A | 13 | 174 | 18602 | 54.92 | 1830 | 1785 | 306.2 |
| A | 0 | 166 | 17916 | 52.68 | 1830 | 1785 | 306.2 |
| B | 0 | 235 | 403563 | 1131.03 | 1808 | 1784 | 355.2 |
| B | 5 | 216 | 35770 | 95.67 | 1808 | 1784 | 355.2 |
| B | 4 | 238 | 35135 | 93.89 | 1808 | 1784 | 355.2 |
| C | 9 | 204 | 1238913 | 2721.45 | 1615 | 1675 | 454.6 |
| C | 8 | 224 | 692091 | 1518.65 | 1615 | 1675 | 454.6 |
| C | 9 | 185 | 38447 | 80.88 | 1615 | 1675 | 454.6 |
| D | 12 | 207 | 310464 | 670.06 | 1726 | 1738 | 460.7 |
| D | 1 | 55 | 199275 | 428.73 | 1726 | 1738 | 460.7 |
| D | 5 | 35 | 123618 | 264.53 | 1726 | 1738 | 460.7 |
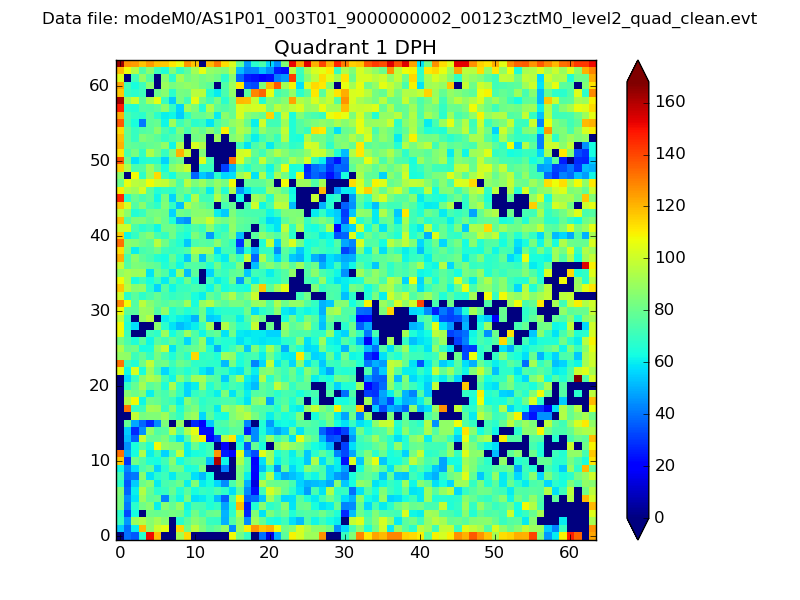
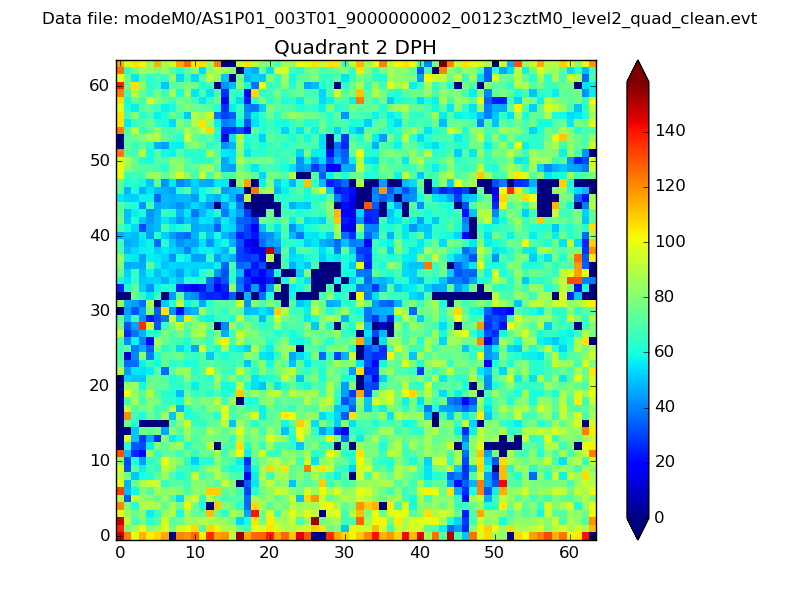
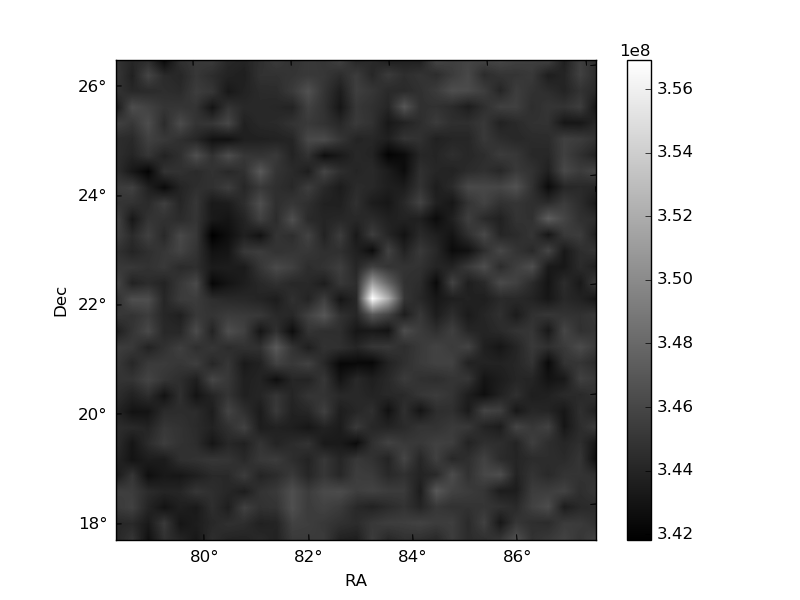
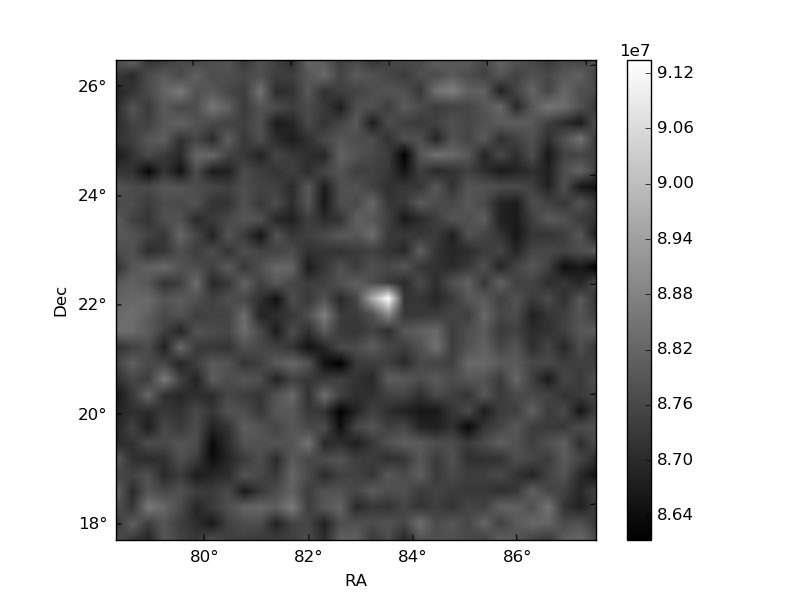
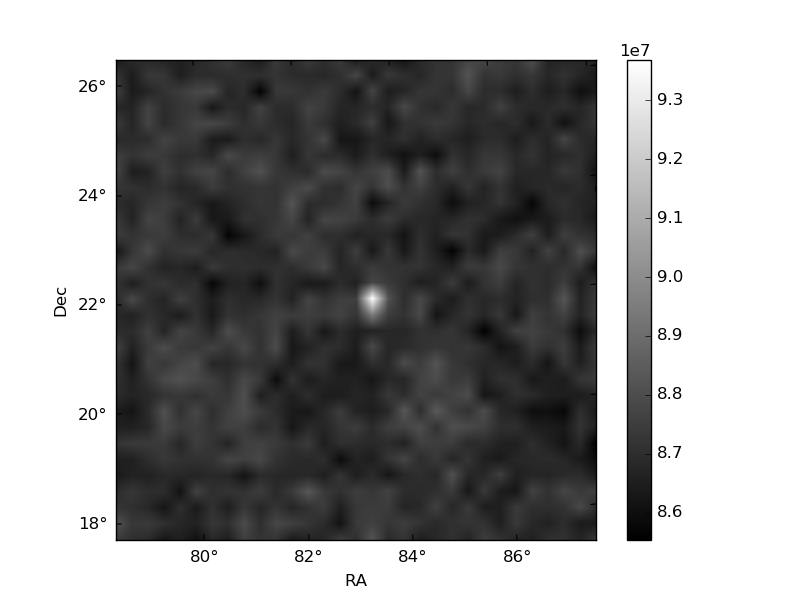
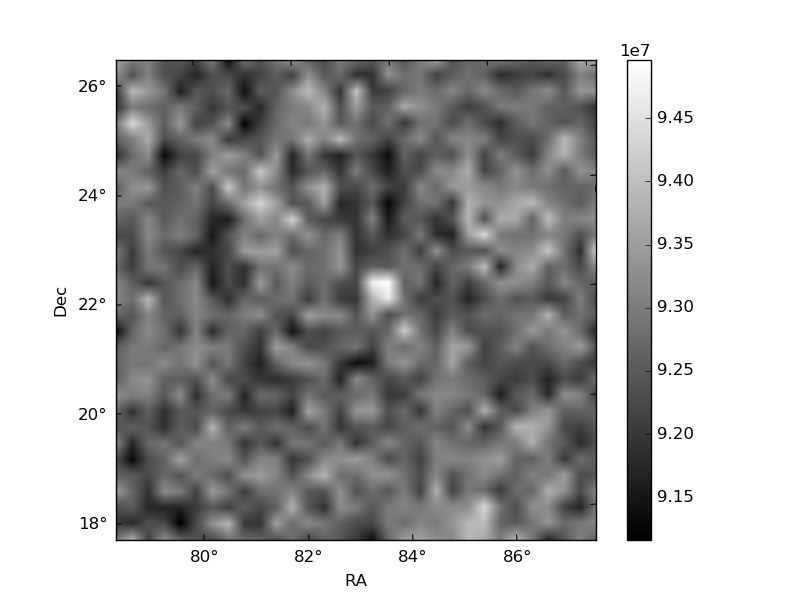
Histogram calculated using DETX and DETY for each event in the final _common_clean file
| Quadrant A | 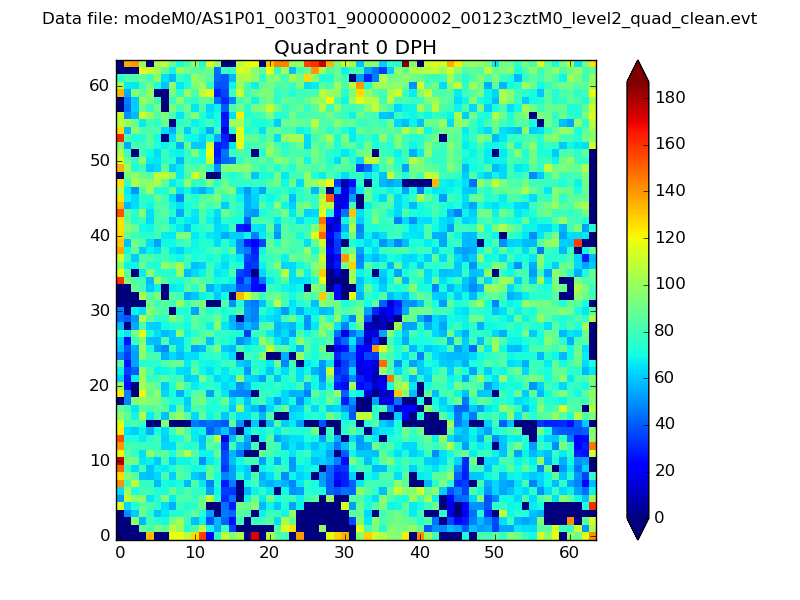 |
 |
Quadrant B |
|---|---|---|---|
| Quadrant D | 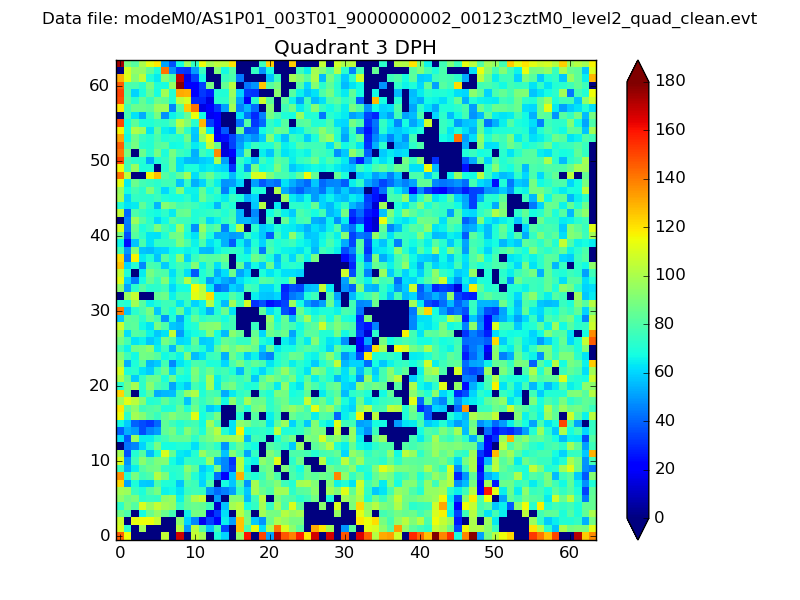 |
 |
Quadrant C |
| Plot type | Count rate plots | Images |
|---|---|---|
| Comparison with Poisson distribution Blue bars denote a histogram of data divided into 1 sec bins. Red curve is a Poisson curve with rate = median count rate of data. |
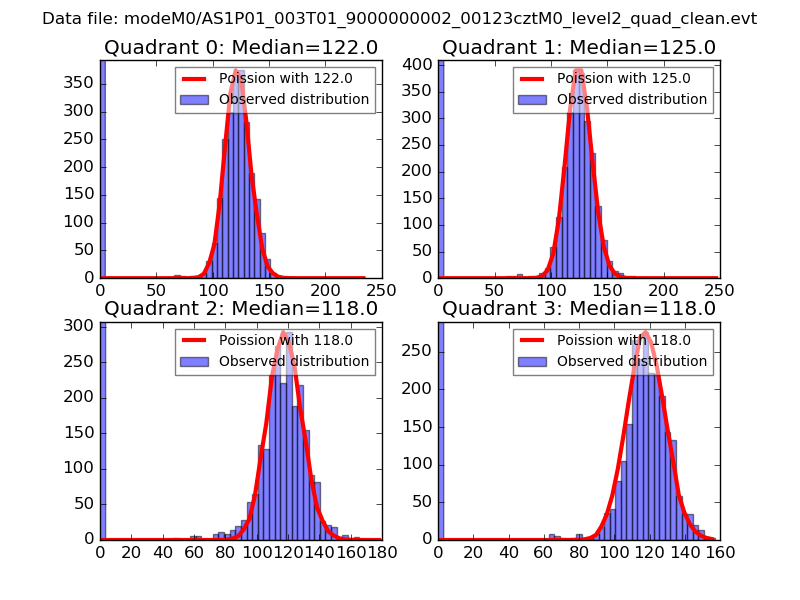 |
 |
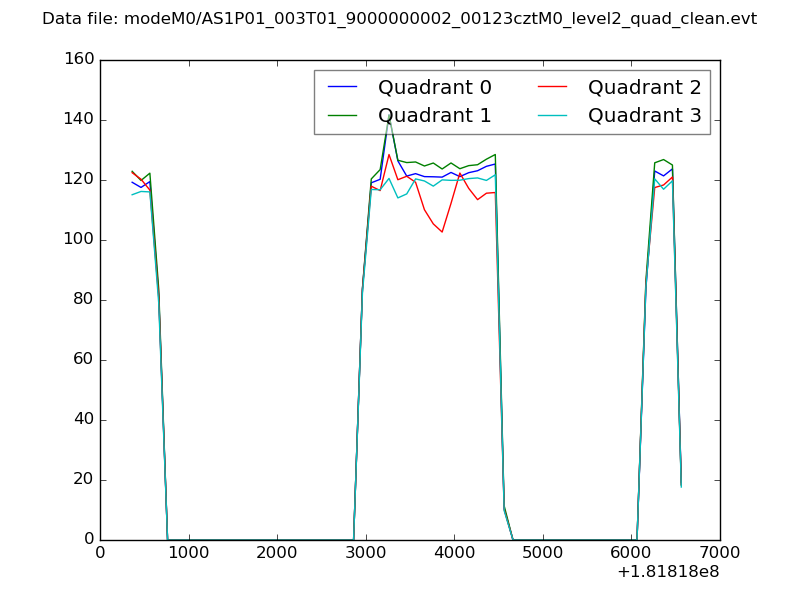
| Quadrant-wise count rates Data is divided into 100 sec bins |
 |
|
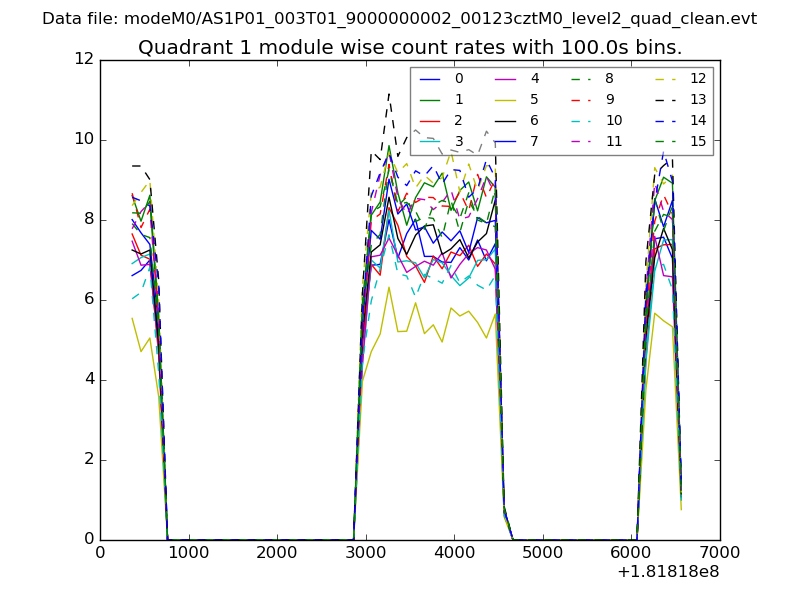
| Module-wise count rates for Quadrant A Data is divided into 100 sec bins |
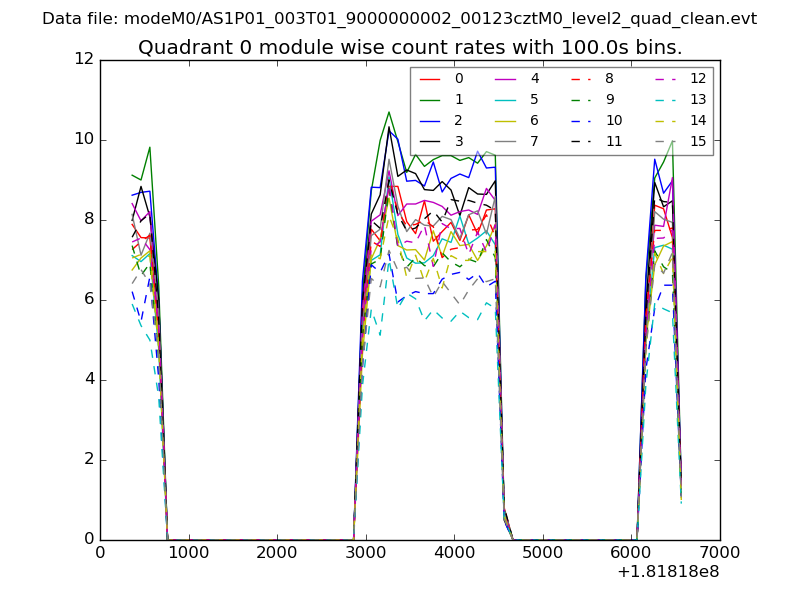 |
 |
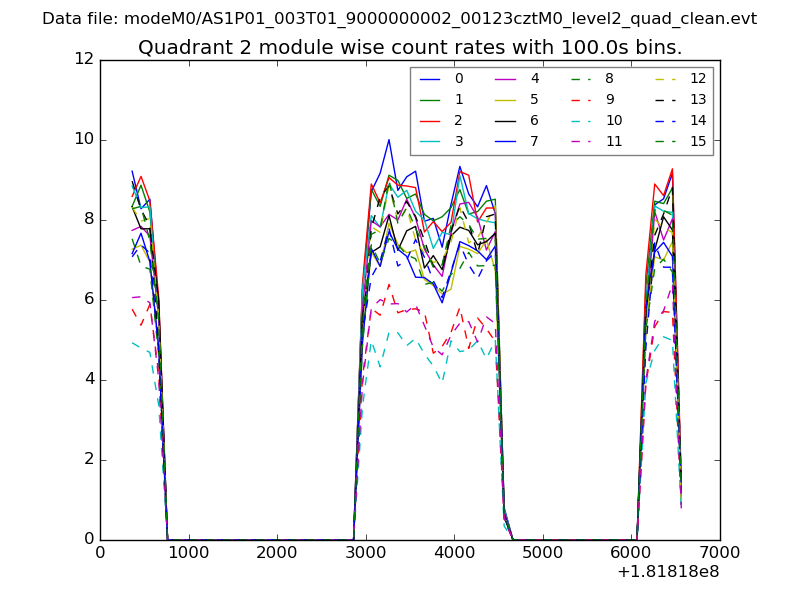
| Module-wise count rates for Quadrant B Data is divided into 100 sec bins |
 |
 |
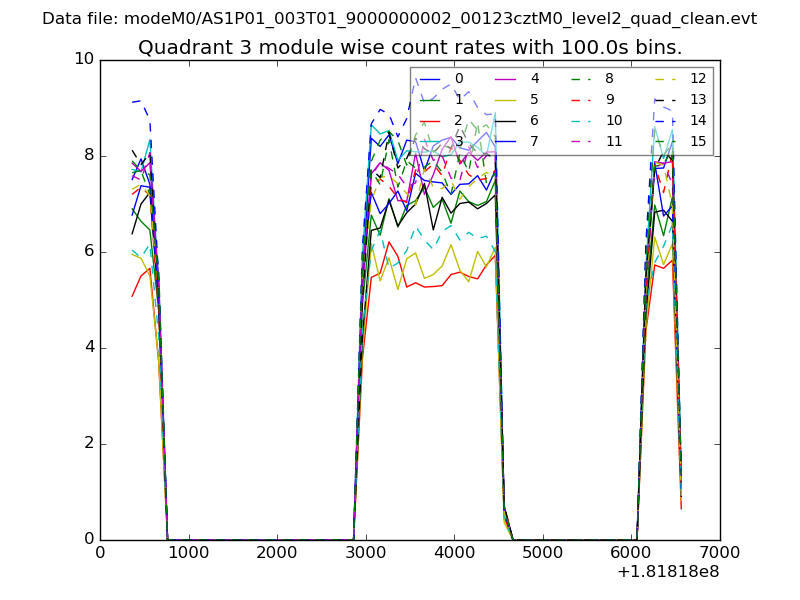
| Module-wise count rates for Quadrant C Data is divided into 100 sec bins |
 |
 |
| Module-wise count rates for Quadrant D Data is divided into 100 sec bins |
 |
 |
| Parameter | Plot |
|---|---|
| CZT HV Monitor | 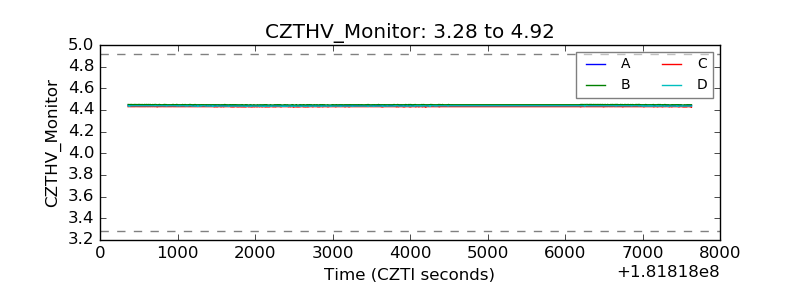 |
| D_VDD | 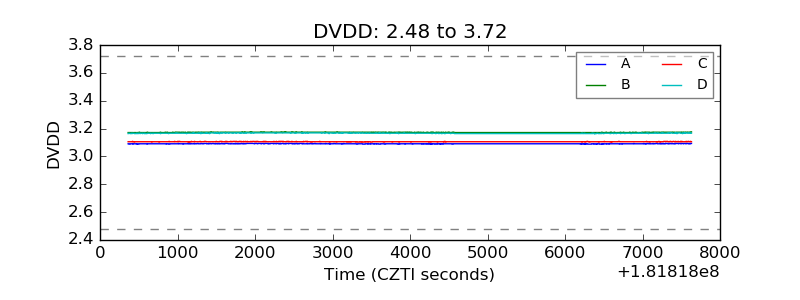 |
| Temperature 1 | 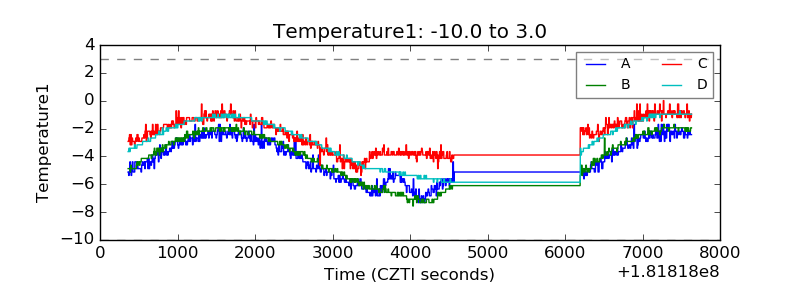 |
| Veto HV Monitor | 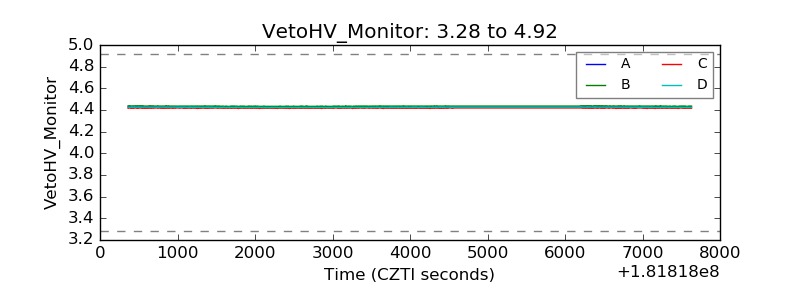 |
| Veto LLD | 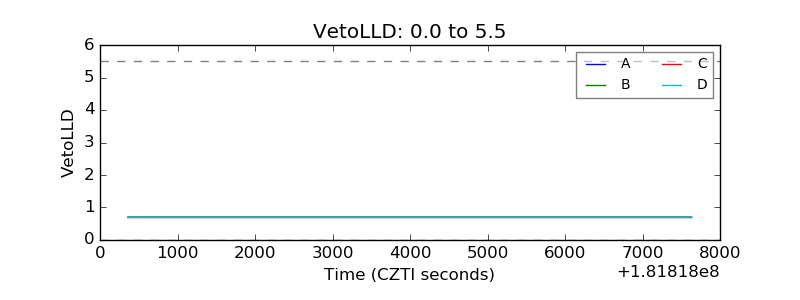 |
| Alpha Counter | 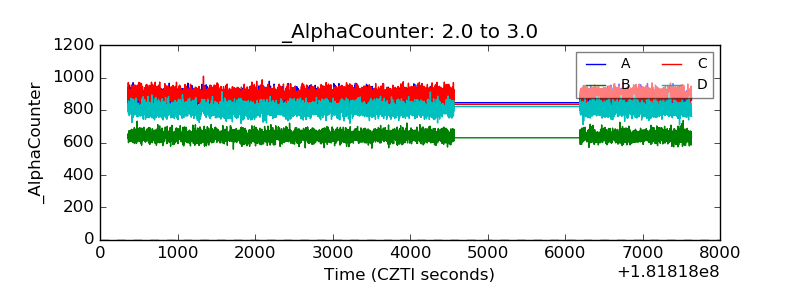 |
| _CPM_Rate | 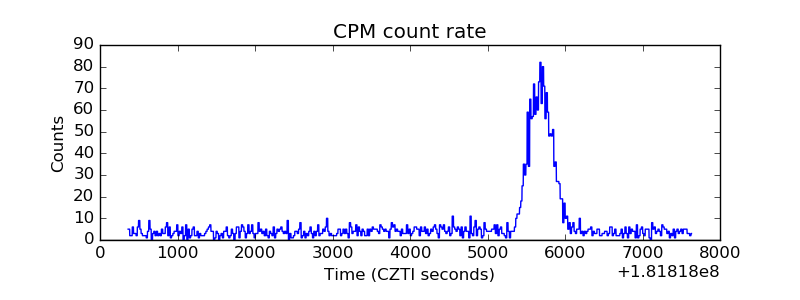 |
| CZT Counter | 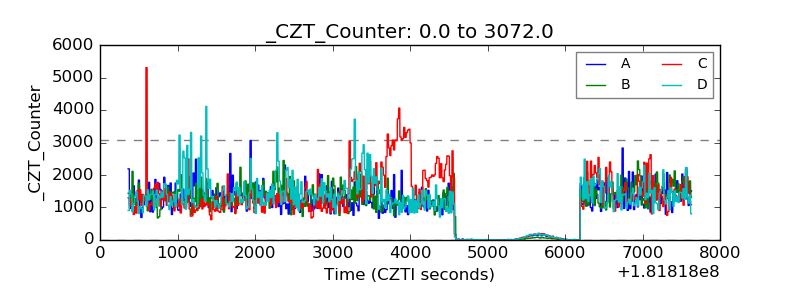 |
| +2.5 Volts monitor |  |
| +5 Volts monitor |  |
| _ROLL_ROT | 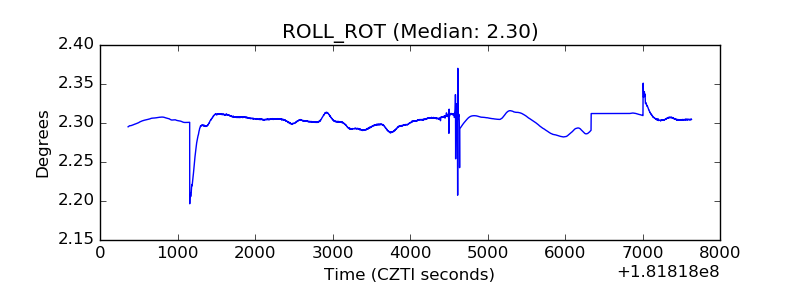 |
| _Roll_DEC | 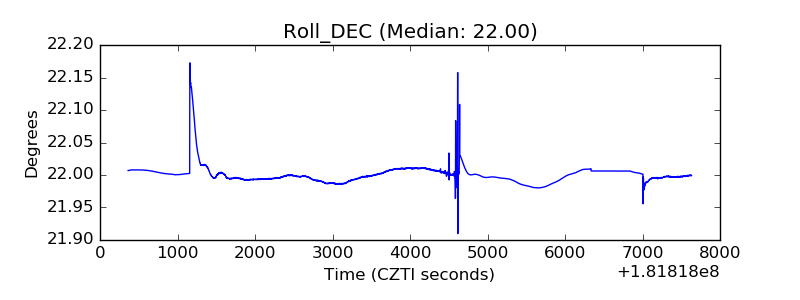 |
| _Roll_RA | 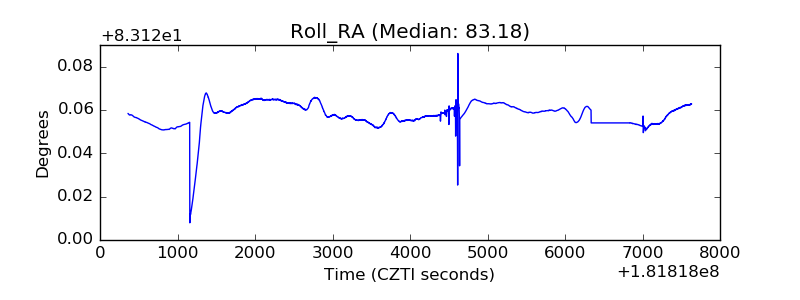 |
| Veto Counter | 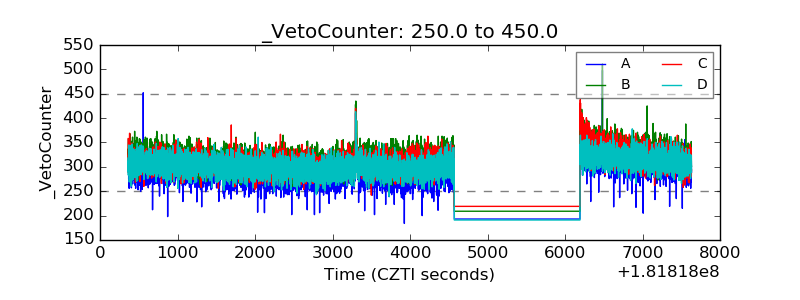 |