| Param | Original file | Final file |
|---|---|---|
| Filename | modeM0/AS1P01_003T01_9000000002_00128cztM0_level2.evt | modeM0/AS1P01_003T01_9000000002_00128cztM0_level2_quad_clean.evt |
| Size (bytes) | 954,054,720 | 71,576,640 |
| Size | 909.9 MB | 68.3 MB |
| Events in quadrant A | 6,970,321 | 443,359 |
| Events in quadrant B | 7,214,906 | 453,240 |
| Events in quadrant C | 6,542,222 | 447,303 |
| Events in quadrant D | 7,798,858 | 435,060 |
| Mode SS | |||
|---|---|---|---|
| Quadrant | BADHDUFLAG | Total packets | Discarded packets |
| A | 0 | 112 | 0 |
| B | 0 | 112 | 0 |
| C | 0 | 112 | 0 |
| D | 0 | 112 | 0 |
| Mode M9 | |||
|---|---|---|---|
| Quadrant | BADHDUFLAG | Total packets | Discarded packets |
| A | 0 | 17 | 0 |
| B | 0 | 17 | 0 |
| C | 0 | 17 | 0 |
| D | 0 | 17 | 0 |
| Mode M0 | |||
|---|---|---|---|
| Quadrant | BADHDUFLAG | Total packets | Discarded packets |
| A | 0 | 24641 | 2 |
| B | 0 | 25374 | 1 |
| C | 0 | 23380 | 1 |
| D | 0 | 27106 | 1 |
| Quadrant | Total seconds | Saturated seconds | Saturation percentage |
|---|---|---|---|
| A | 5552 | 5 | 0.090058% |
| B | 5552 | 30 | 0.540346% |
| C | 5552 | 4 | 0.072046% |
| D | 5552 | 93 | 1.675072% |
Noise dominated data is calculated using 1-second bins in cleaned event files. If a bin has >2000 counts, and if more than 50% of those come from <1% of pixels, then it is considered to be noise-dominated and hence unusable.
| Quadrant | # 1 sec bins | Bins with >0 counts | Bins with >2000 counts | High rate bins dominated by noise | Noise dominated (total time) | Noise dominated (detector-on time) | Marked lightcurve |
|---|---|---|---|---|---|---|---|
| A | 7174 | 5554 | 209 | 209 | 2.91% | 3.76% | 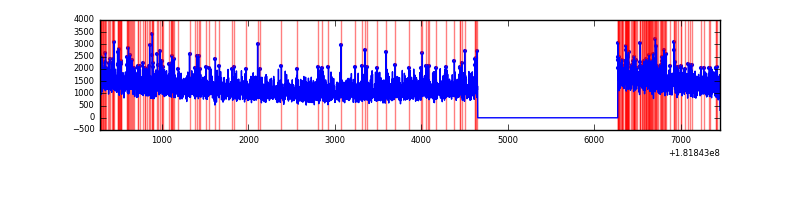 |
| B | 7174 | 5554 | 257 | 257 | 3.58% | 4.63% | 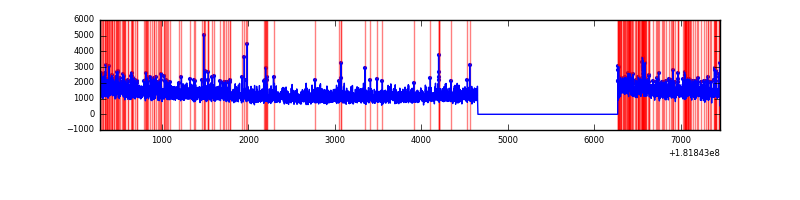 |
| C | 7174 | 5554 | 99 | 99 | 1.38% | 1.78% | 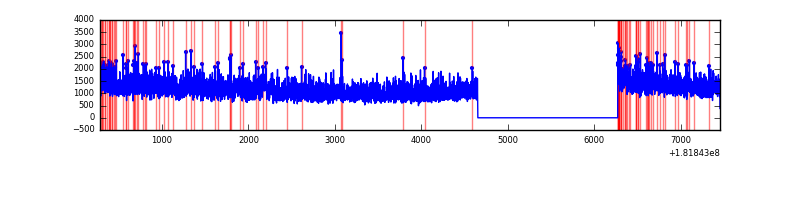 |
| D | 7174 | 5554 | 625 | 625 | 8.71% | 11.25% | 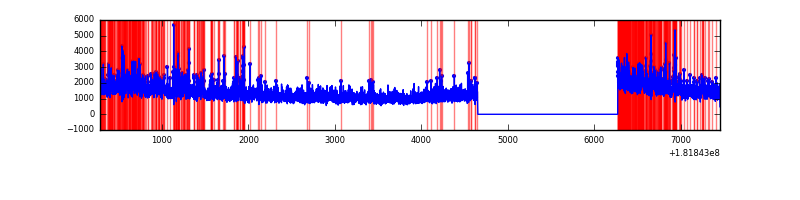 |
Top three noisy pixels from each quadrant. If the there are fewer than three noisy pixels in the level2.evt file, extra rows are filled as -1
| Pixel properties | Quadrant properties | ||||||
|---|---|---|---|---|---|---|---|
| Quadrant | DetID | PixID | Counts | Sigma | Mean | Median | Sigma |
| A | 0 | 86 | 14302 | 43.52 | 1774 | 1735 | 288.8 |
| A | 13 | 65 | 12501 | 37.28 | 1774 | 1735 | 288.8 |
| A | 13 | 239 | 9711 | 27.62 | 1774 | 1735 | 288.8 |
| B | 10 | 48 | 96115 | 240.76 | 1775 | 1781 | 391.8 |
| B | 0 | 235 | 66453 | 165.05 | 1775 | 1781 | 391.8 |
| B | 8 | 236 | 51233 | 126.21 | 1775 | 1781 | 391.8 |
| C | 10 | 254 | 84171 | 182.62 | 1628 | 1689 | 451.7 |
| C | 5 | 253 | 15323 | 30.19 | 1628 | 1689 | 451.7 |
| C | 2 | 192 | 13822 | 26.86 | 1628 | 1689 | 451.7 |
| D | 10 | 244 | 391730 | 865.07 | 1700 | 1715 | 450.8 |
| D | 13 | 207 | 137856 | 301.97 | 1700 | 1715 | 450.8 |
| D | 5 | 254 | 123335 | 269.76 | 1700 | 1715 | 450.8 |
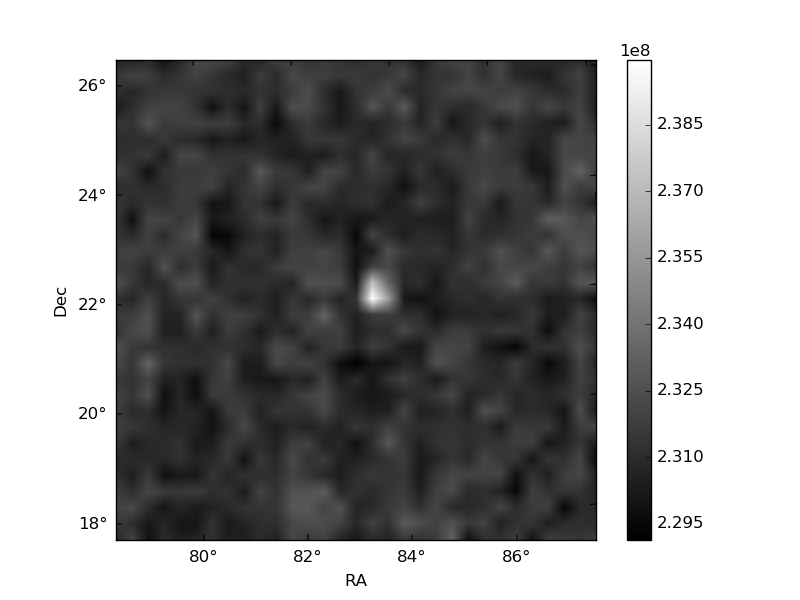
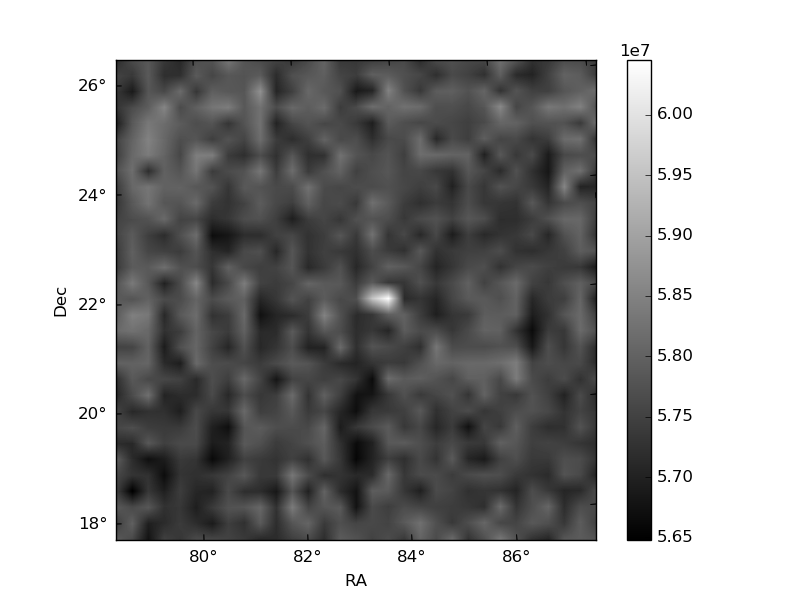
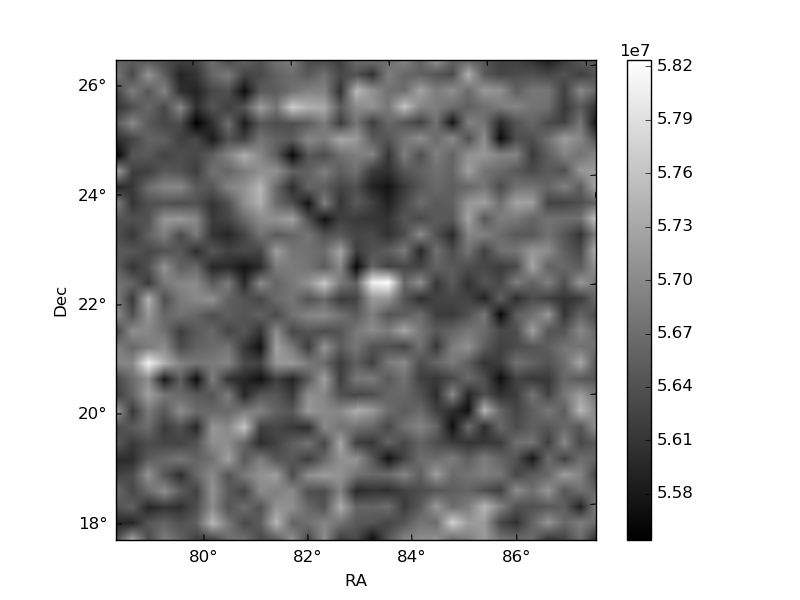
Histogram calculated using DETX and DETY for each event in the final _common_clean file
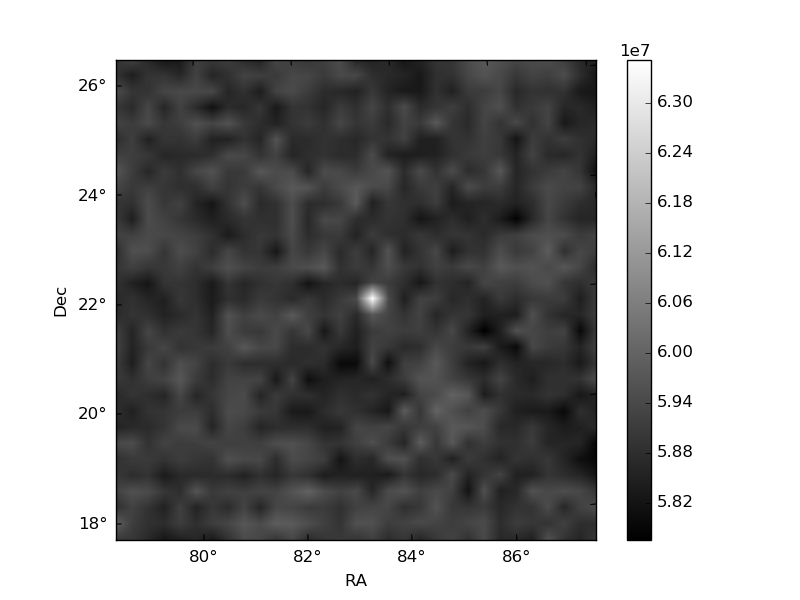
| Quadrant A | 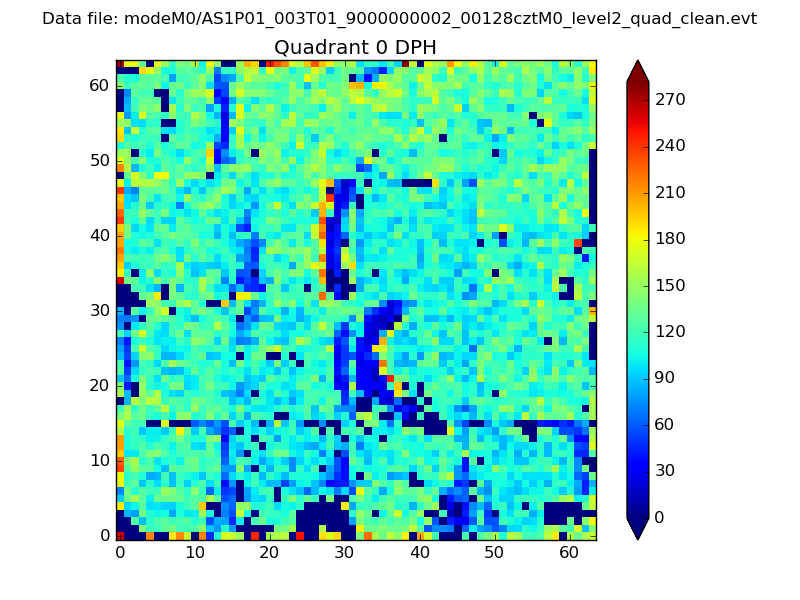 |
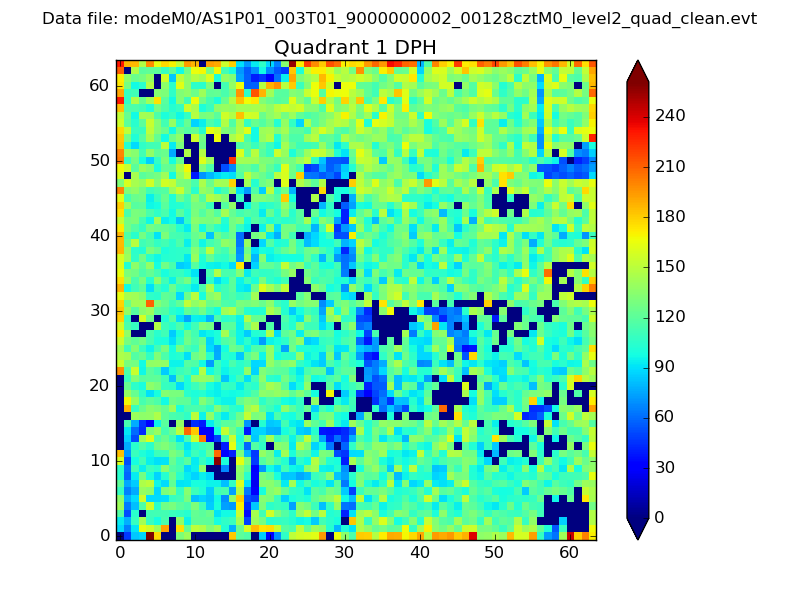 |
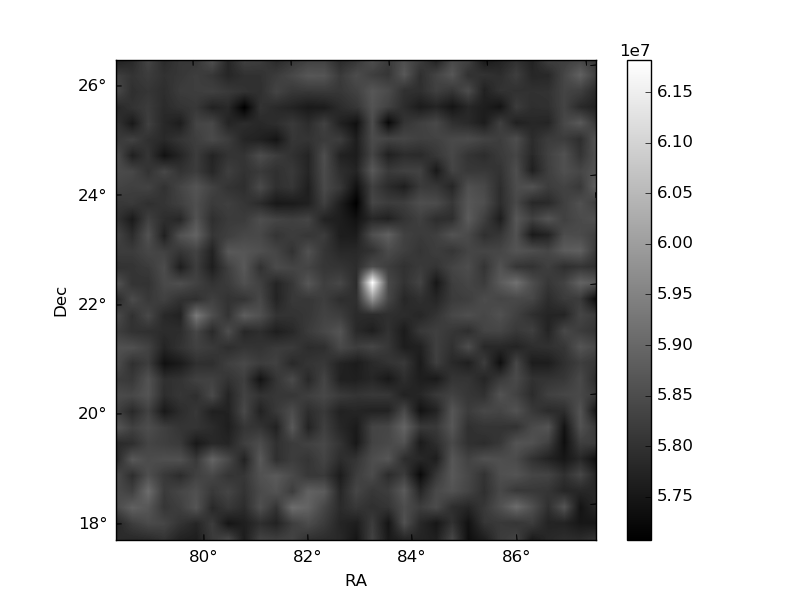
Quadrant B |
|---|---|---|---|
| Quadrant D |  |
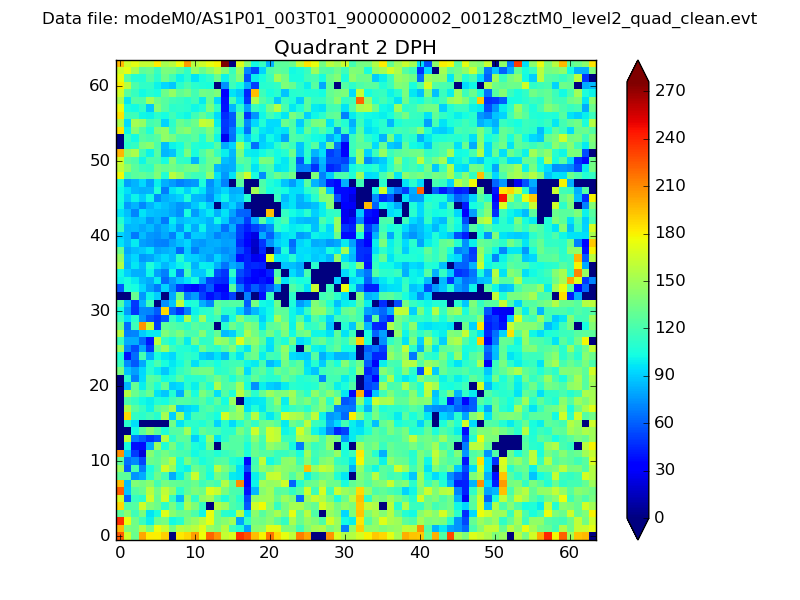 |
Quadrant C |
| Plot type | Count rate plots | Images |
|---|---|---|
| Comparison with Poisson distribution Blue bars denote a histogram of data divided into 1 sec bins. Red curve is a Poisson curve with rate = median count rate of data. |
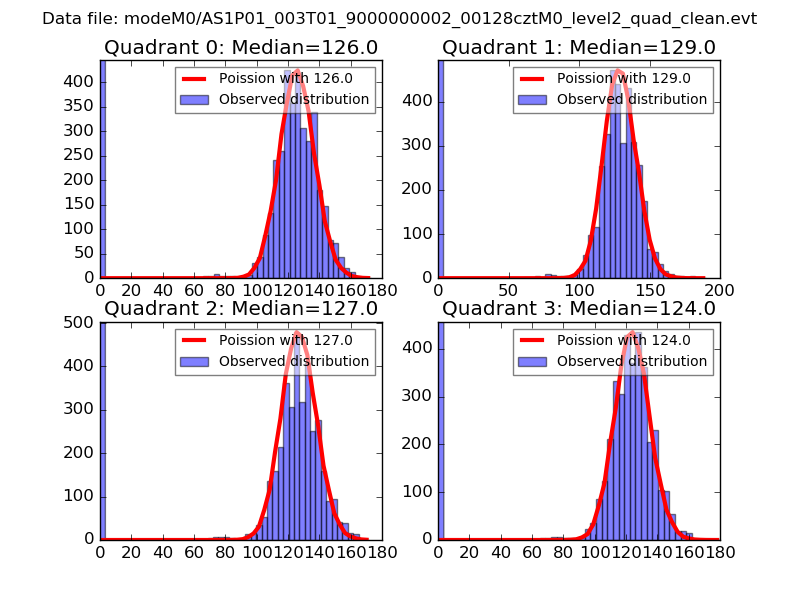 |
 |
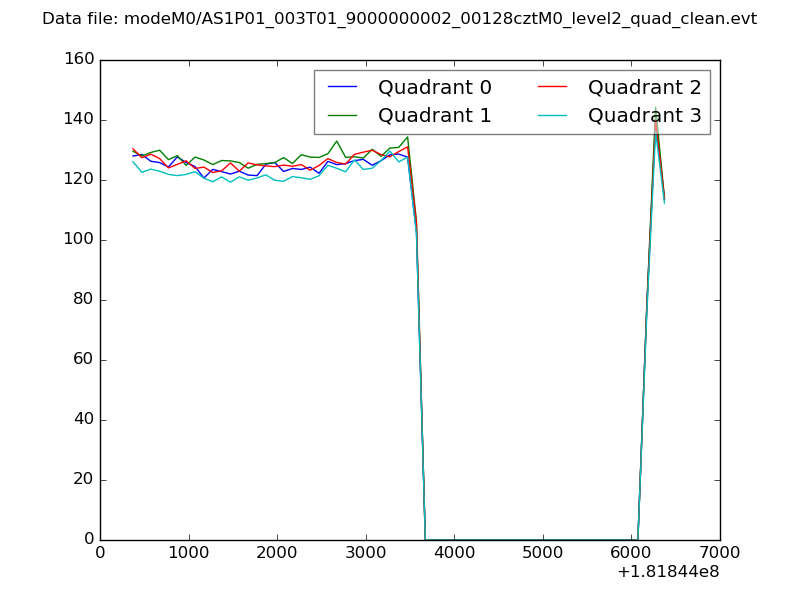
| Quadrant-wise count rates Data is divided into 100 sec bins |
 |
|
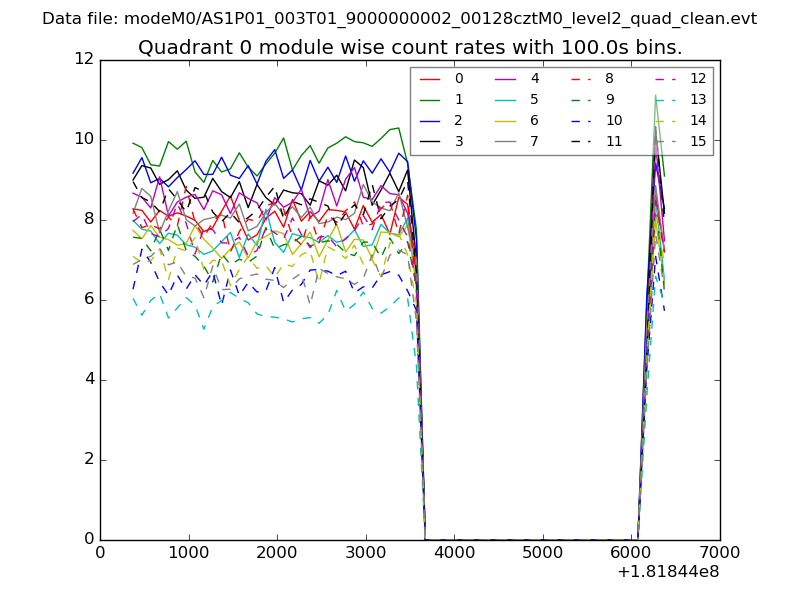
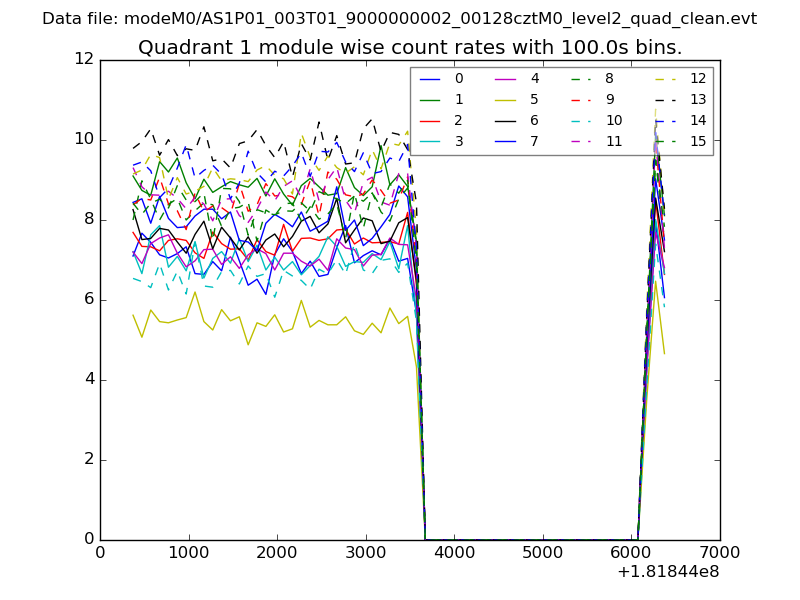
| Module-wise count rates for Quadrant A Data is divided into 100 sec bins |
 |
 |
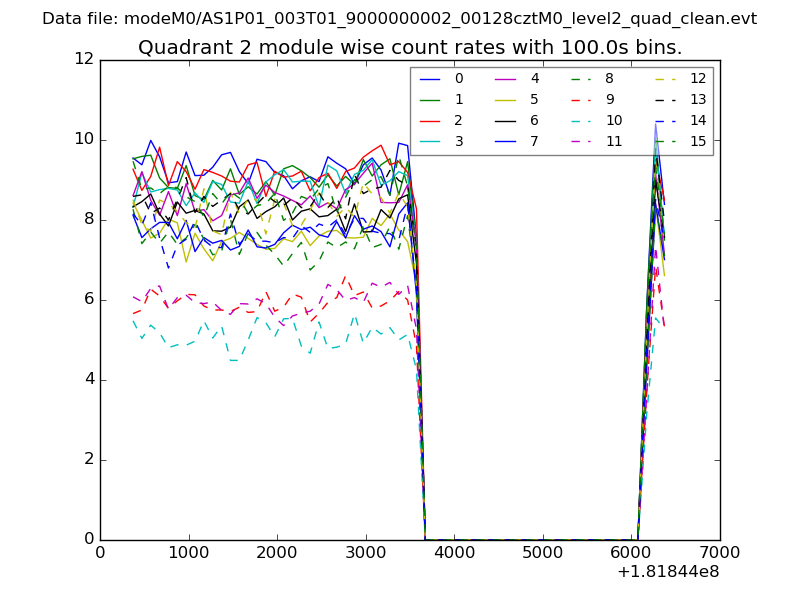
| Module-wise count rates for Quadrant B Data is divided into 100 sec bins |
 |
 |
| Module-wise count rates for Quadrant C Data is divided into 100 sec bins |
 |
 |
| Module-wise count rates for Quadrant D Data is divided into 100 sec bins |
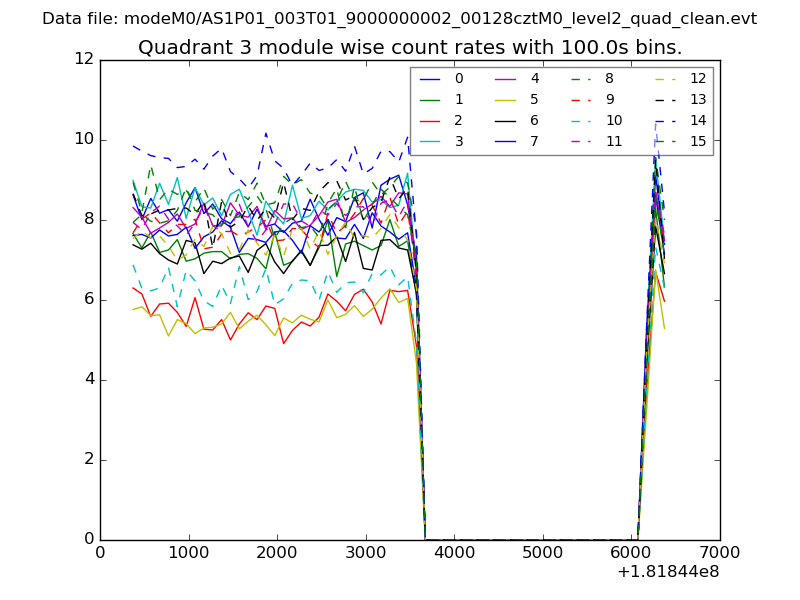 |
 |
| Parameter | Plot |
|---|---|
| CZT HV Monitor | 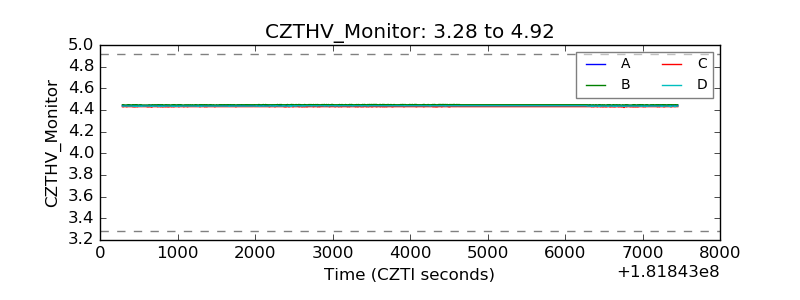 |
| D_VDD | 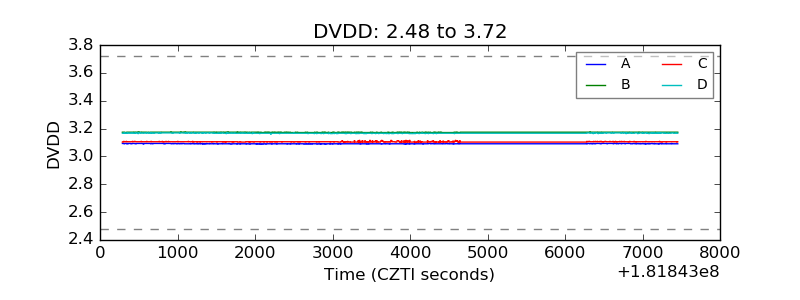 |
| Temperature 1 | 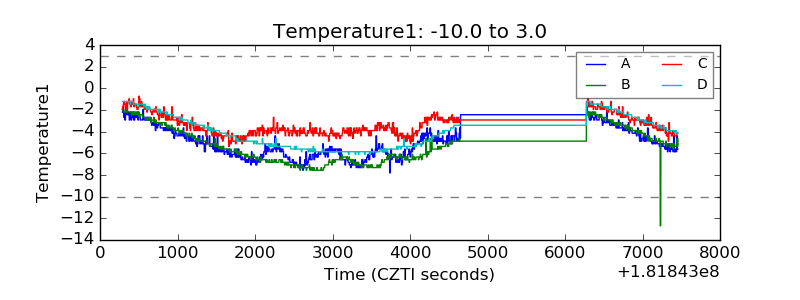 |
| Veto HV Monitor | 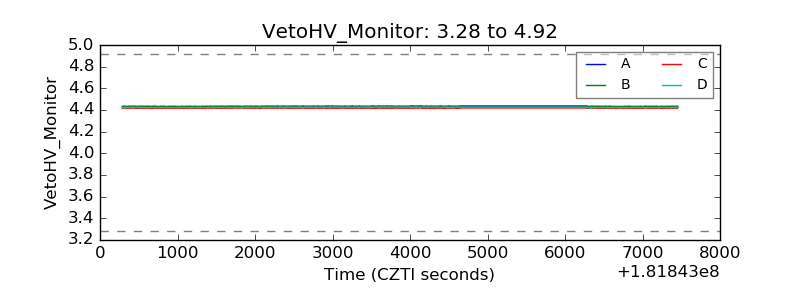 |
| Veto LLD | 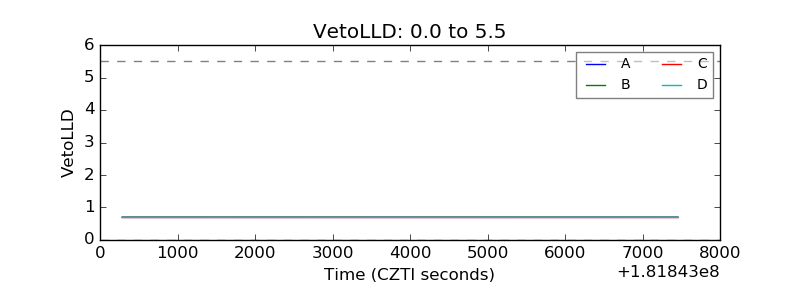 |
| Alpha Counter | 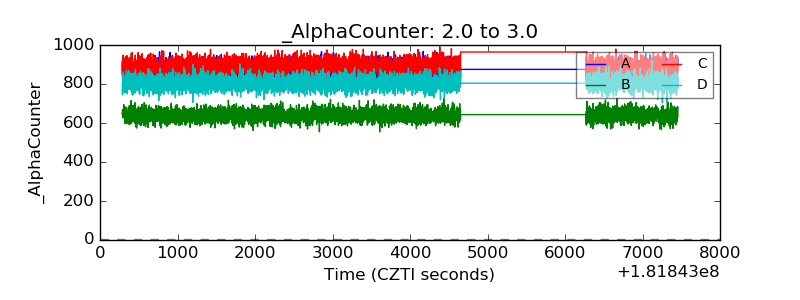 |
| _CPM_Rate | 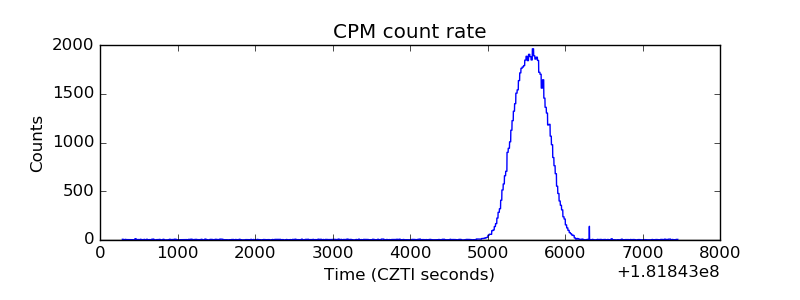 |
| CZT Counter | 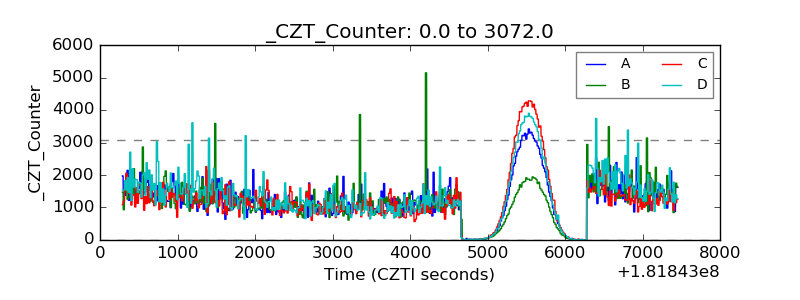 |
| +2.5 Volts monitor | 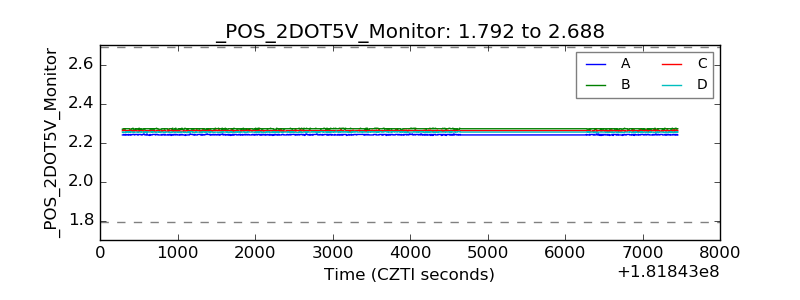 |
| +5 Volts monitor | 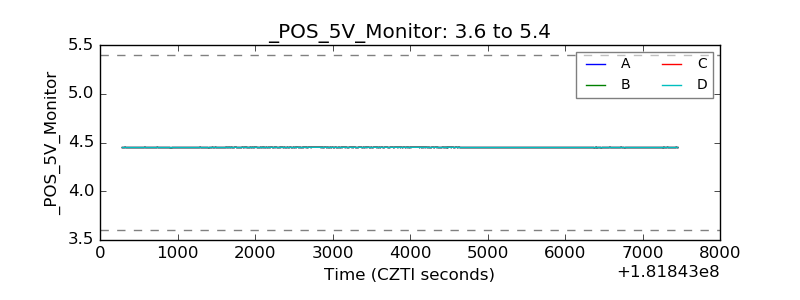 |
| _ROLL_ROT | 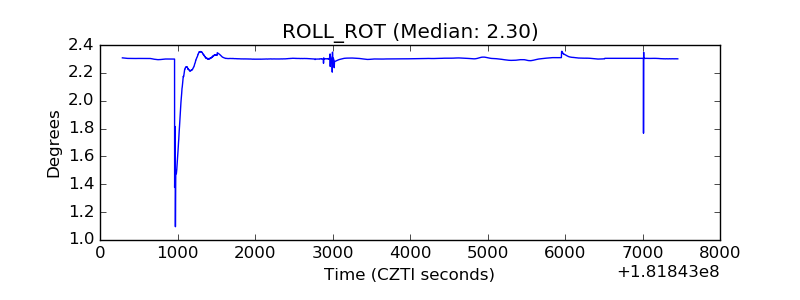 |
| _Roll_DEC | 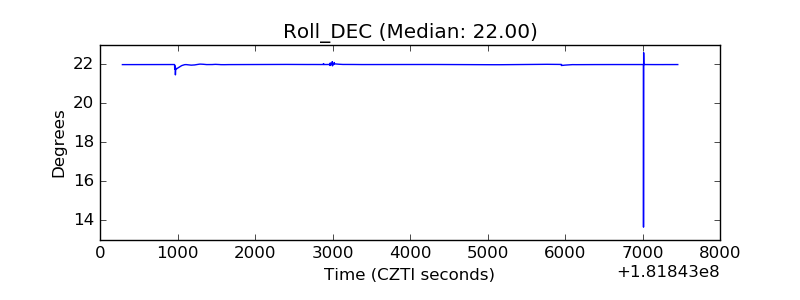 |
| _Roll_RA | 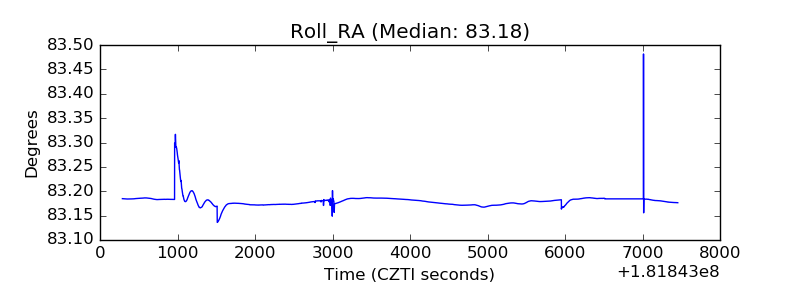 |
| Veto Counter | 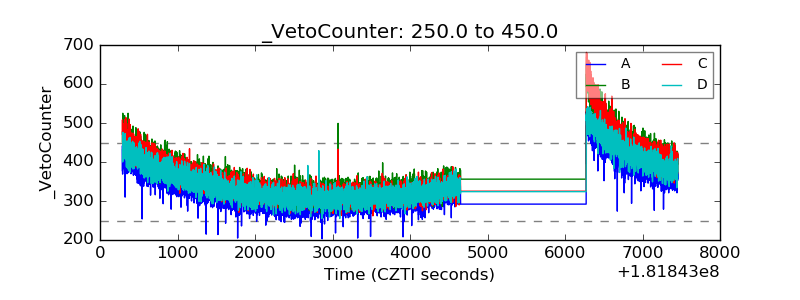 |