| Param | Original file | Final file |
|---|---|---|
| Filename | modeM0/AS1P01_003T01_9000000002_00129cztM0_level2.evt | modeM0/AS1P01_003T01_9000000002_00129cztM0_level2_quad_clean.evt |
| Size (bytes) | 230,290,560 | 23,901,120 |
| Size | 219.6 MB | 22.8 MB |
| Events in quadrant A | 1,596,076 | 155,699 |
| Events in quadrant B | 1,839,768 | 158,248 |
| Events in quadrant C | 1,530,973 | 157,287 |
| Events in quadrant D | 1,913,921 | 149,827 |
| Mode SS | |||
|---|---|---|---|
| Quadrant | BADHDUFLAG | Total packets | Discarded packets |
| A | 0 | 42 | 14 |
| B | 0 | 43 | 17 |
| C | 0 | 45 | 19 |
| D | 0 | 43 | 17 |
| Mode M9 | |||
|---|---|---|---|
| Quadrant | BADHDUFLAG | Total packets | Discarded packets |
| A | 1 | 229350969736 | 1 |
| B | 1 | -1 | -1 |
| C | 1 | -1 | -1 |
| D | 1 | -1 | -1 |
| Mode M0 | |||
|---|---|---|---|
| Quadrant | BADHDUFLAG | Total packets | Discarded packets |
| A | 0 | 9075 | 3374 |
| B | 0 | 10041 | 3603 |
| C | 0 | 8832 | 3311 |
| D | 0 | 11393 | 4736 |
| Quadrant | Total seconds | Saturated seconds | Saturation percentage |
|---|---|---|---|
| A | 1372 | 0 | 0.000000% |
| B | 1373 | 24 | 1.747997% |
| C | 1372 | 0 | 0.000000% |
| D | 1366 | 40 | 2.928258% |
Noise dominated data is calculated using 1-second bins in cleaned event files. If a bin has >2000 counts, and if more than 50% of those come from <1% of pixels, then it is considered to be noise-dominated and hence unusable.
| Quadrant | # 1 sec bins | Bins with >0 counts | Bins with >2000 counts | High rate bins dominated by noise | Noise dominated (total time) | Noise dominated (detector-on time) | Marked lightcurve |
|---|---|---|---|---|---|---|---|
| A | 2331 | 1384 | 16 | 16 | 0.69% | 1.16% | 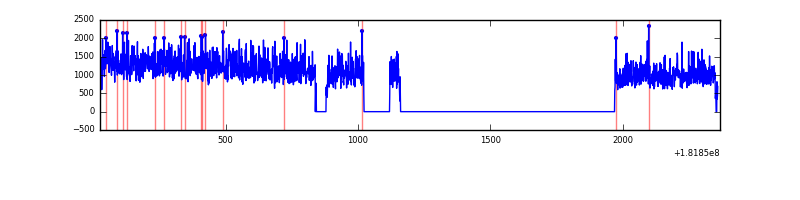 |
| B | 2336 | 1392 | 99 | 99 | 4.24% | 7.11% | 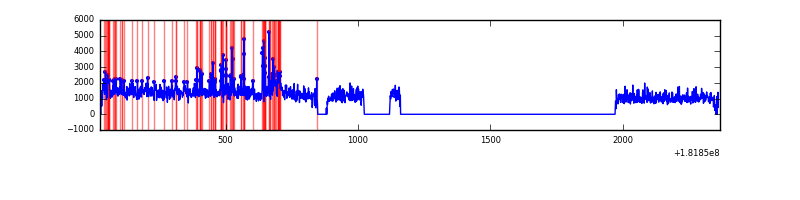 |
| C | 2341 | 1390 | 10 | 10 | 0.43% | 0.72% | 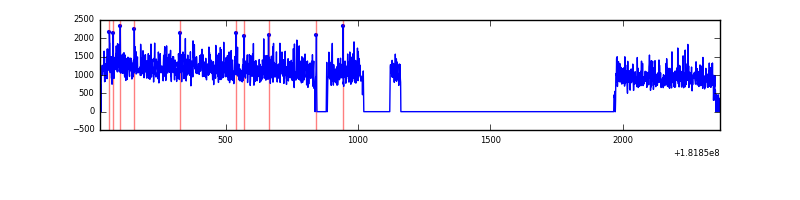 |
| D | 2336 | 1382 | 124 | 124 | 5.31% | 8.97% | 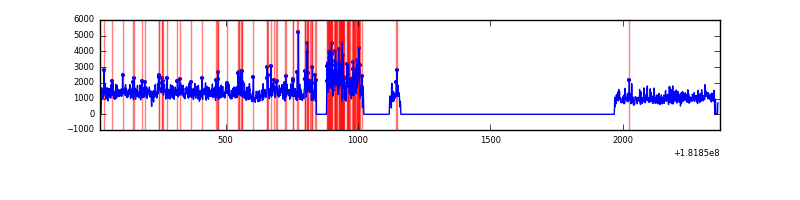 |
Top three noisy pixels from each quadrant. If the there are fewer than three noisy pixels in the level2.evt file, extra rows are filled as -1
| Pixel properties | Quadrant properties | ||||||
|---|---|---|---|---|---|---|---|
| Quadrant | DetID | PixID | Counts | Sigma | Mean | Median | Sigma |
| A | 13 | 65 | 4705 | 61.9 | 409 | 399 | 69.6 |
| A | 13 | 239 | 1948 | 22.27 | 409 | 399 | 69.6 |
| A | 14 | 171 | 1696 | 18.65 | 409 | 399 | 69.6 |
| B | 10 | 48 | 128358 | 1382.33 | 418 | 420 | 92.6 |
| B | 8 | 236 | 48574 | 520.29 | 418 | 420 | 92.6 |
| B | 8 | 65 | 27302 | 290.45 | 418 | 420 | 92.6 |
| C | 10 | 70 | 3339 | 26.99 | 387 | 402 | 108.8 |
| C | 10 | 20 | 1755 | 12.44 | 387 | 402 | 108.8 |
| C | 9 | 188 | 1158 | 6.95 | 387 | 402 | 108.8 |
| D | 10 | 244 | 241413 | 2323.59 | 392 | 395 | 103.7 |
| D | 13 | 207 | 36160 | 344.8 | 392 | 395 | 103.7 |
| D | 7 | 51 | 25096 | 238.14 | 392 | 395 | 103.7 |
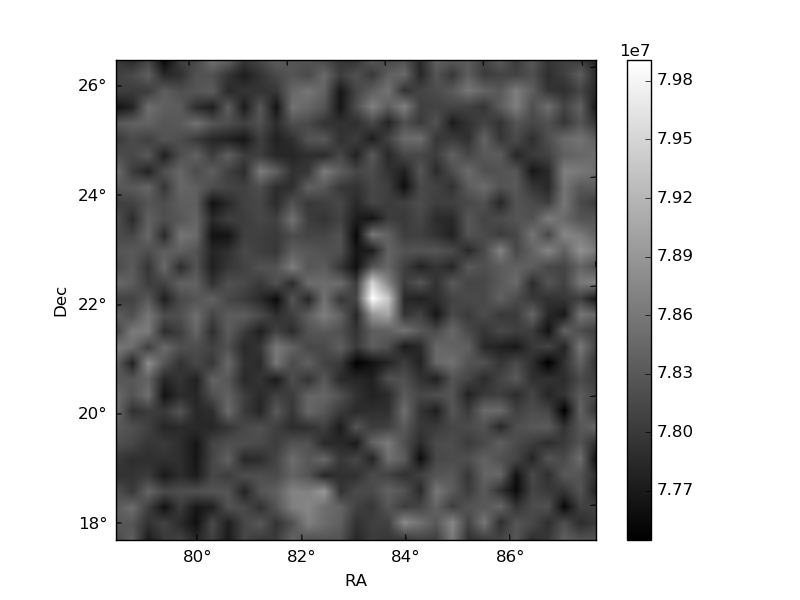
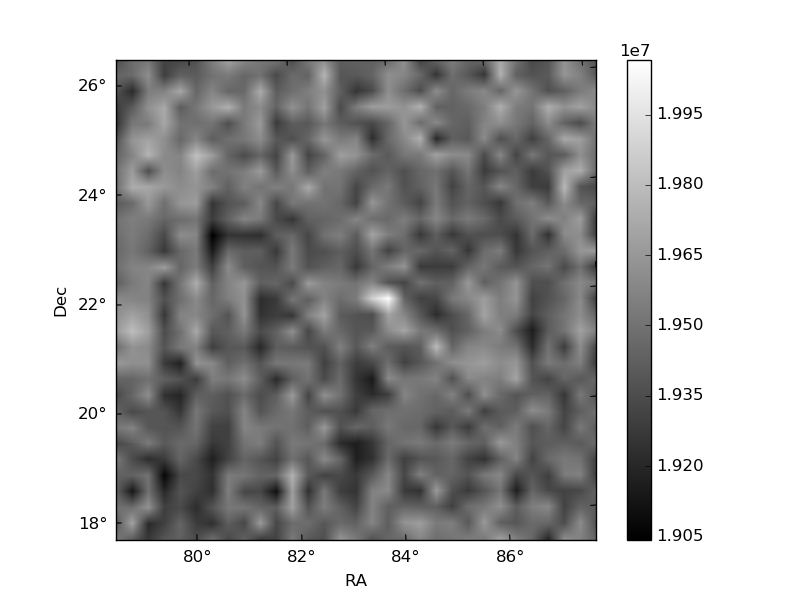
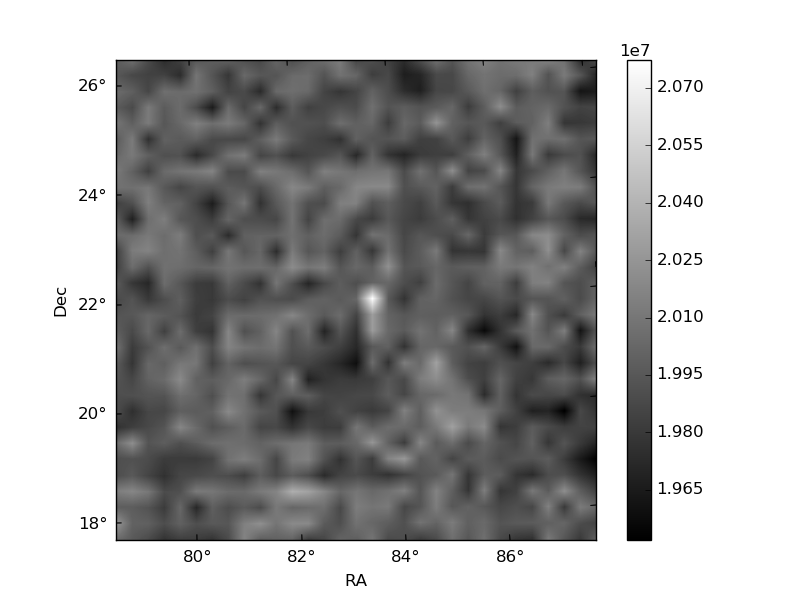
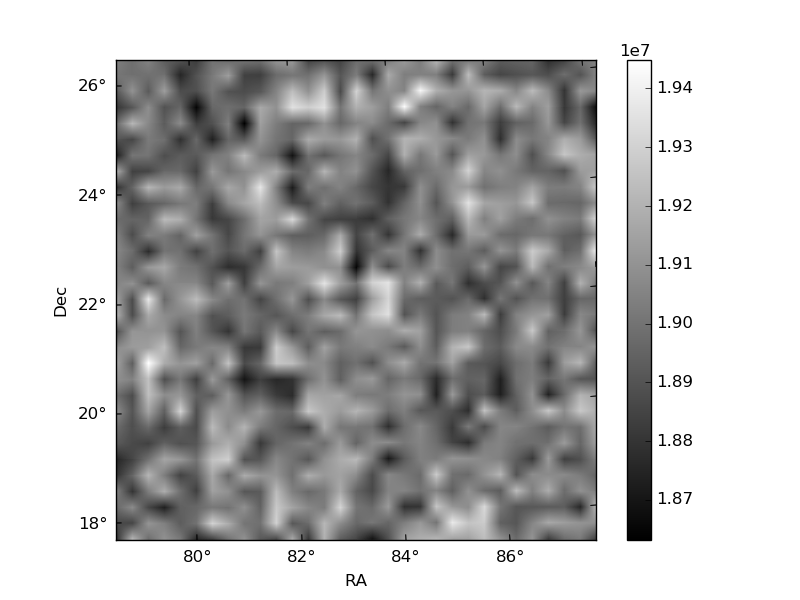
Histogram calculated using DETX and DETY for each event in the final _common_clean file
| Quadrant A | 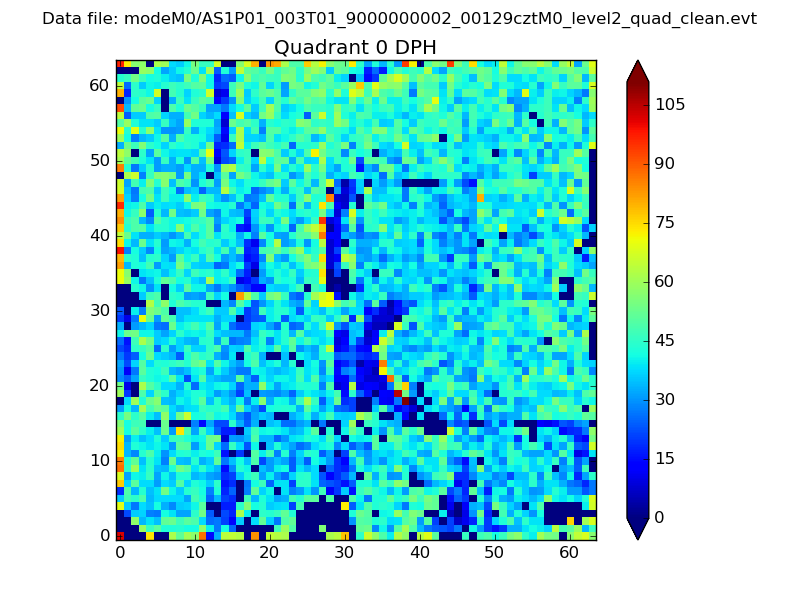 |
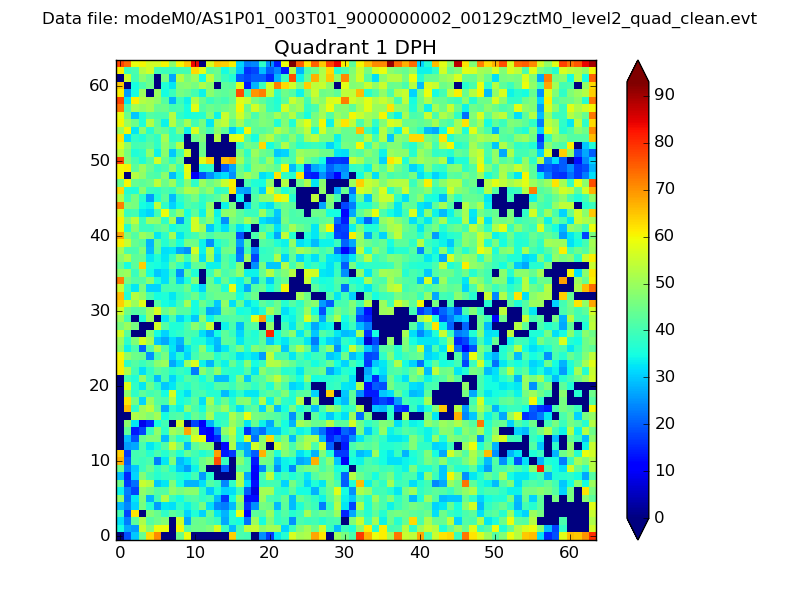 |
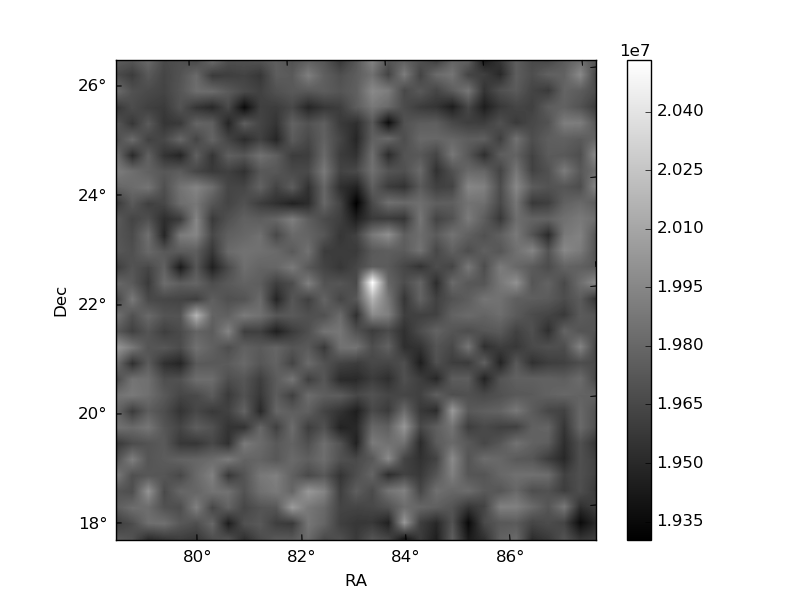
Quadrant B |
|---|---|---|---|
| Quadrant D | 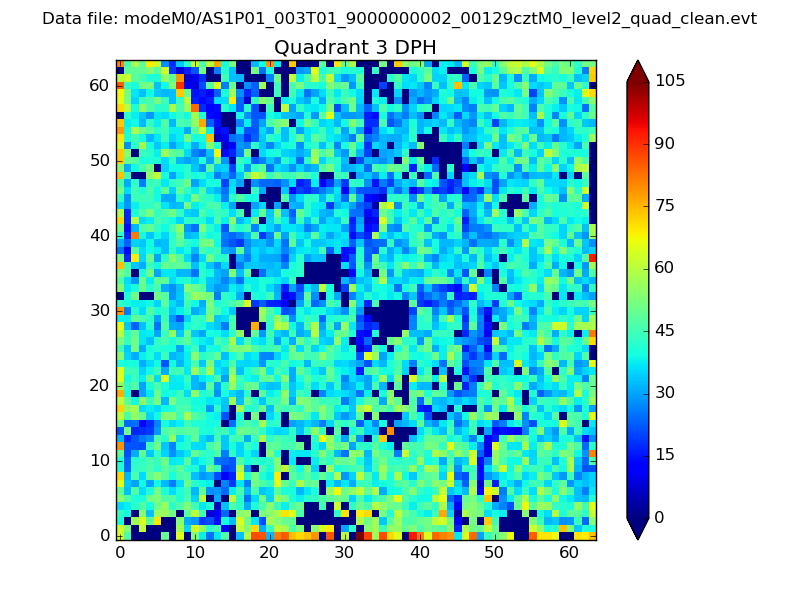 |
 |
Quadrant C |
| Plot type | Count rate plots | Images |
|---|---|---|
| Comparison with Poisson distribution Blue bars denote a histogram of data divided into 1 sec bins. Red curve is a Poisson curve with rate = median count rate of data. |
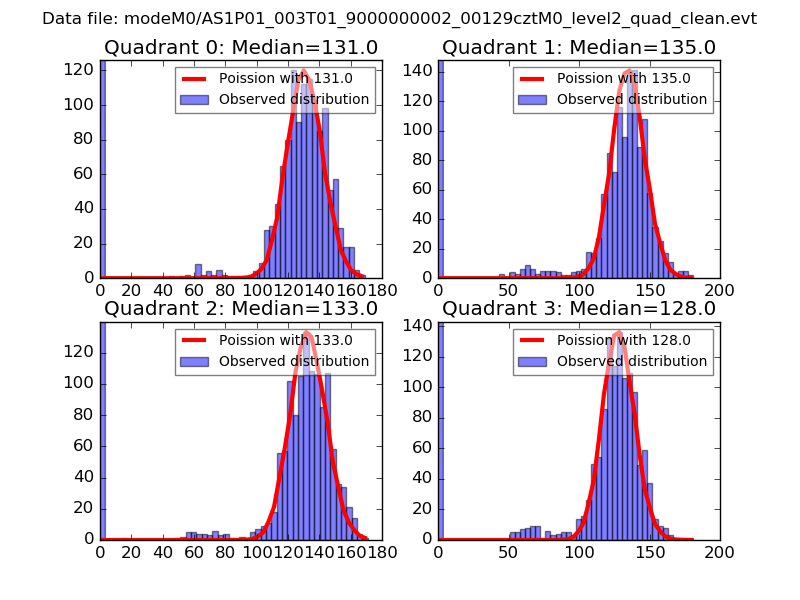 |
 |
| Quadrant-wise count rates Data is divided into 100 sec bins |
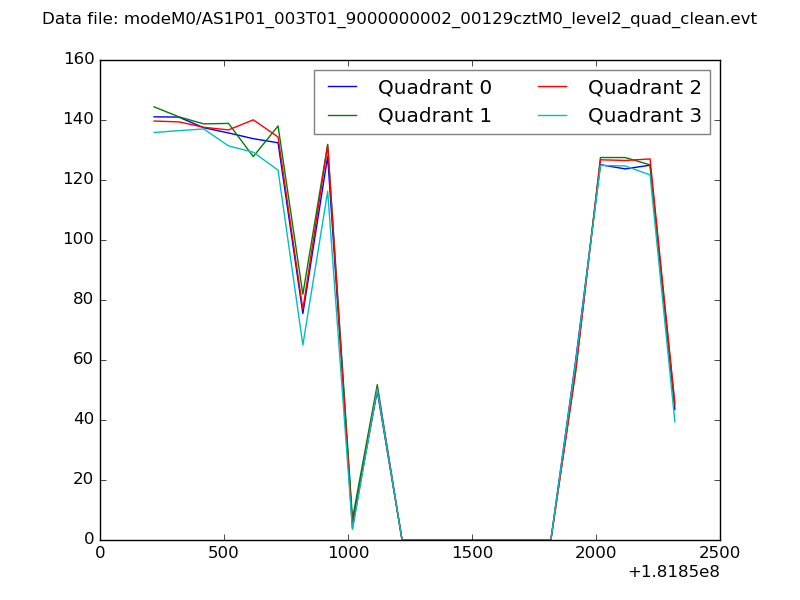 |
|
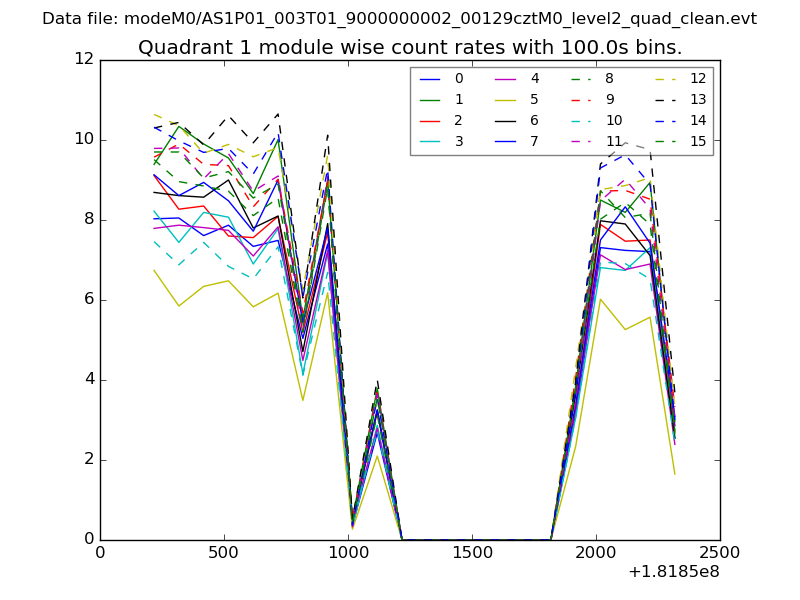
| Module-wise count rates for Quadrant A Data is divided into 100 sec bins |
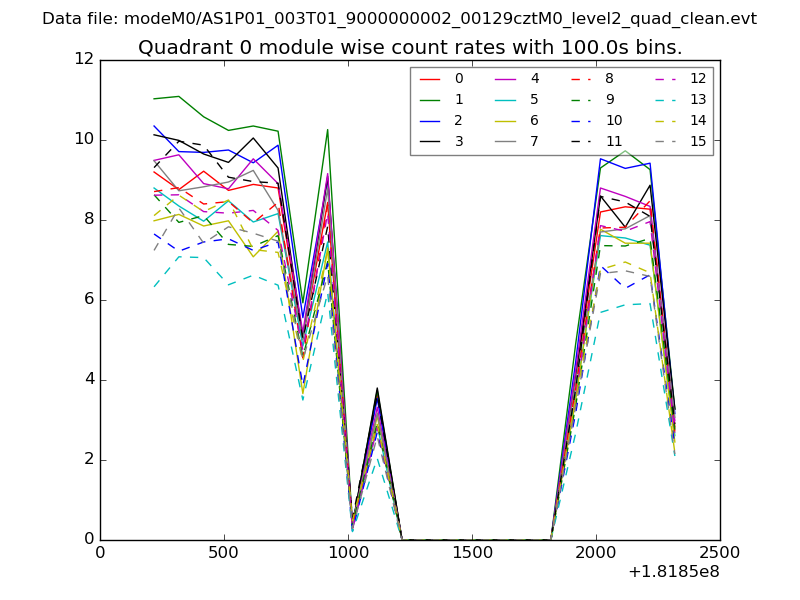 |
 |
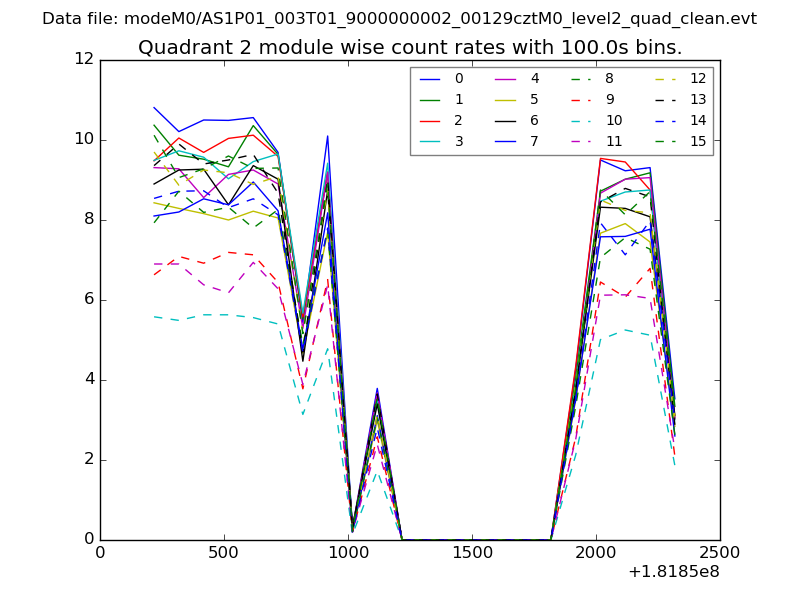
| Module-wise count rates for Quadrant B Data is divided into 100 sec bins |
 |
 |
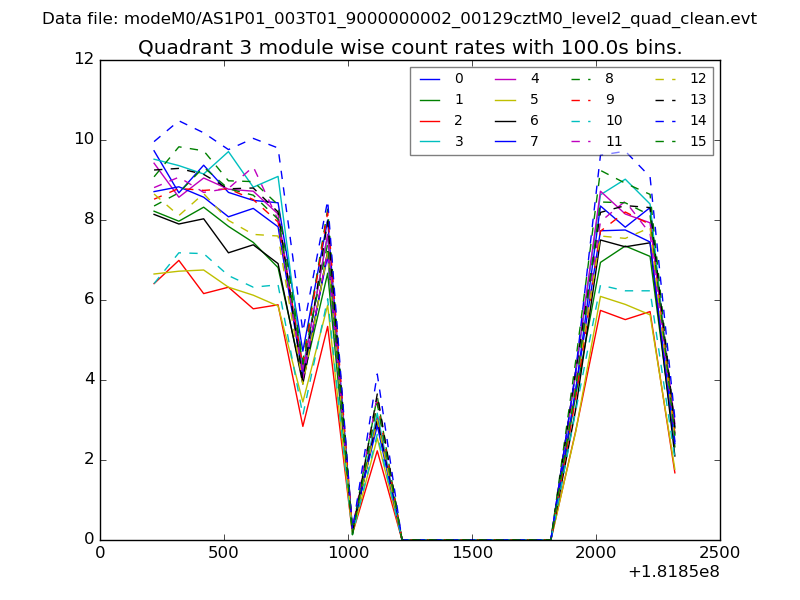
| Module-wise count rates for Quadrant C Data is divided into 100 sec bins |
 |
 |
| Module-wise count rates for Quadrant D Data is divided into 100 sec bins |
 |
 |
| Parameter | Plot |
|---|---|
| CZT HV Monitor | 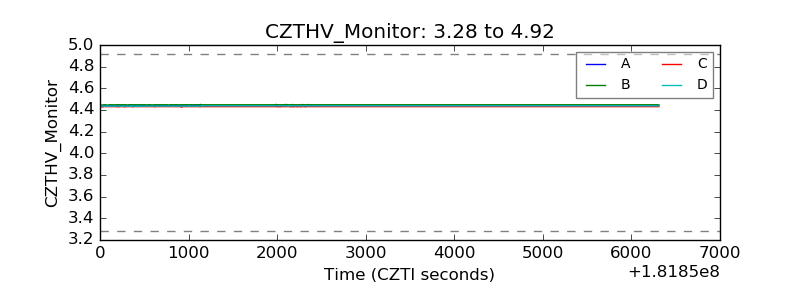 |
| D_VDD | 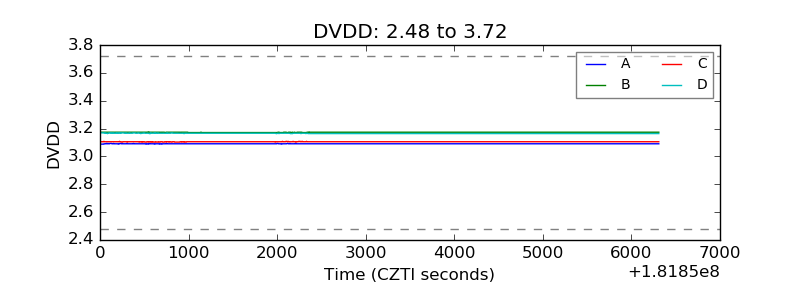 |
| Temperature 1 | 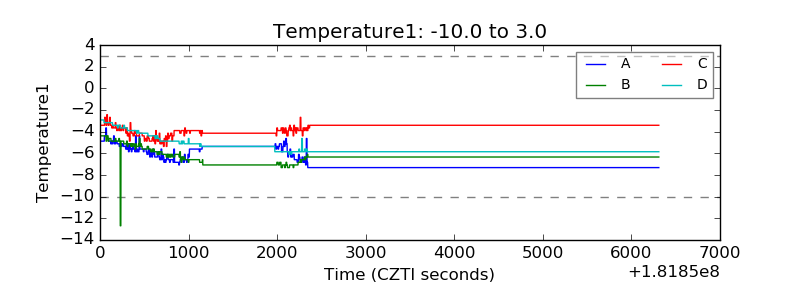 |
| Veto HV Monitor | 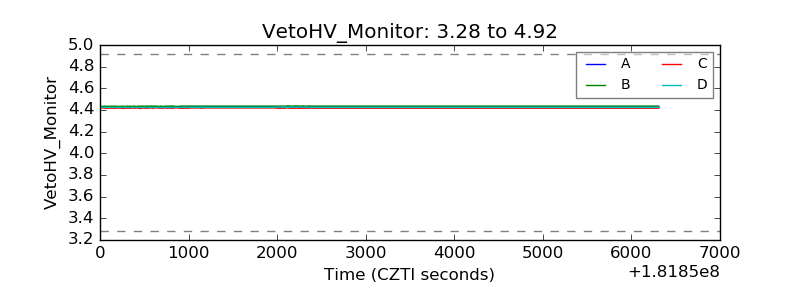 |
| Veto LLD | 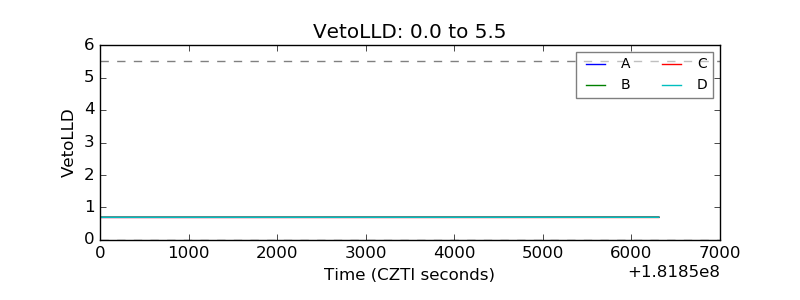 |
| Alpha Counter | 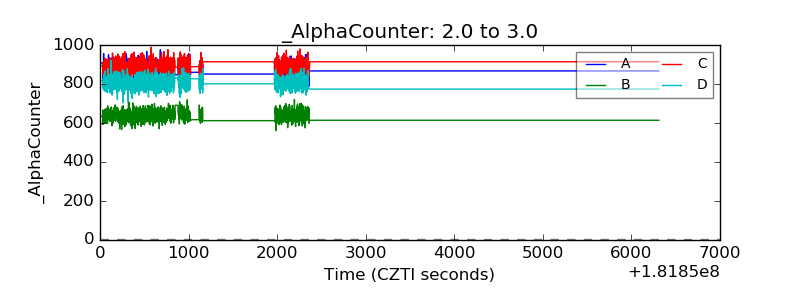 |
| _CPM_Rate | 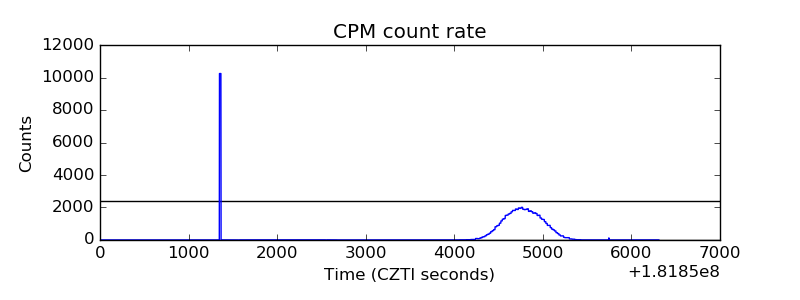 |
| CZT Counter |  |
| +2.5 Volts monitor |  |
| +5 Volts monitor |  |
| _ROLL_ROT | 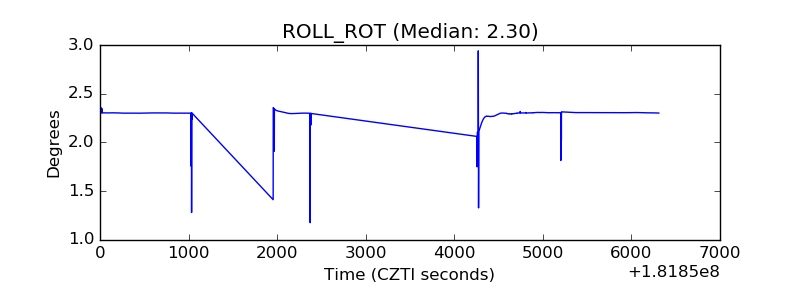 |
| _Roll_DEC | 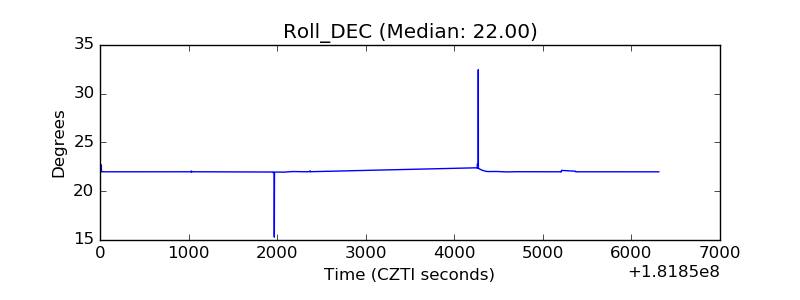 |
| _Roll_RA | 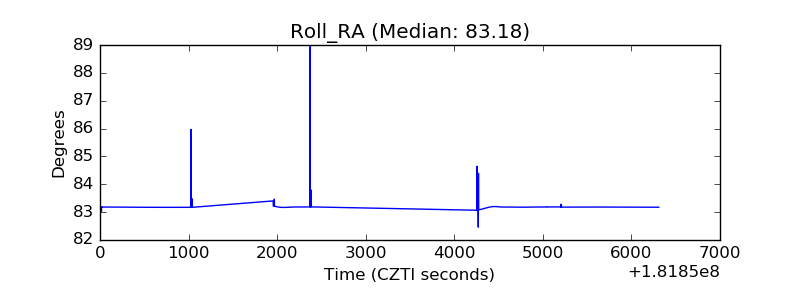 |
| Veto Counter | 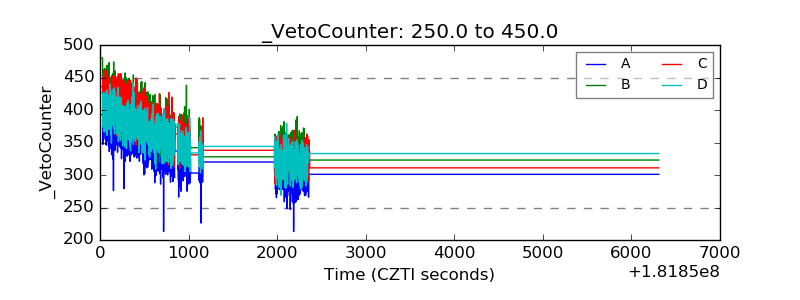 |