| Param | Original file | Final file |
|---|---|---|
| Filename | modeM0/AS1P01_003T01_9000000002_00130cztM0_level2.evt | modeM0/AS1P01_003T01_9000000002_00130cztM0_level2_quad_clean.evt |
| Size (bytes) | 939,369,600 | 93,456,000 |
| Size | 895.9 MB | 89.1 MB |
| Events in quadrant A | 6,778,418 | 609,297 |
| Events in quadrant B | 7,147,772 | 633,993 |
| Events in quadrant C | 6,396,439 | 617,191 |
| Events in quadrant D | 7,763,747 | 586,986 |
| Mode SS | |||
|---|---|---|---|
| Quadrant | BADHDUFLAG | Total packets | Discarded packets |
| A | 0 | 112 | 0 |
| B | 0 | 112 | 0 |
| C | 0 | 112 | 0 |
| D | 0 | 112 | 0 |
| Mode M9 | |||
|---|---|---|---|
| Quadrant | BADHDUFLAG | Total packets | Discarded packets |
| A | 0 | 16 | 0 |
| B | 0 | 16 | 0 |
| C | 0 | 16 | 0 |
| D | 0 | 16 | 0 |
| Mode M0 | |||
|---|---|---|---|
| Quadrant | BADHDUFLAG | Total packets | Discarded packets |
| A | 0 | 24003 | 2 |
| B | 0 | 25094 | 1 |
| C | 0 | 22905 | 1 |
| D | 0 | 27008 | 1 |
| Quadrant | Total seconds | Saturated seconds | Saturation percentage |
|---|---|---|---|
| A | 5469 | 13 | 0.237703% |
| B | 5469 | 13 | 0.237703% |
| C | 5469 | 39 | 0.713110% |
| D | 5469 | 163 | 2.980435% |
Noise dominated data is calculated using 1-second bins in cleaned event files. If a bin has >2000 counts, and if more than 50% of those come from <1% of pixels, then it is considered to be noise-dominated and hence unusable.
| Quadrant | # 1 sec bins | Bins with >0 counts | Bins with >2000 counts | High rate bins dominated by noise | Noise dominated (total time) | Noise dominated (detector-on time) | Marked lightcurve |
|---|---|---|---|---|---|---|---|
| A | 7090 | 5471 | 192 | 192 | 2.71% | 3.51% | 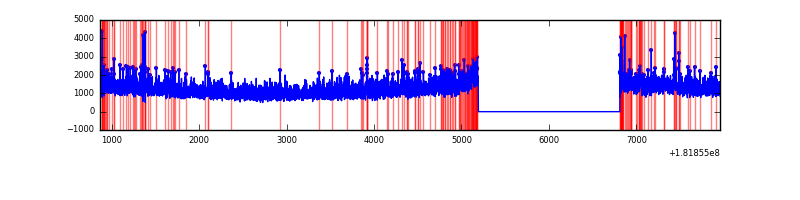 |
| B | 7090 | 5471 | 255 | 255 | 3.60% | 4.66% | 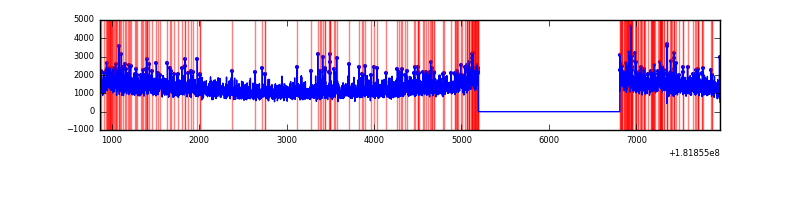 |
| C | 7090 | 5471 | 160 | 160 | 2.26% | 2.92% | 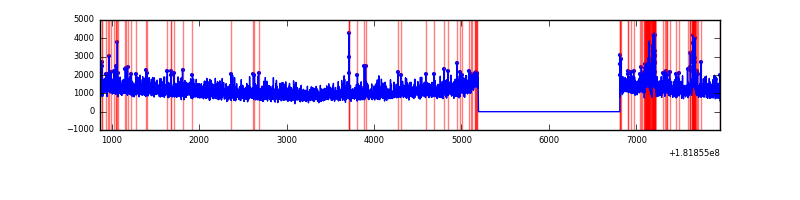 |
| D | 7090 | 5471 | 712 | 712 | 10.04% | 13.01% |  |
Top three noisy pixels from each quadrant. If the there are fewer than three noisy pixels in the level2.evt file, extra rows are filled as -1
| Pixel properties | Quadrant properties | ||||||
|---|---|---|---|---|---|---|---|
| Quadrant | DetID | PixID | Counts | Sigma | Mean | Median | Sigma |
| A | 15 | 127 | 96090 | 341.92 | 1692 | 1652 | 276.2 |
| A | 13 | 65 | 41510 | 144.31 | 1692 | 1652 | 276.2 |
| A | 0 | 96 | 16304 | 53.05 | 1692 | 1652 | 276.2 |
| B | 0 | 235 | 471830 | 1260.0 | 1706 | 1712 | 373.1 |
| B | 8 | 6 | 42190 | 108.49 | 1706 | 1712 | 373.1 |
| B | 8 | 236 | 19542 | 47.79 | 1706 | 1712 | 373.1 |
| C | 0 | 203 | 206050 | 470.25 | 1559 | 1617 | 434.7 |
| C | 9 | 185 | 18697 | 39.29 | 1559 | 1617 | 434.7 |
| C | 9 | 204 | 14650 | 29.98 | 1559 | 1617 | 434.7 |
| D | 10 | 244 | 541699 | 1426.12 | 1632 | 1621 | 378.7 |
| D | 12 | 207 | 138153 | 360.52 | 1632 | 1621 | 378.7 |
| D | 10 | 151 | 100124 | 260.11 | 1632 | 1621 | 378.7 |
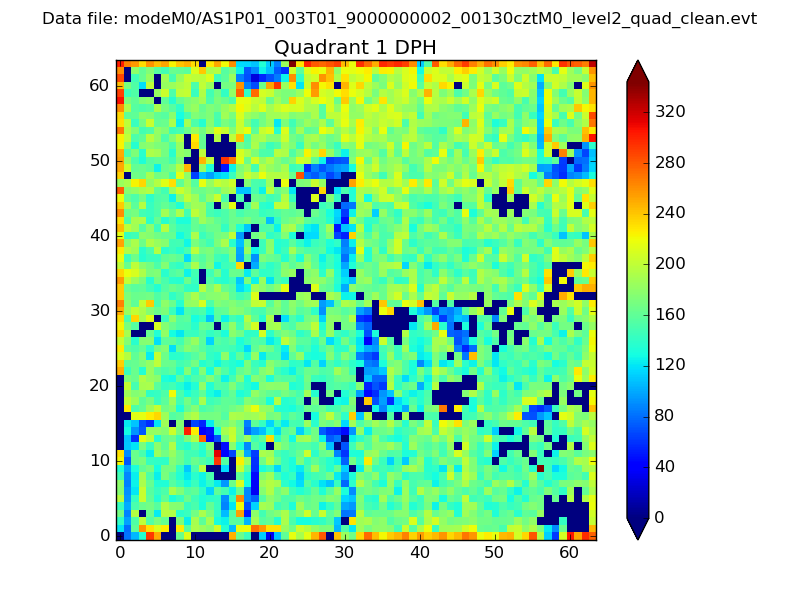
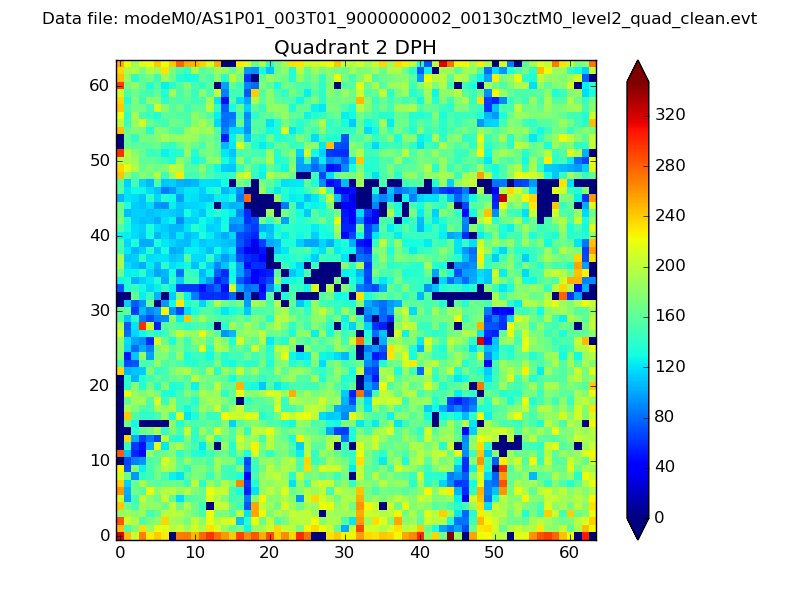
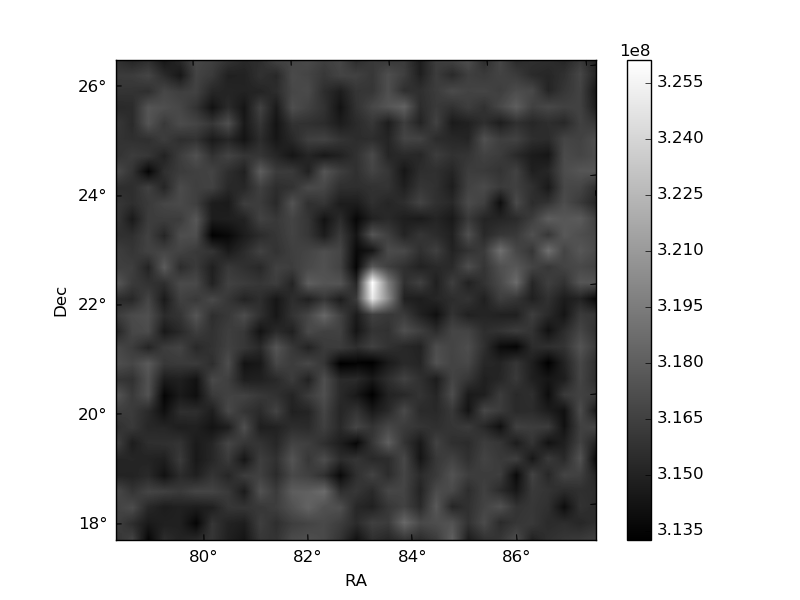
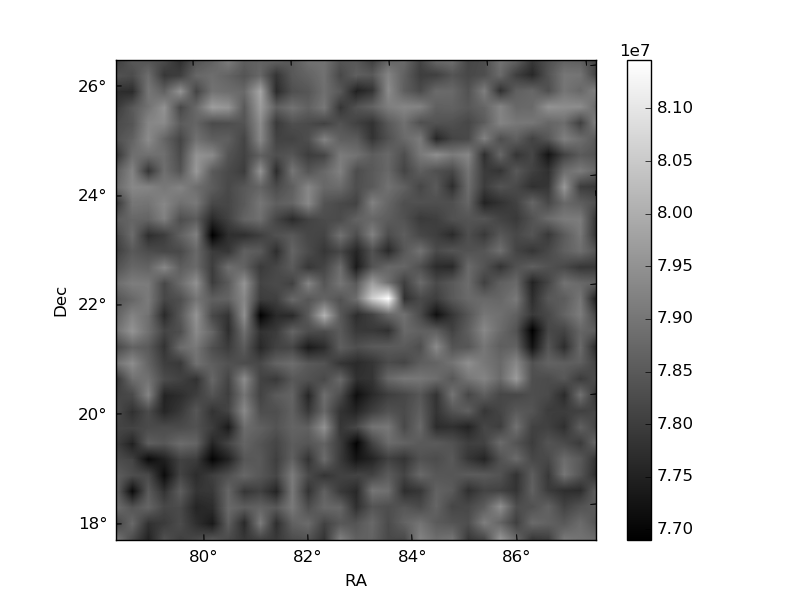
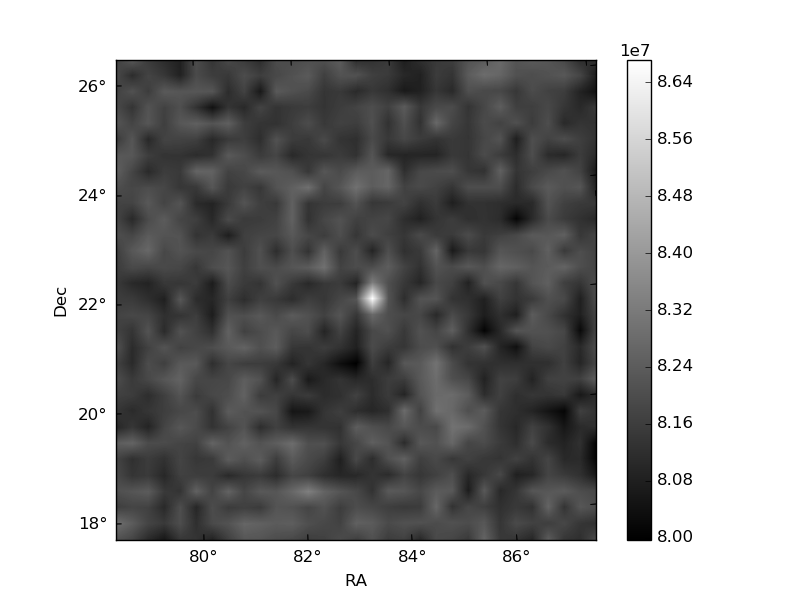
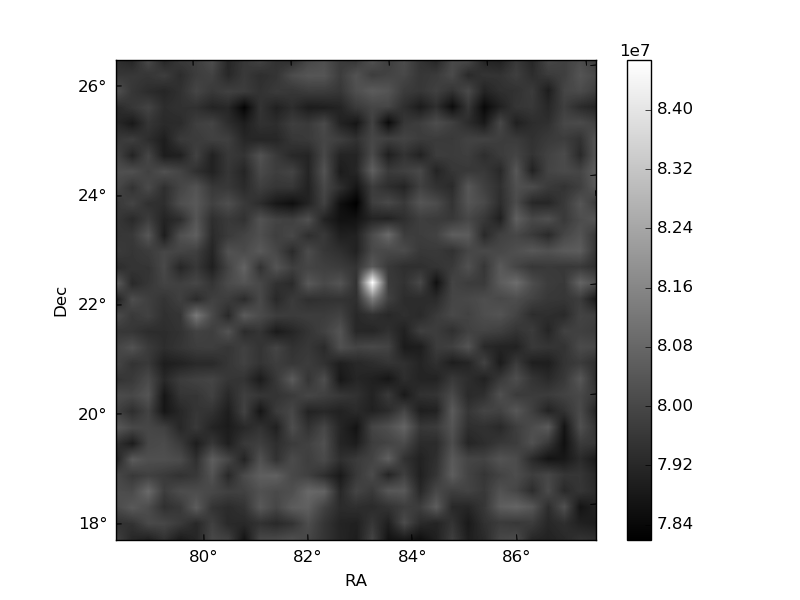
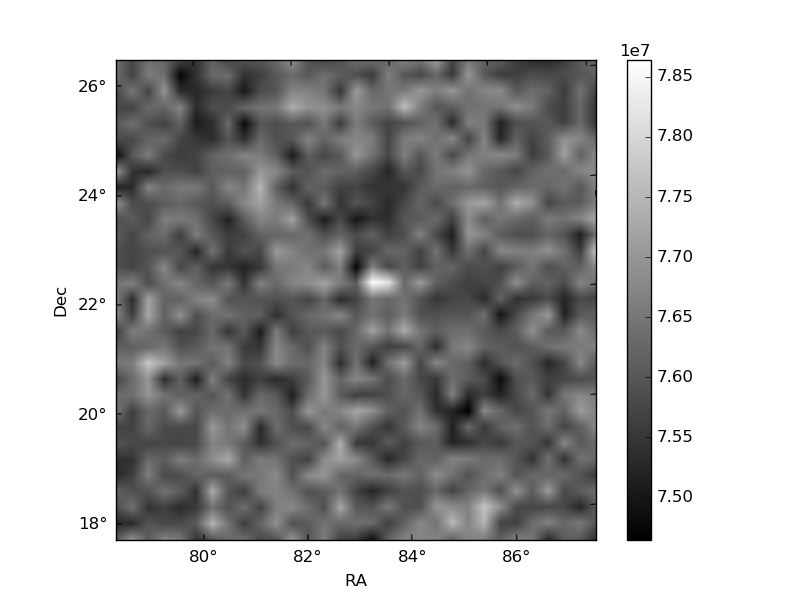
Histogram calculated using DETX and DETY for each event in the final _common_clean file
| Quadrant A | 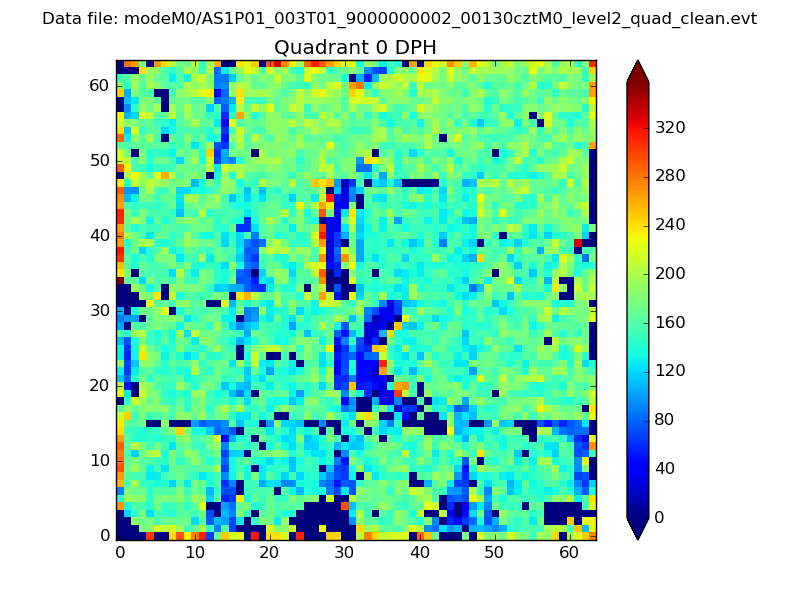 |
 |
Quadrant B |
|---|---|---|---|
| Quadrant D | 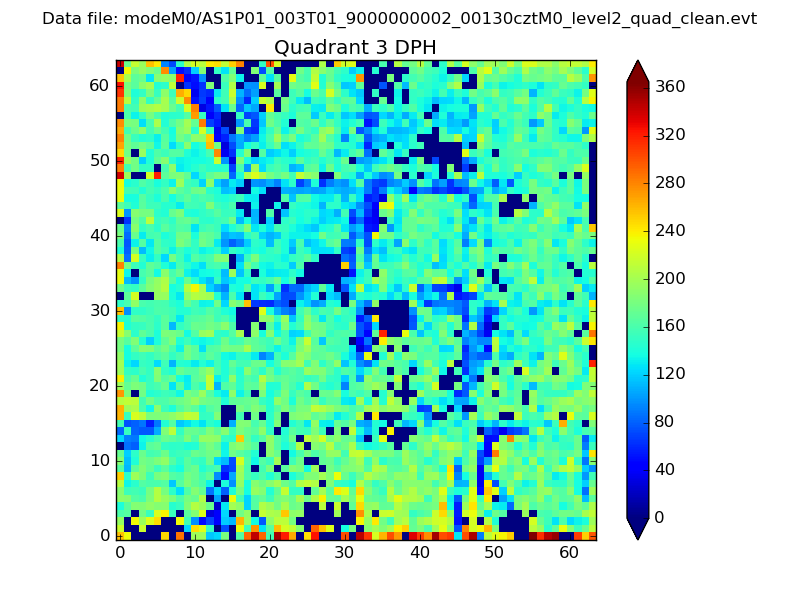 |
 |
Quadrant C |
| Plot type | Count rate plots | Images |
|---|---|---|
| Comparison with Poisson distribution Blue bars denote a histogram of data divided into 1 sec bins. Red curve is a Poisson curve with rate = median count rate of data. |
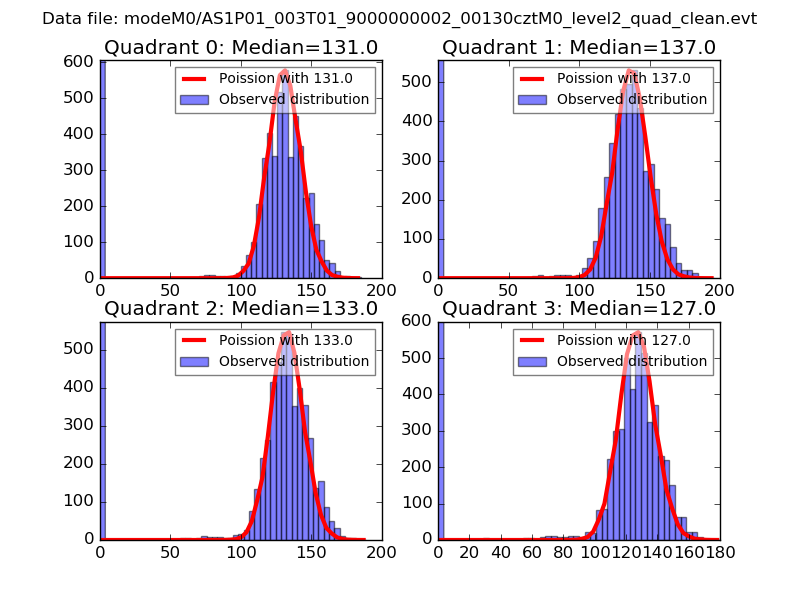 |
 |
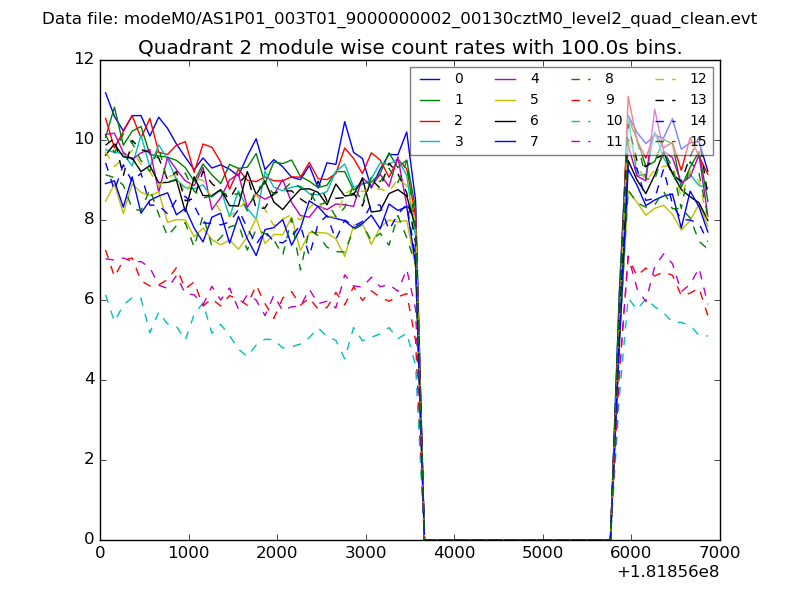
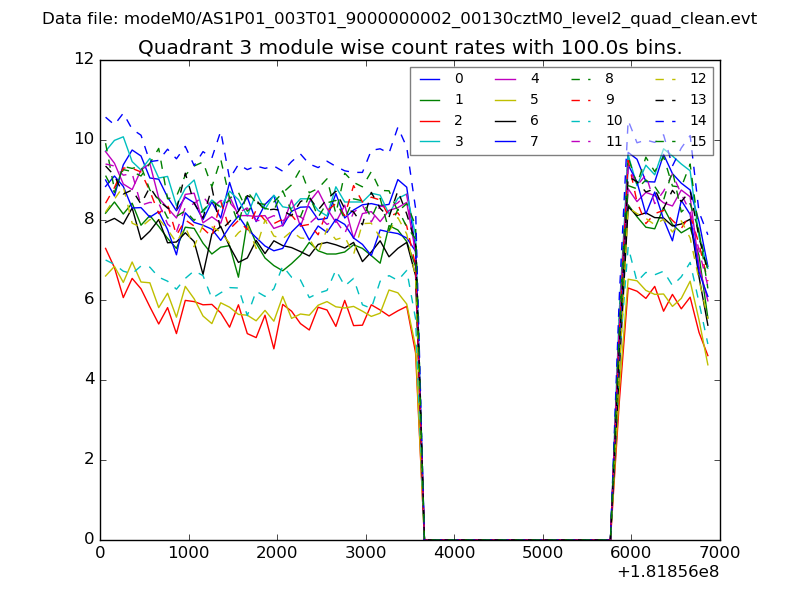
| Quadrant-wise count rates Data is divided into 100 sec bins |
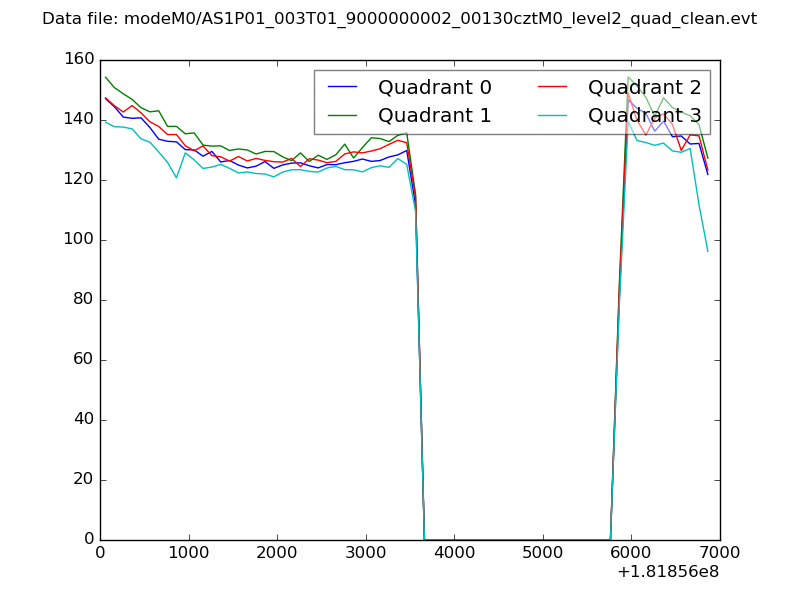 |
|
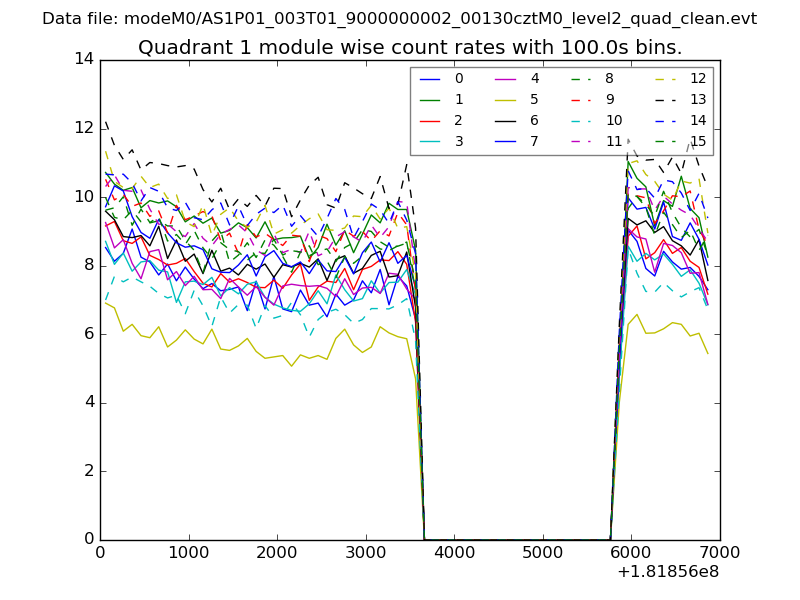
| Module-wise count rates for Quadrant A Data is divided into 100 sec bins |
 |
 |
| Module-wise count rates for Quadrant B Data is divided into 100 sec bins |
 |
 |
| Module-wise count rates for Quadrant C Data is divided into 100 sec bins |
 |
 |
| Module-wise count rates for Quadrant D Data is divided into 100 sec bins |
 |
 |
| Parameter | Plot |
|---|---|
| CZT HV Monitor |  |
| D_VDD | 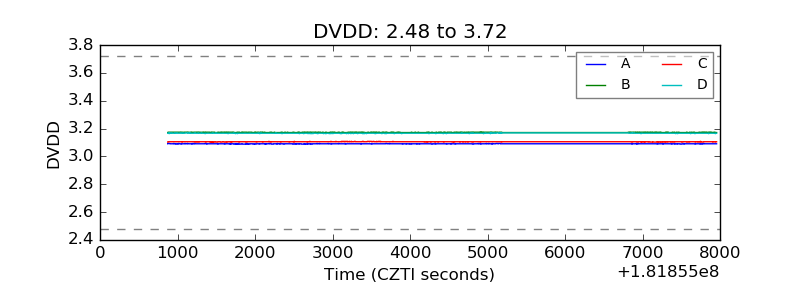 |
| Temperature 1 |  |
| Veto HV Monitor | 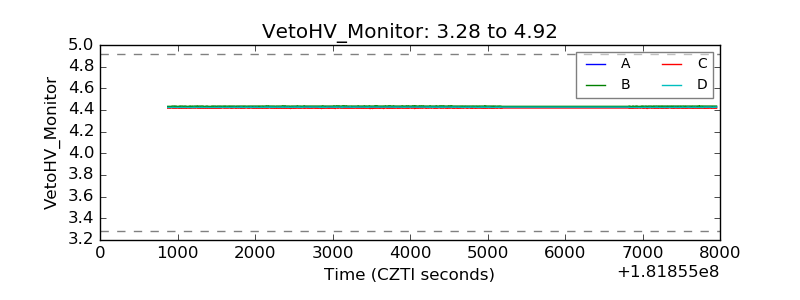 |
| Veto LLD |  |
| Alpha Counter | 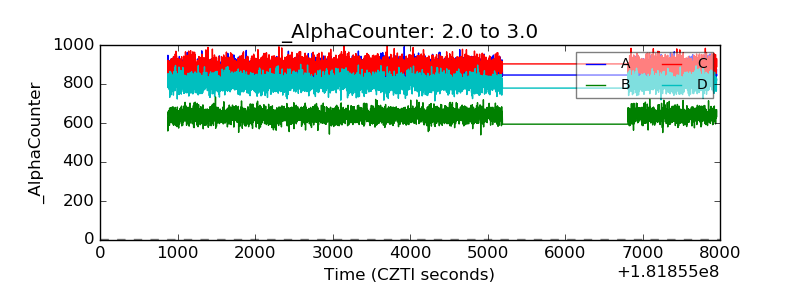 |
| _CPM_Rate | 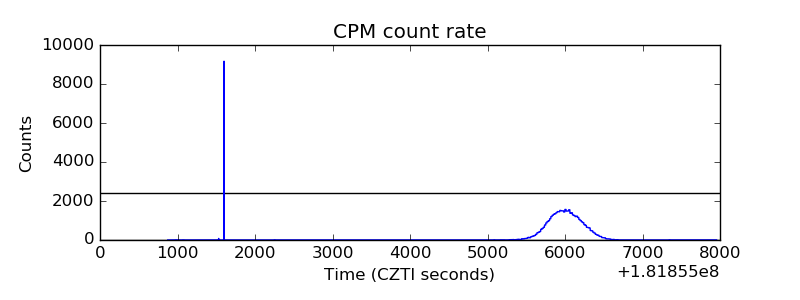 |
| CZT Counter | 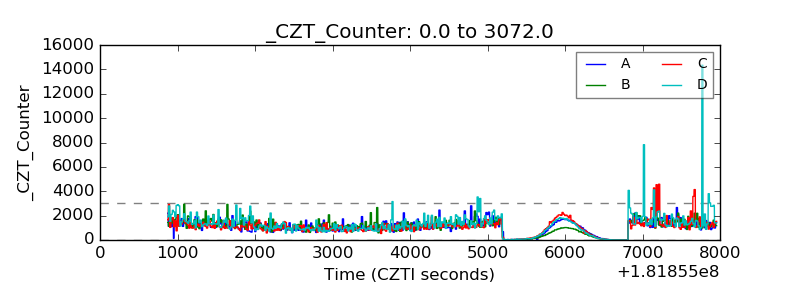 |
| +2.5 Volts monitor |  |
| +5 Volts monitor |  |
| _ROLL_ROT | 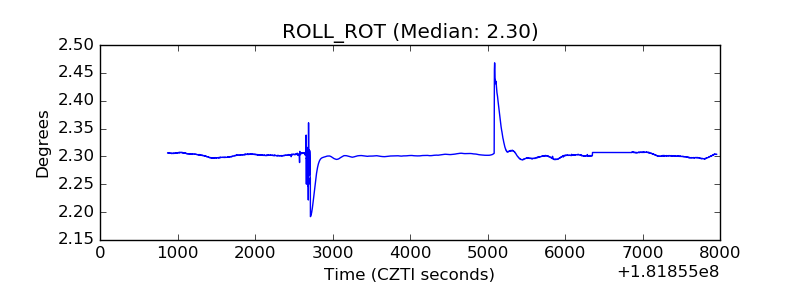 |
| _Roll_DEC | 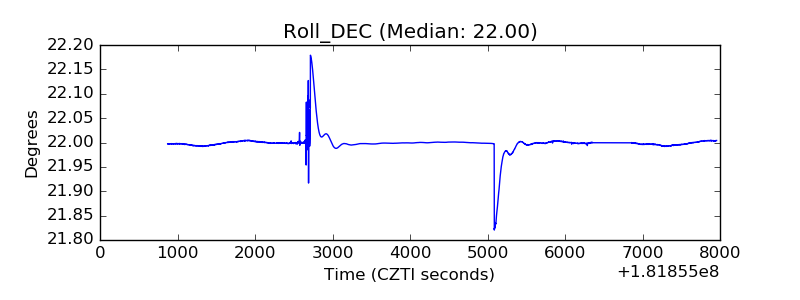 |
| _Roll_RA | 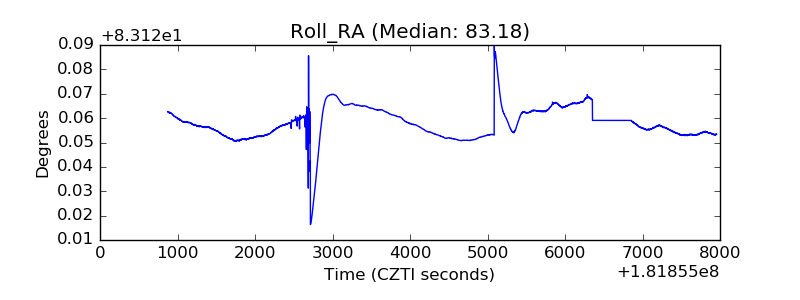 |
| Veto Counter | 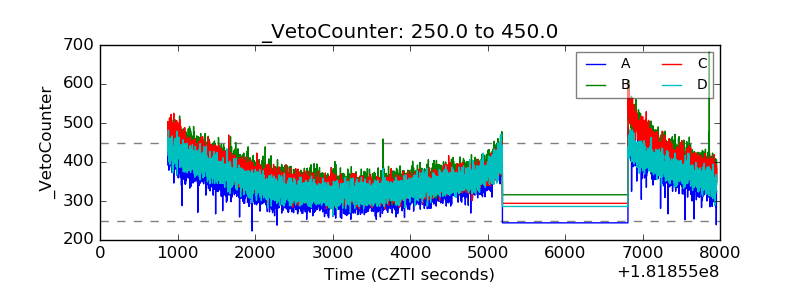 |