| Param | Original file | Final file |
|---|---|---|
| Filename | modeM0/AS1P01_003T01_9000000002_00131cztM0_level2.evt | modeM0/AS1P01_003T01_9000000002_00131cztM0_level2_quad_clean.evt |
| Size (bytes) | 1,016,821,440 | 93,242,880 |
| Size | 969.7 MB | 88.9 MB |
| Events in quadrant A | 8,743,573 | 595,329 |
| Events in quadrant B | 7,337,818 | 628,324 |
| Events in quadrant C | 6,583,029 | 613,375 |
| Events in quadrant D | 7,750,049 | 585,144 |
| Mode SS | |||
|---|---|---|---|
| Quadrant | BADHDUFLAG | Total packets | Discarded packets |
| A | 0 | 118 | 0 |
| B | 0 | 118 | 0 |
| C | 0 | 118 | 0 |
| D | 0 | 118 | 0 |
| Mode M9 | |||
|---|---|---|---|
| Quadrant | BADHDUFLAG | Total packets | Discarded packets |
| A | 0 | 16 | 0 |
| B | 0 | 16 | 0 |
| C | 0 | 16 | 0 |
| D | 0 | 16 | 0 |
| Mode M0 | |||
|---|---|---|---|
| Quadrant | BADHDUFLAG | Total packets | Discarded packets |
| A | 0 | 30050 | 3 |
| B | 0 | 25846 | 2 |
| C | 0 | 23670 | 2 |
| D | 0 | 27084 | 2 |
| Quadrant | Total seconds | Saturated seconds | Saturation percentage |
|---|---|---|---|
| A | 5742 | 163 | 2.838732% |
| B | 5742 | 13 | 0.226402% |
| C | 5742 | 38 | 0.661790% |
| D | 5742 | 140 | 2.438175% |
Noise dominated data is calculated using 1-second bins in cleaned event files. If a bin has >2000 counts, and if more than 50% of those come from <1% of pixels, then it is considered to be noise-dominated and hence unusable.
| Quadrant | # 1 sec bins | Bins with >0 counts | Bins with >2000 counts | High rate bins dominated by noise | Noise dominated (total time) | Noise dominated (detector-on time) | Marked lightcurve |
|---|---|---|---|---|---|---|---|
| A | 7364 | 5744 | 1010 | 1010 | 13.72% | 17.58% | 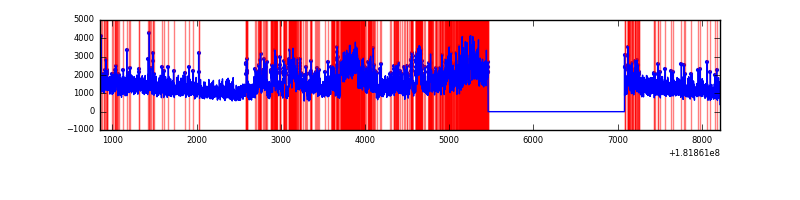 |
| B | 7364 | 5744 | 216 | 216 | 2.93% | 3.76% | 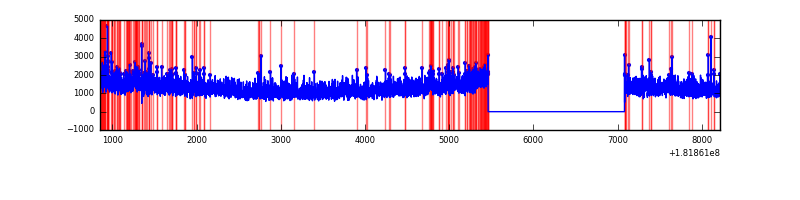 |
| C | 7364 | 5744 | 168 | 168 | 2.28% | 2.92% | 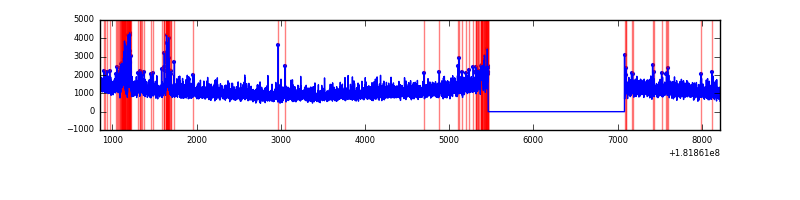 |
| D | 7364 | 5744 | 538 | 538 | 7.31% | 9.37% | 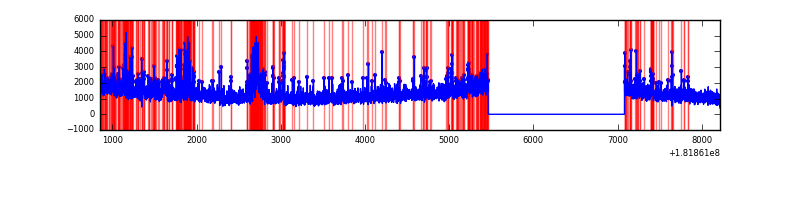 |
Top three noisy pixels from each quadrant. If the there are fewer than three noisy pixels in the level2.evt file, extra rows are filled as -1
| Pixel properties | Quadrant properties | ||||||
|---|---|---|---|---|---|---|---|
| Quadrant | DetID | PixID | Counts | Sigma | Mean | Median | Sigma |
| A | 15 | 127 | 1872453 | 6594.98 | 1745 | 1709 | 283.7 |
| A | 15 | 70 | 28143 | 93.19 | 1745 | 1709 | 283.7 |
| A | 14 | 201 | 13833 | 42.74 | 1745 | 1709 | 283.7 |
| B | 0 | 235 | 318482 | 805.16 | 1773 | 1778 | 393.3 |
| B | 8 | 236 | 97411 | 243.13 | 1773 | 1778 | 393.3 |
| B | 8 | 6 | 38246 | 92.71 | 1773 | 1778 | 393.3 |
| C | 0 | 203 | 206030 | 456.54 | 1605 | 1667 | 447.6 |
| C | 9 | 204 | 23278 | 48.28 | 1605 | 1667 | 447.6 |
| C | 0 | 189 | 12708 | 24.67 | 1605 | 1667 | 447.6 |
| D | 10 | 244 | 713028 | 1751.99 | 1665 | 1671 | 406.0 |
| D | 13 | 207 | 67587 | 162.34 | 1665 | 1671 | 406.0 |
| D | 12 | 207 | 53319 | 127.2 | 1665 | 1671 | 406.0 |
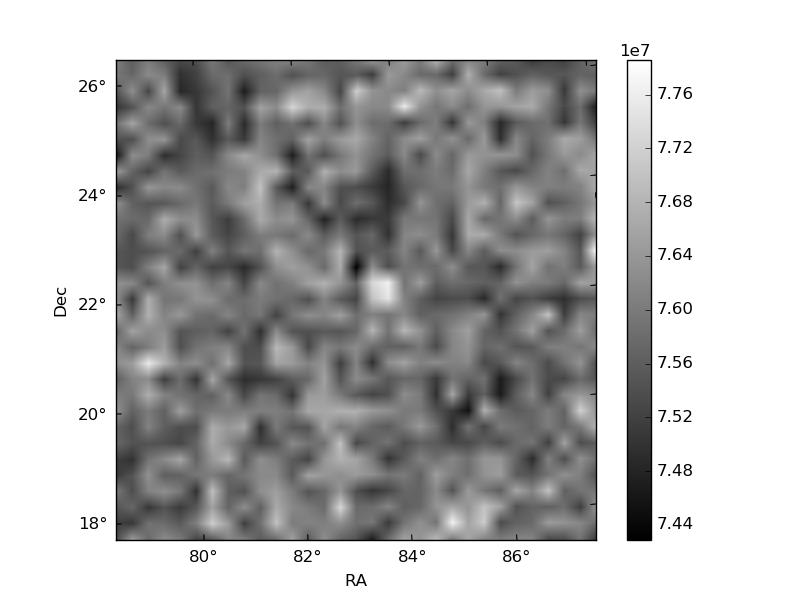
Histogram calculated using DETX and DETY for each event in the final _common_clean file
| Quadrant A |  |
 |
Quadrant B |
|---|---|---|---|
| Quadrant D |  |
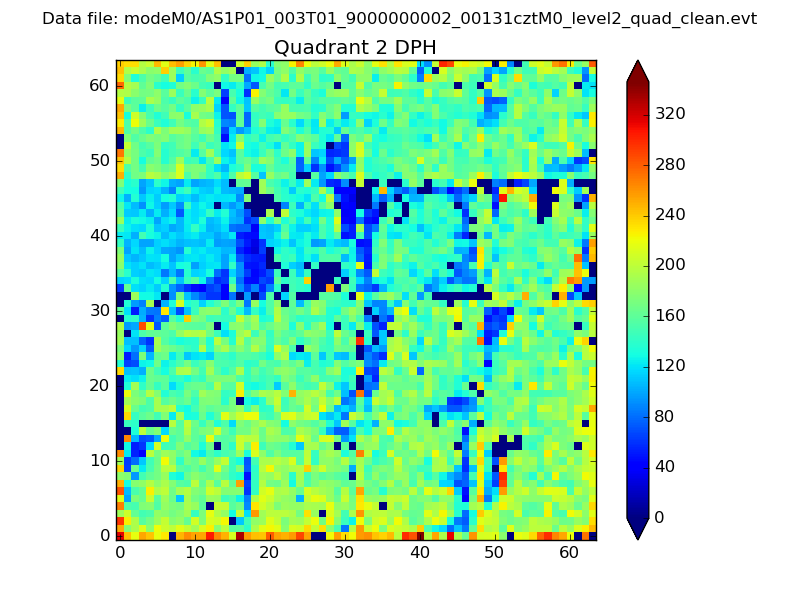 |
Quadrant C |
| Plot type | Count rate plots | Images |
|---|---|---|
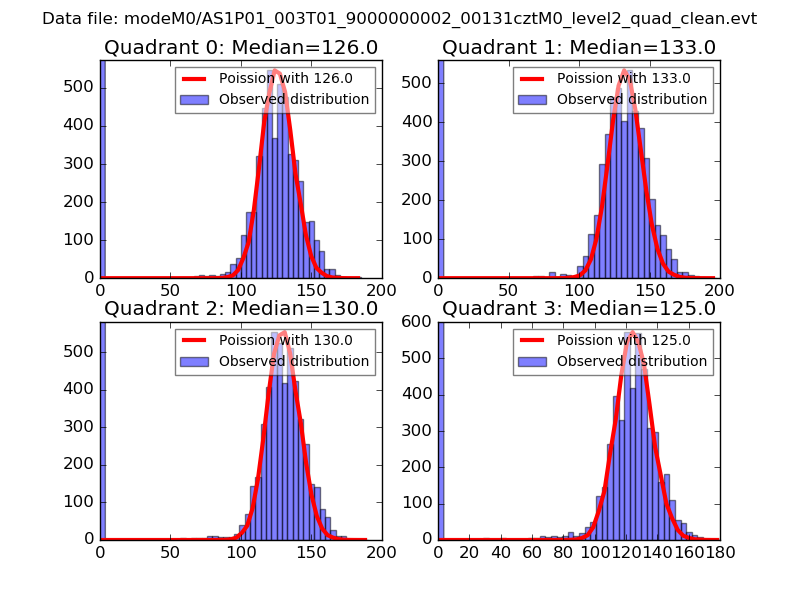
| Comparison with Poisson distribution Blue bars denote a histogram of data divided into 1 sec bins. Red curve is a Poisson curve with rate = median count rate of data. |
 |
 |
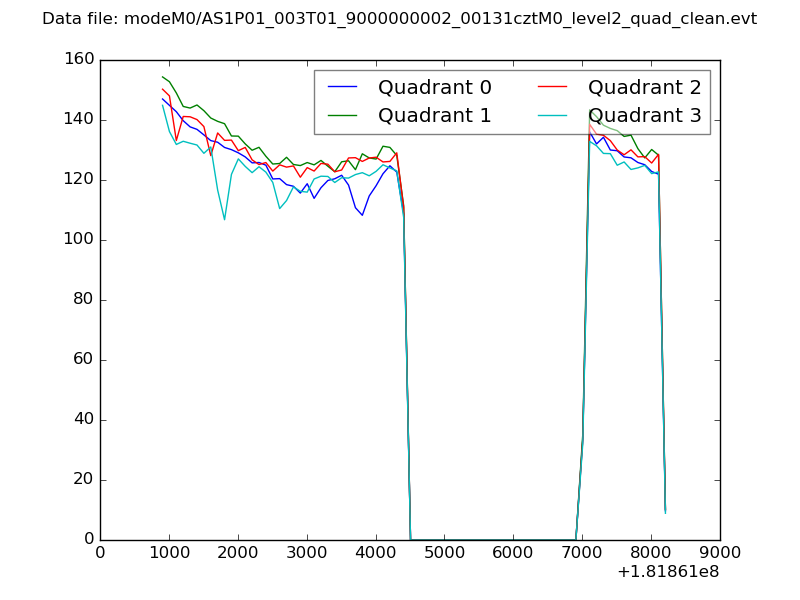
| Quadrant-wise count rates Data is divided into 100 sec bins |
 |
|
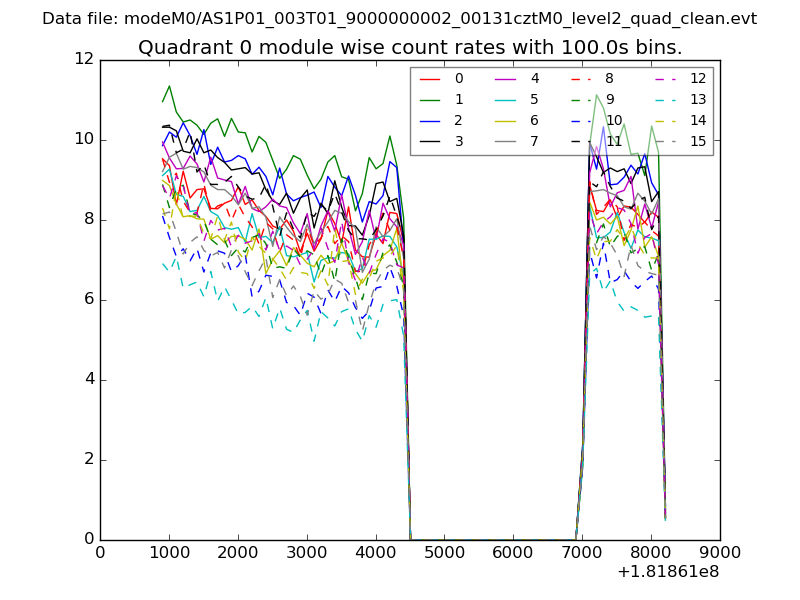
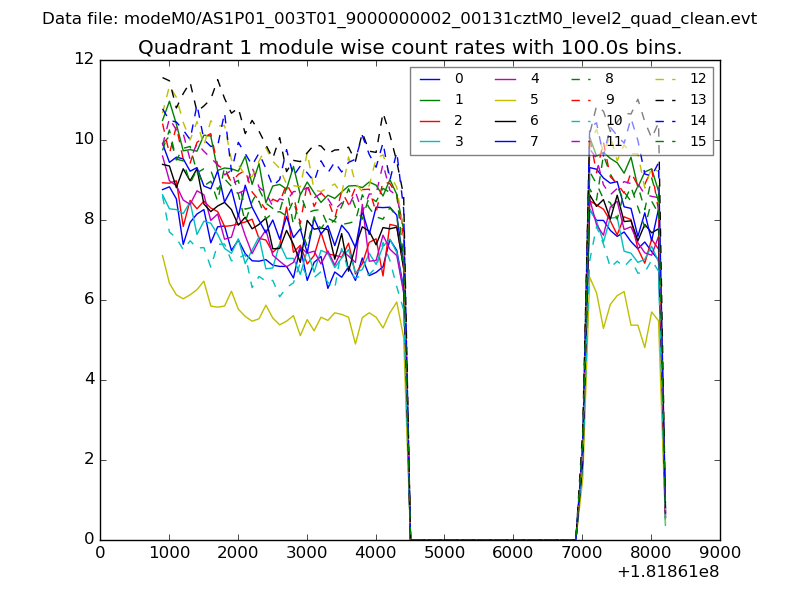
| Module-wise count rates for Quadrant A Data is divided into 100 sec bins |
 |
 |
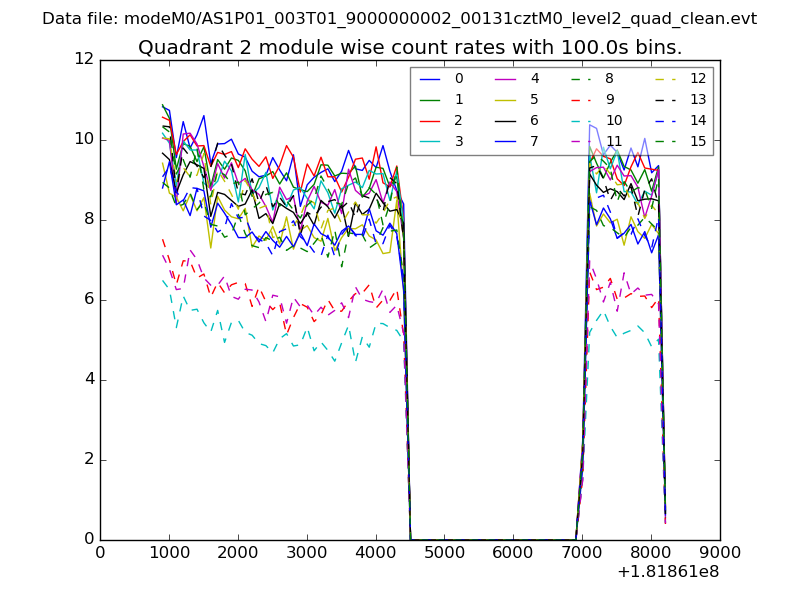
| Module-wise count rates for Quadrant B Data is divided into 100 sec bins |
 |
 |
| Module-wise count rates for Quadrant C Data is divided into 100 sec bins |
 |
 |
| Module-wise count rates for Quadrant D Data is divided into 100 sec bins |
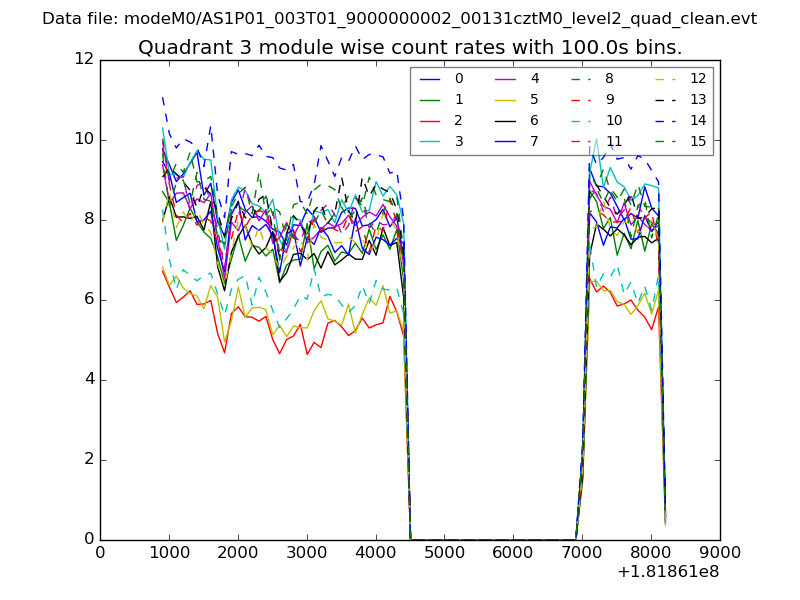 |
 |
| Parameter | Plot |
|---|---|
| CZT HV Monitor | 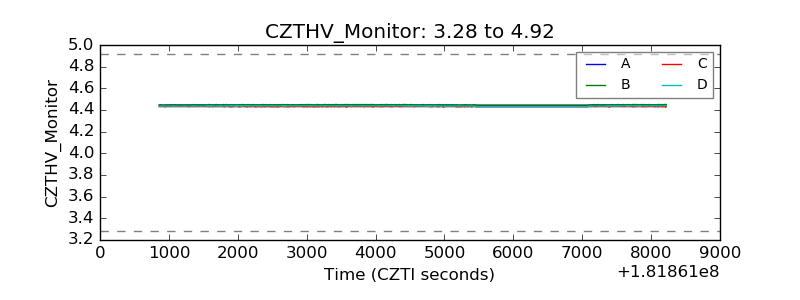 |
| D_VDD | 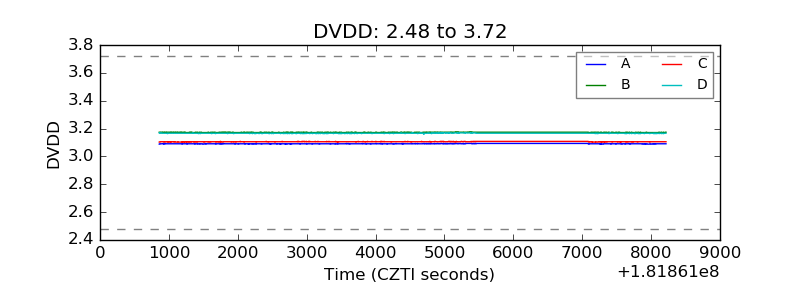 |
| Temperature 1 |  |
| Veto HV Monitor | 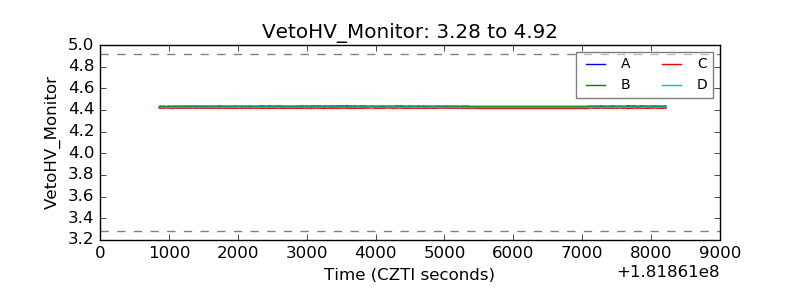 |
| Veto LLD | 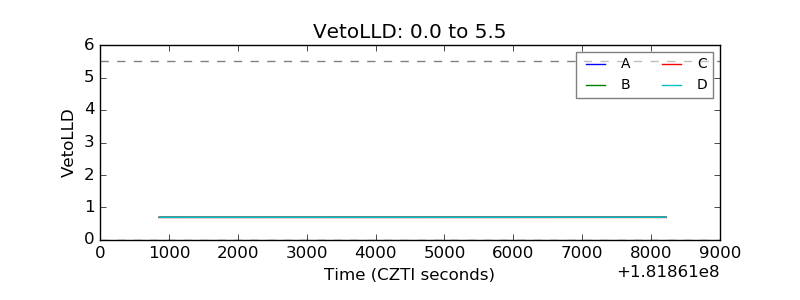 |
| Alpha Counter | 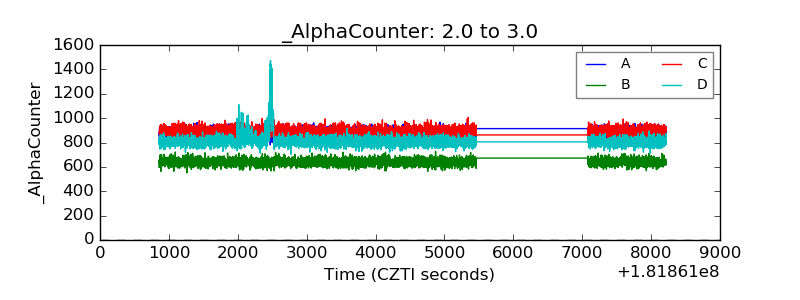 |
| _CPM_Rate | 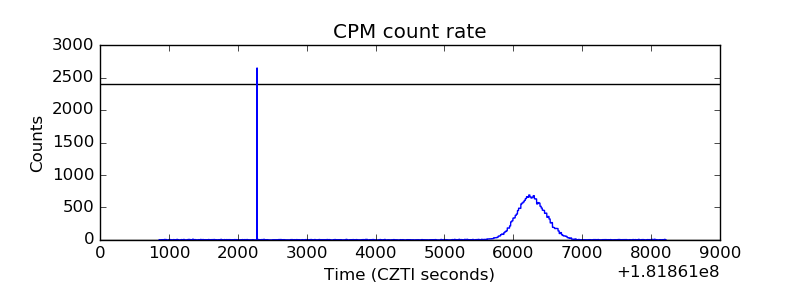 |
| CZT Counter | 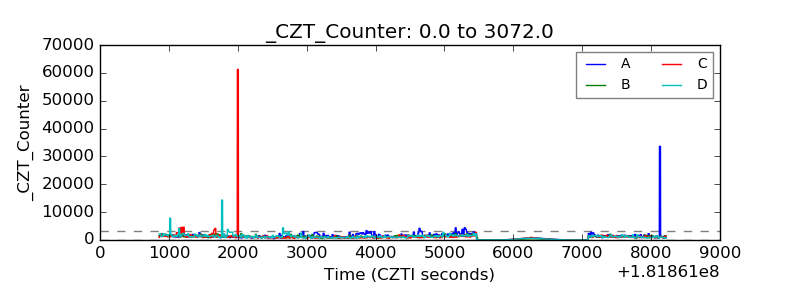 |
| +2.5 Volts monitor |  |
| +5 Volts monitor | 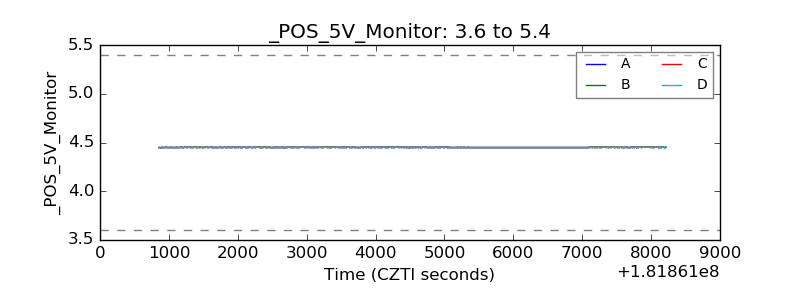 |
| _ROLL_ROT | 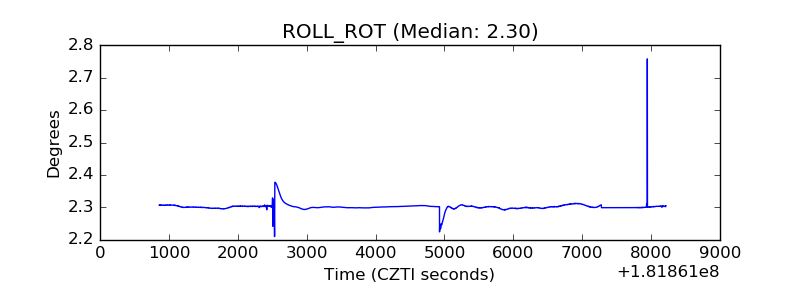 |
| _Roll_DEC | 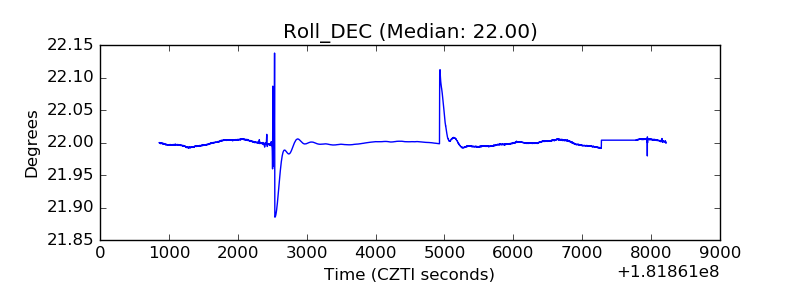 |
| _Roll_RA | 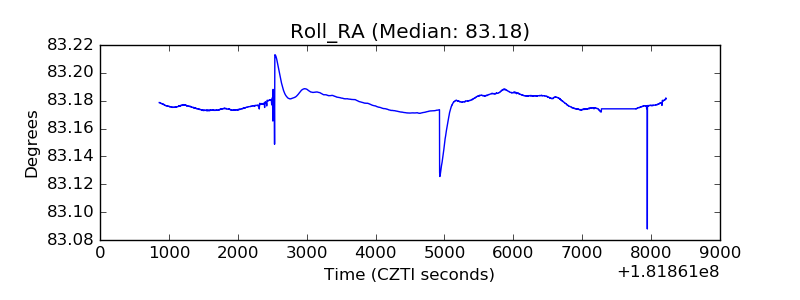 |
| Veto Counter | 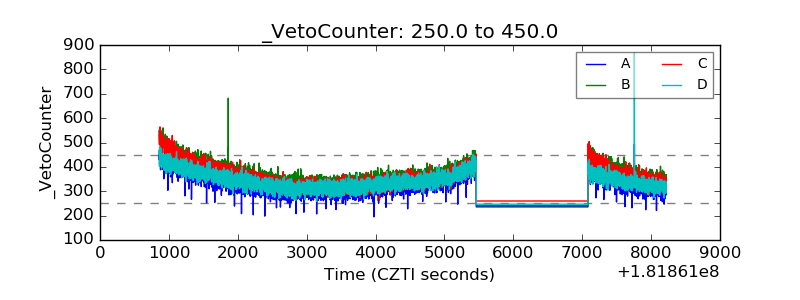 |