| Param | Original file | Final file |
|---|---|---|
| Filename | modeM0/AS1P01_003T01_9000000002_00132cztM0_level2.evt | modeM0/AS1P01_003T01_9000000002_00132cztM0_level2_quad_clean.evt |
| Size (bytes) | 540,852,480 | 50,019,840 |
| Size | 515.8 MB | 47.7 MB |
| Events in quadrant A | 4,631,354 | 317,713 |
| Events in quadrant B | 3,987,224 | 328,649 |
| Events in quadrant C | 3,529,224 | 322,806 |
| Events in quadrant D | 4,013,855 | 313,815 |
| Mode SS | |||
|---|---|---|---|
| Quadrant | BADHDUFLAG | Total packets | Discarded packets |
| A | 0 | 72 | 4 |
| B | 0 | 72 | 4 |
| C | 0 | 71 | 3 |
| D | 0 | 71 | 5 |
| Mode M9 | |||
|---|---|---|---|
| Quadrant | BADHDUFLAG | Total packets | Discarded packets |
| A | 0 | 18 | 2 |
| B | 0 | 16 | 0 |
| C | 0 | 16 | 0 |
| D | 0 | 16 | 0 |
| Mode M0 | |||
|---|---|---|---|
| Quadrant | BADHDUFLAG | Total packets | Discarded packets |
| A | 0 | 17562 | 1433 |
| B | 0 | 15331 | 1179 |
| C | 0 | 13826 | 1030 |
| D | 0 | 15396 | 1144 |
| Quadrant | Total seconds | Saturated seconds | Saturation percentage |
|---|---|---|---|
| A | 3248 | 467 | 14.378079% |
| B | 3257 | 15 | 0.460547% |
| C | 3266 | 2 | 0.061237% |
| D | 3266 | 31 | 0.949173% |
Noise dominated data is calculated using 1-second bins in cleaned event files. If a bin has >2000 counts, and if more than 50% of those come from <1% of pixels, then it is considered to be noise-dominated and hence unusable.
| Quadrant | # 1 sec bins | Bins with >0 counts | Bins with >2000 counts | High rate bins dominated by noise | Noise dominated (total time) | Noise dominated (detector-on time) | Marked lightcurve |
|---|---|---|---|---|---|---|---|
| A | 6912 | 3284 | 584 | 584 | 8.45% | 17.78% | 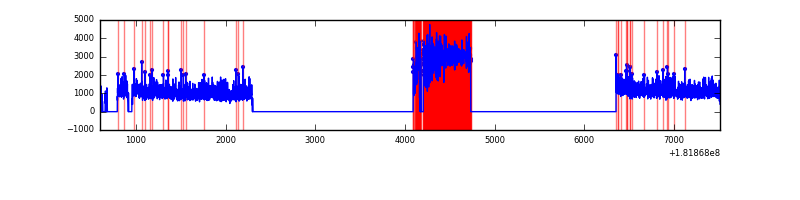 |
| B | 6912 | 3293 | 118 | 118 | 1.71% | 3.58% | 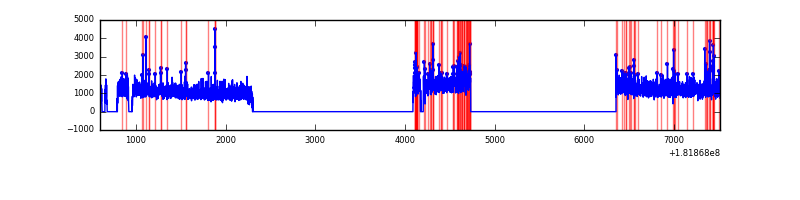 |
| C | 6906 | 3293 | 32 | 32 | 0.46% | 0.97% | 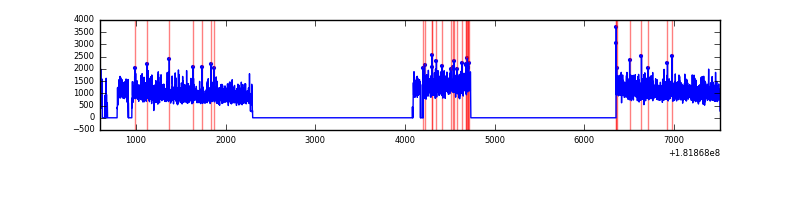 |
| D | 6913 | 3298 | 215 | 215 | 3.11% | 6.52% | 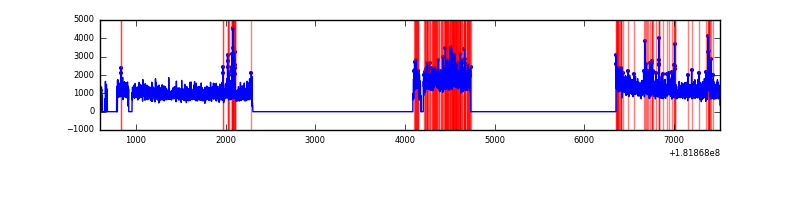 |
Top three noisy pixels from each quadrant. If the there are fewer than three noisy pixels in the level2.evt file, extra rows are filled as -1
| Pixel properties | Quadrant properties | ||||||
|---|---|---|---|---|---|---|---|
| Quadrant | DetID | PixID | Counts | Sigma | Mean | Median | Sigma |
| A | 15 | 127 | 1145061 | 7726.68 | 887 | 869 | 148.1 |
| A | 15 | 106 | 8845 | 53.86 | 887 | 869 | 148.1 |
| A | 13 | 65 | 7170 | 42.55 | 887 | 869 | 148.1 |
| B | 8 | 236 | 59654 | 274.33 | 977 | 978 | 213.9 |
| B | 5 | 216 | 58312 | 268.05 | 977 | 978 | 213.9 |
| B | 0 | 182 | 40805 | 186.2 | 977 | 978 | 213.9 |
| C | 9 | 204 | 8472 | 30.4 | 887 | 920 | 248.4 |
| C | 9 | 208 | 7840 | 27.86 | 887 | 920 | 248.4 |
| C | 0 | 188 | 5895 | 20.03 | 887 | 920 | 248.4 |
| D | 10 | 244 | 187738 | 804.8 | 894 | 905 | 232.1 |
| D | 12 | 207 | 62499 | 265.32 | 894 | 905 | 232.1 |
| D | 10 | 151 | 52947 | 224.18 | 894 | 905 | 232.1 |
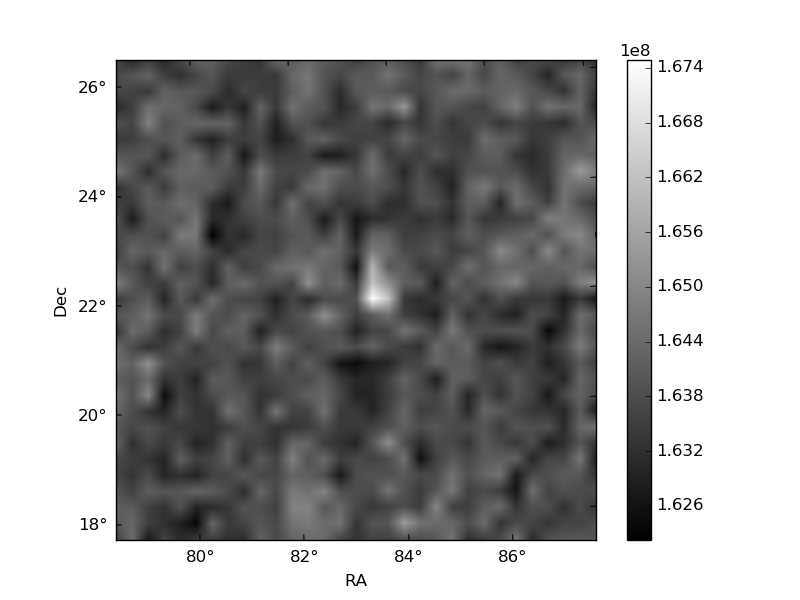
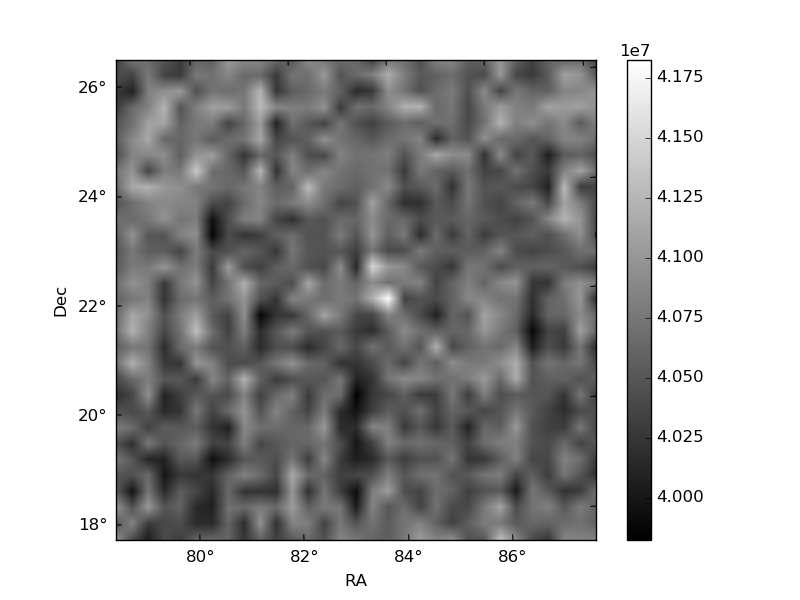
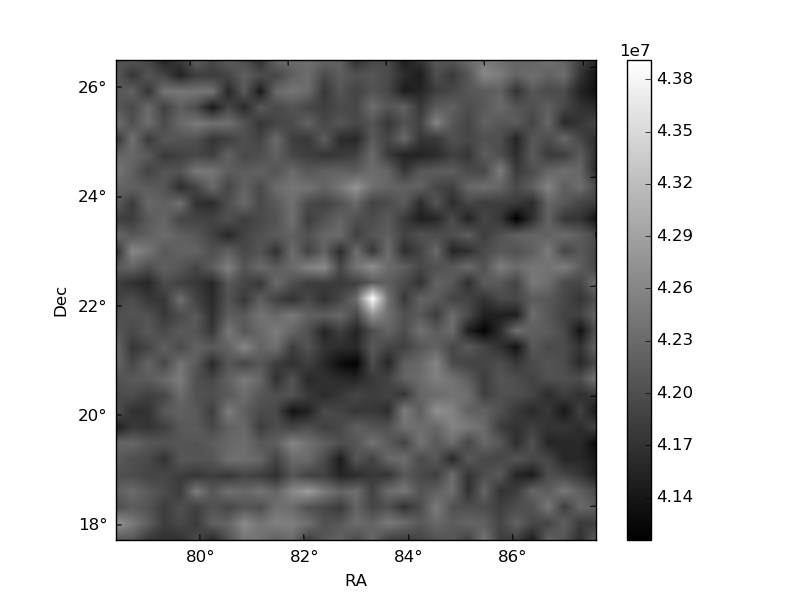
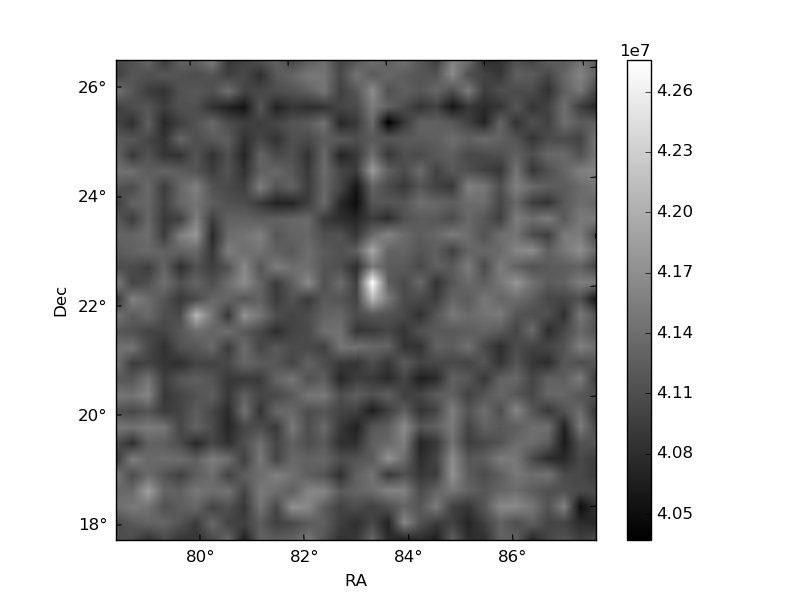
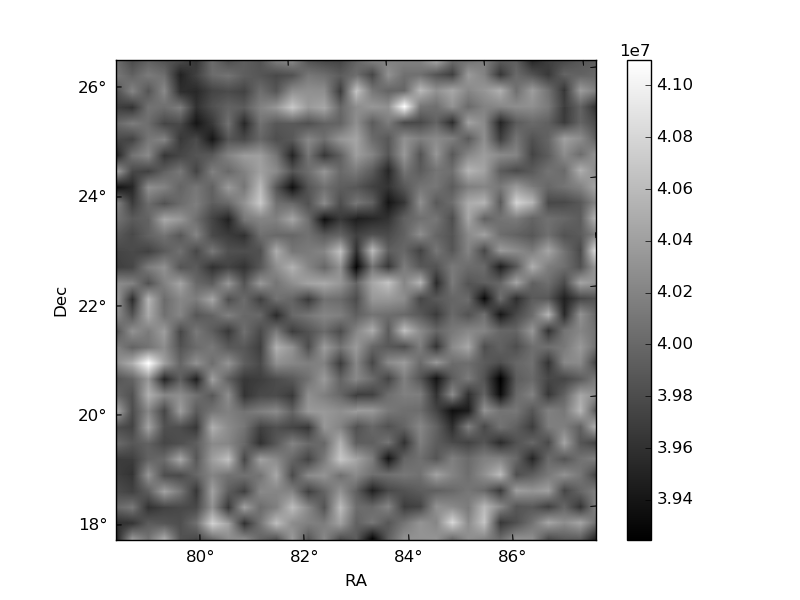
Histogram calculated using DETX and DETY for each event in the final _common_clean file
| Quadrant A | 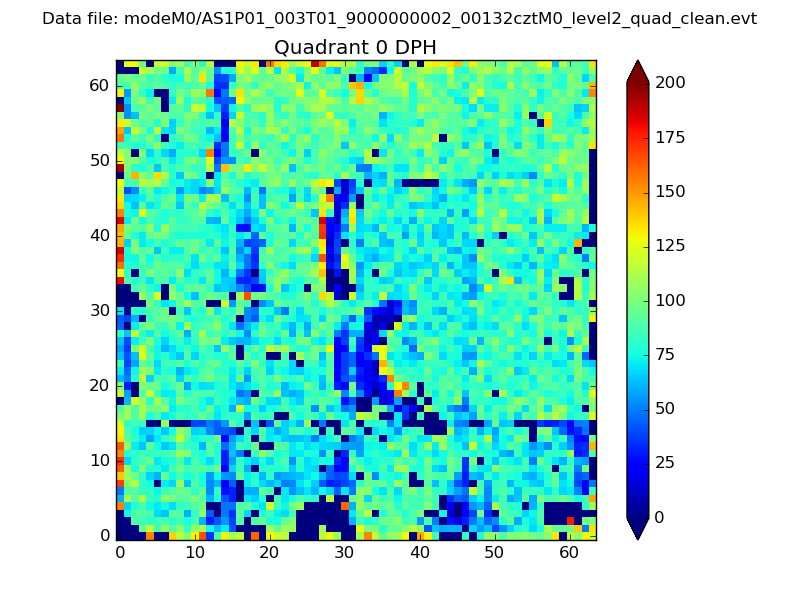 |
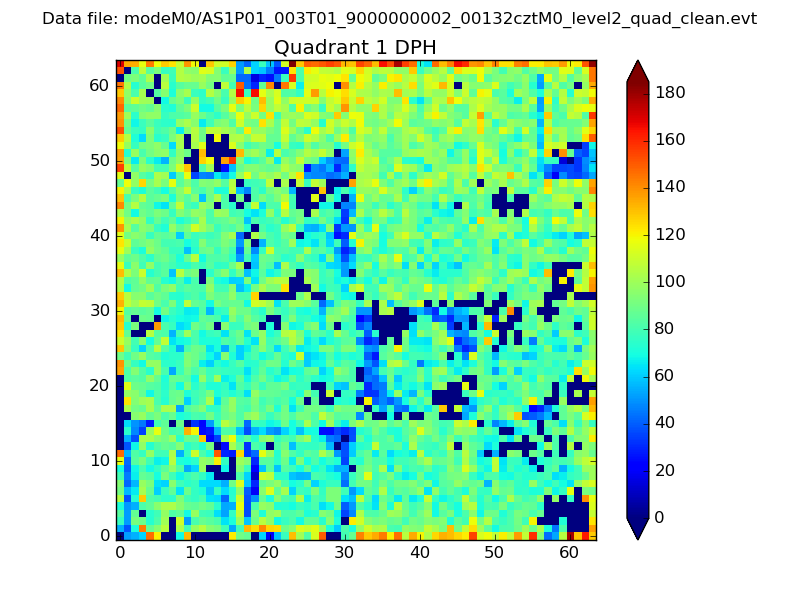 |
Quadrant B |
|---|---|---|---|
| Quadrant D | 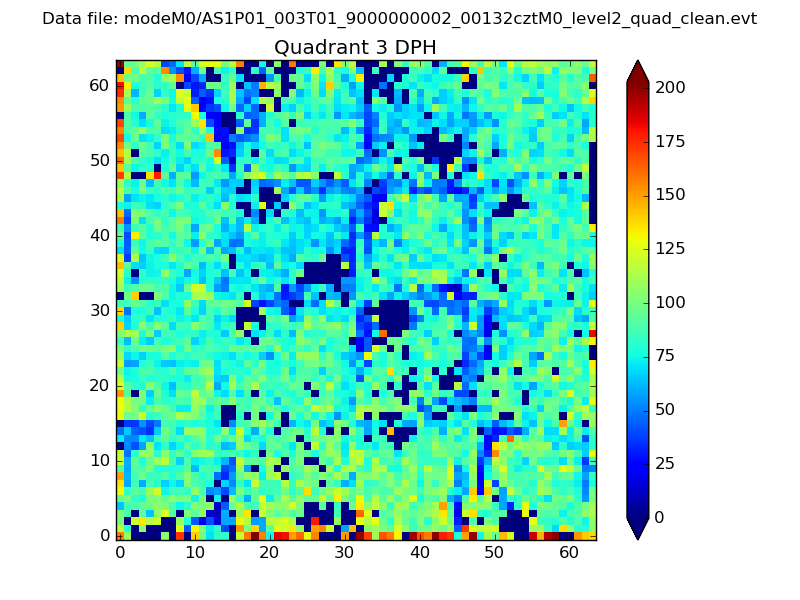 |
 |
Quadrant C |
| Plot type | Count rate plots | Images |
|---|---|---|
| Comparison with Poisson distribution Blue bars denote a histogram of data divided into 1 sec bins. Red curve is a Poisson curve with rate = median count rate of data. |
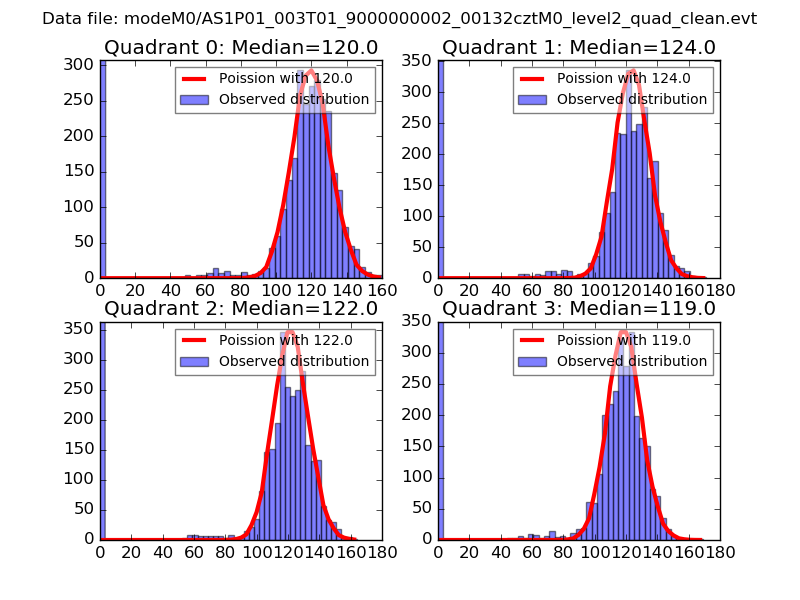 |
 |
| Quadrant-wise count rates Data is divided into 100 sec bins |
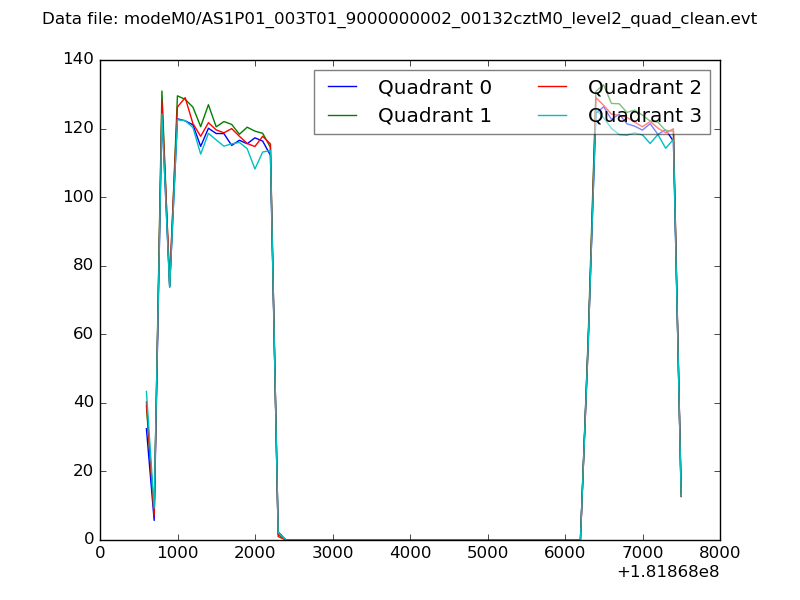 |
|
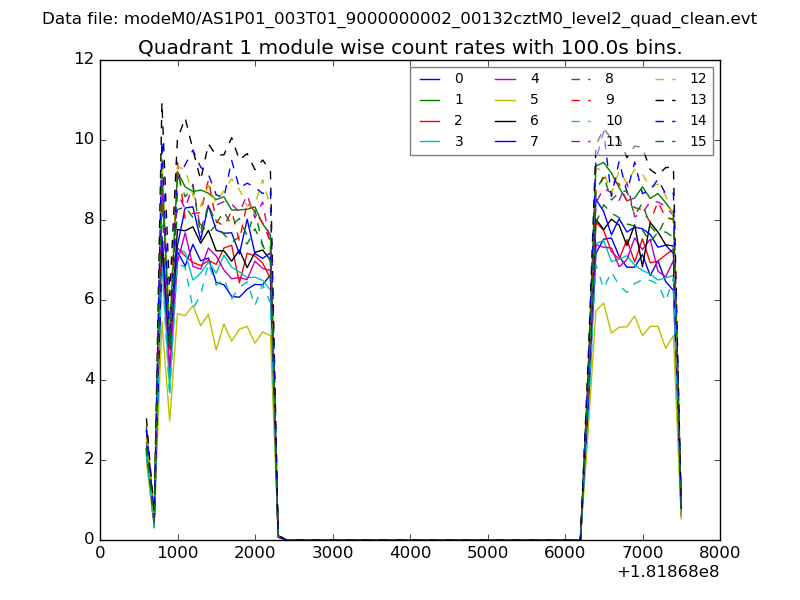
| Module-wise count rates for Quadrant A Data is divided into 100 sec bins |
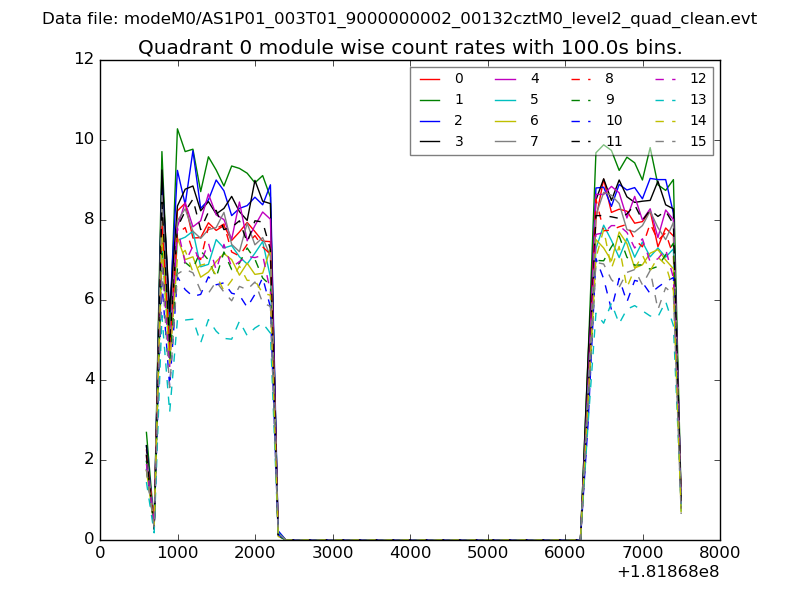 |
 |
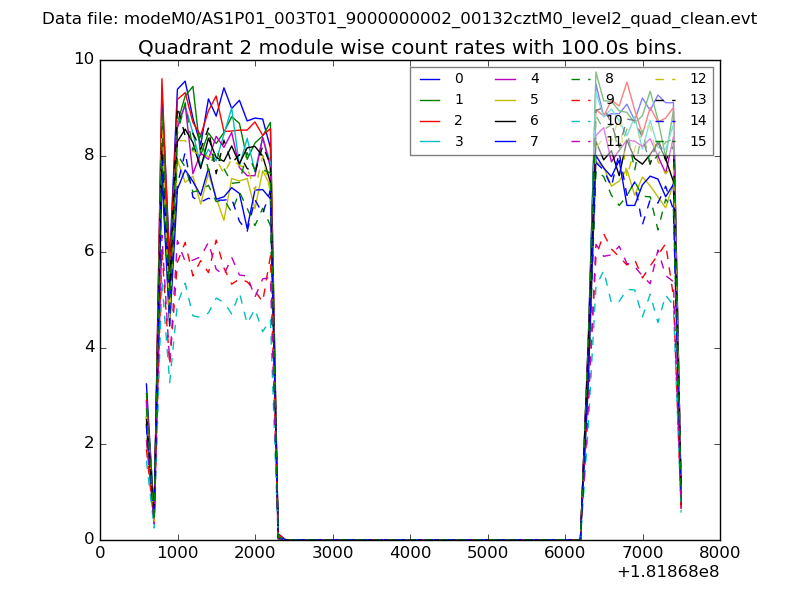
| Module-wise count rates for Quadrant B Data is divided into 100 sec bins |
 |
 |
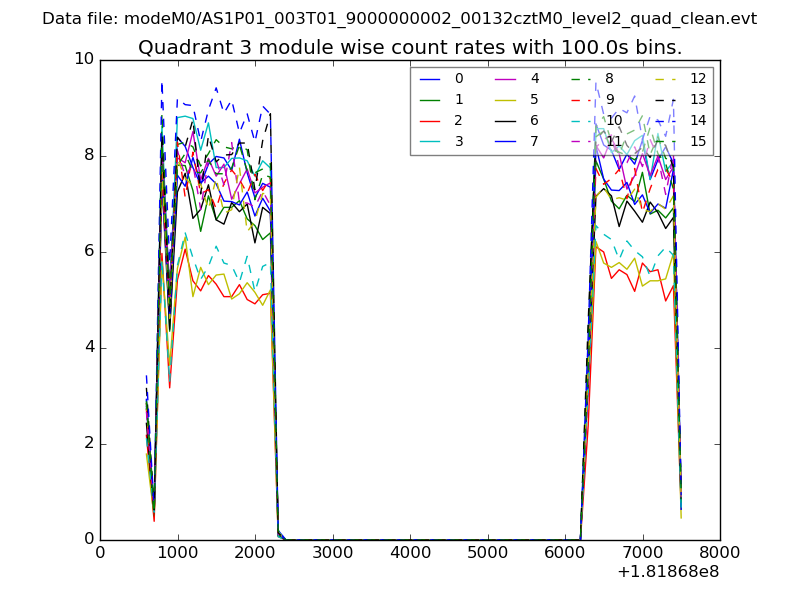
| Module-wise count rates for Quadrant C Data is divided into 100 sec bins |
 |
 |
| Module-wise count rates for Quadrant D Data is divided into 100 sec bins |
 |
 |
| Parameter | Plot |
|---|---|
| CZT HV Monitor | 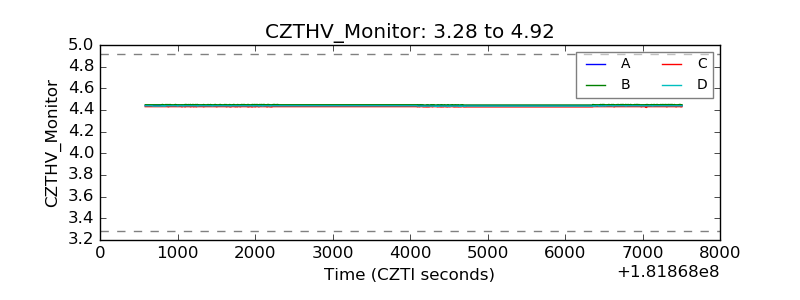 |
| D_VDD | 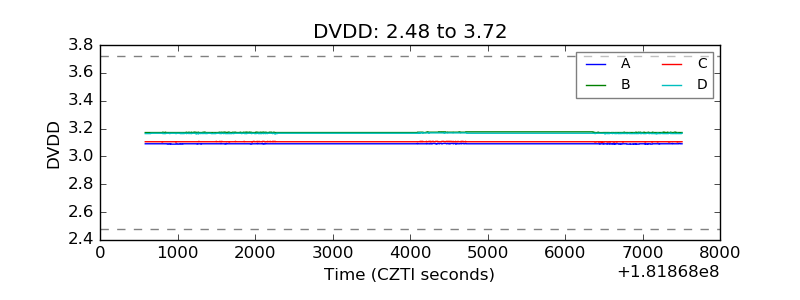 |
| Temperature 1 | 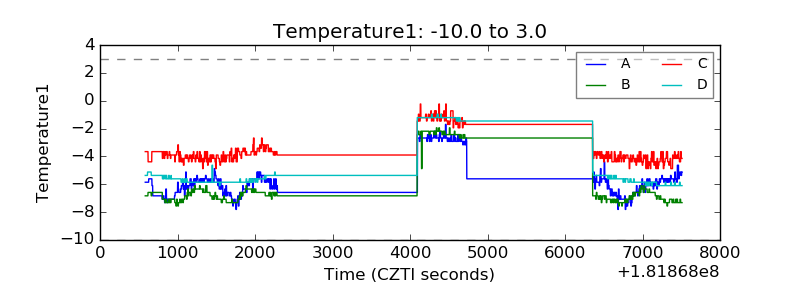 |
| Veto HV Monitor |  |
| Veto LLD | 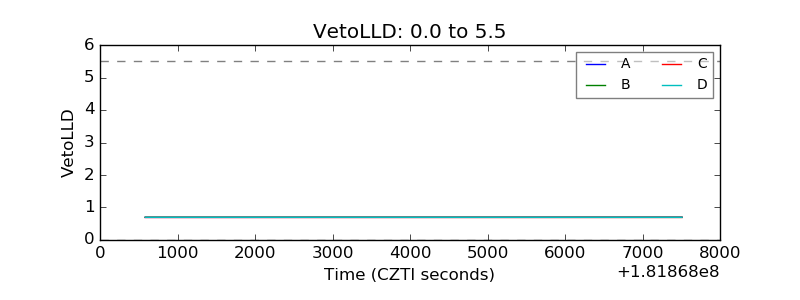 |
| Alpha Counter | 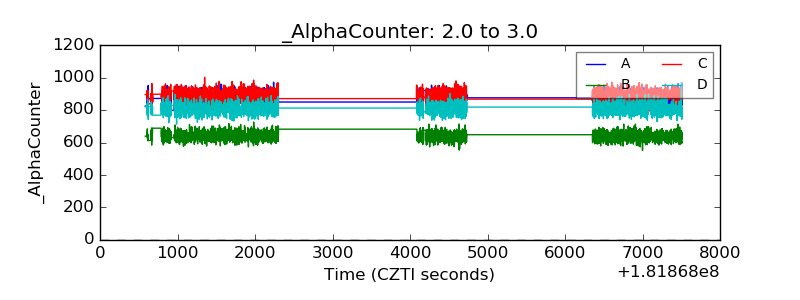 |
| _CPM_Rate | 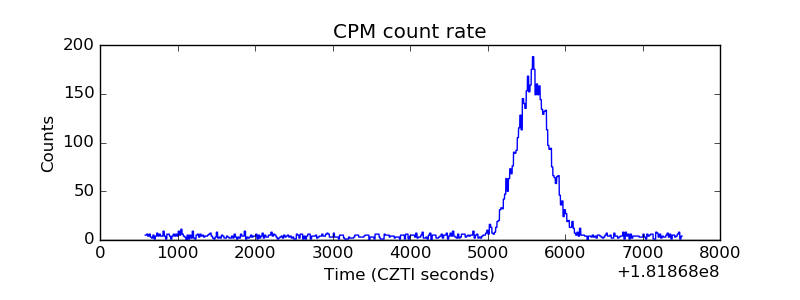 |
| CZT Counter | 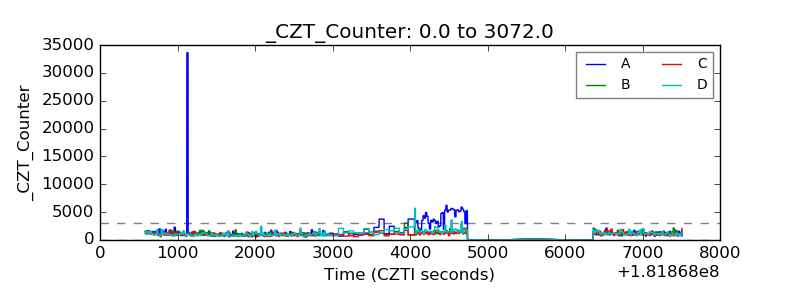 |
| +2.5 Volts monitor |  |
| +5 Volts monitor | 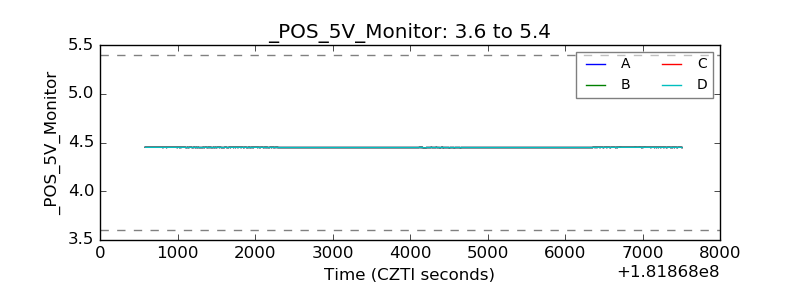 |
| _ROLL_ROT | 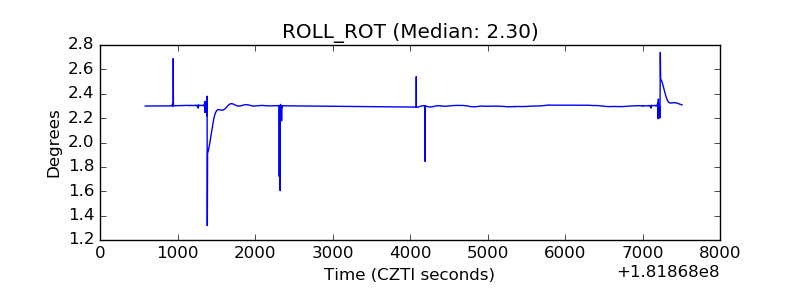 |
| _Roll_DEC | 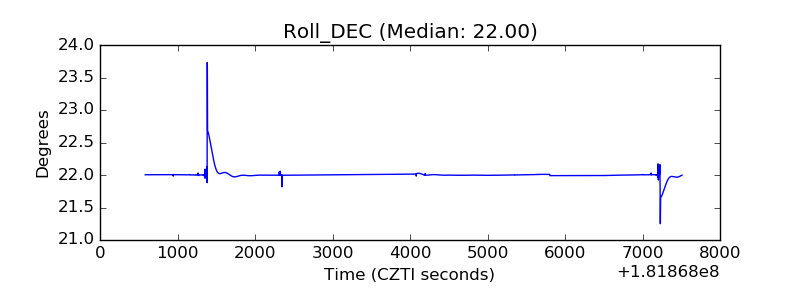 |
| _Roll_RA | 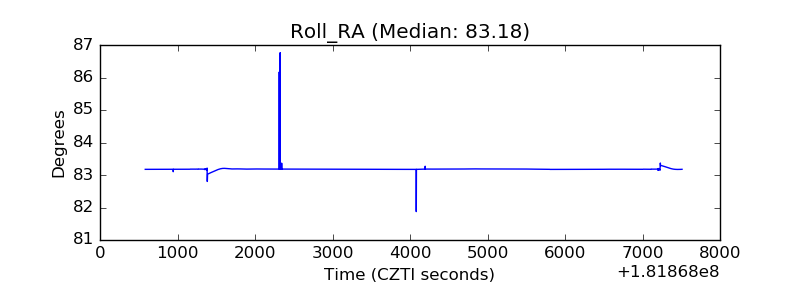 |
| Veto Counter | 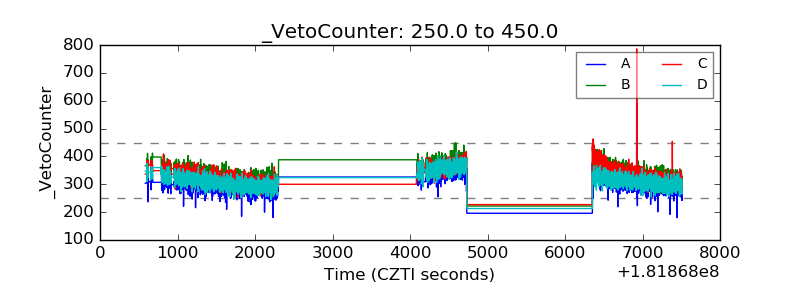 |