| Param | Original file | Final file |
|---|---|---|
| Filename | modeM0/AS1P01_003T01_9000000002_00133cztM0_level2.evt | modeM0/AS1P01_003T01_9000000002_00133cztM0_level2_quad_clean.evt |
| Size (bytes) | 937,745,280 | 75,268,800 |
| Size | 894.3 MB | 71.8 MB |
| Events in quadrant A | 6,844,432 | 465,298 |
| Events in quadrant B | 7,327,729 | 476,655 |
| Events in quadrant C | 6,202,074 | 472,560 |
| Events in quadrant D | 7,638,553 | 457,366 |
| Mode SS | |||
|---|---|---|---|
| Quadrant | BADHDUFLAG | Total packets | Discarded packets |
| A | 0 | 120 | 0 |
| B | 0 | 120 | 0 |
| C | 0 | 120 | 0 |
| D | 0 | 120 | 0 |
| Mode M9 | |||
|---|---|---|---|
| Quadrant | BADHDUFLAG | Total packets | Discarded packets |
| A | 0 | 16 | 0 |
| B | 0 | 16 | 0 |
| C | 0 | 16 | 0 |
| D | 0 | 16 | 0 |
| Mode M0 | |||
|---|---|---|---|
| Quadrant | BADHDUFLAG | Total packets | Discarded packets |
| A | 0 | 24451 | 3 |
| B | 0 | 25919 | 2 |
| C | 0 | 22589 | 2 |
| D | 0 | 26832 | 2 |
| Quadrant | Total seconds | Saturated seconds | Saturation percentage |
|---|---|---|---|
| A | 5823 | 4 | 0.068693% |
| B | 5823 | 51 | 0.875837% |
| C | 5823 | 3 | 0.051520% |
| D | 5823 | 87 | 1.494075% |
Noise dominated data is calculated using 1-second bins in cleaned event files. If a bin has >2000 counts, and if more than 50% of those come from <1% of pixels, then it is considered to be noise-dominated and hence unusable.
| Quadrant | # 1 sec bins | Bins with >0 counts | Bins with >2000 counts | High rate bins dominated by noise | Noise dominated (total time) | Noise dominated (detector-on time) | Marked lightcurve |
|---|---|---|---|---|---|---|---|
| A | 7415 | 5825 | 141 | 141 | 1.90% | 2.42% | 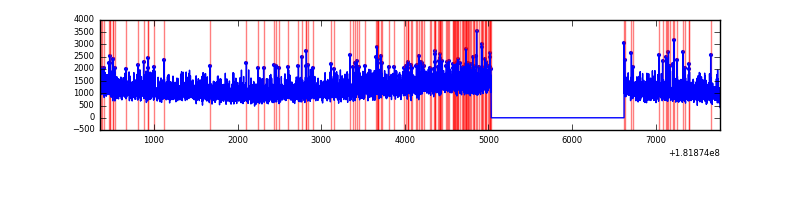 |
| B | 7415 | 5825 | 278 | 278 | 3.75% | 4.77% | 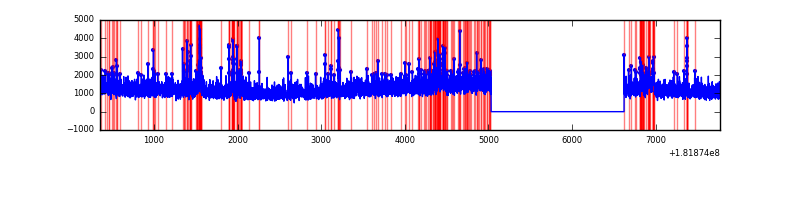 |
| C | 7415 | 5825 | 55 | 55 | 0.74% | 0.94% | 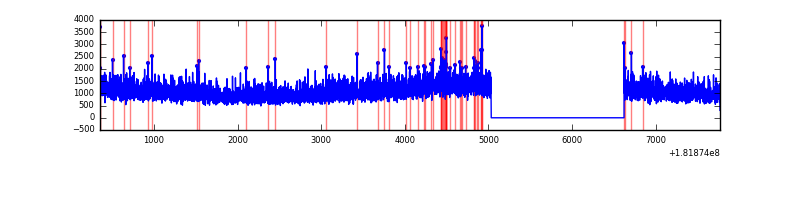 |
| D | 7415 | 5825 | 518 | 518 | 6.99% | 8.89% | 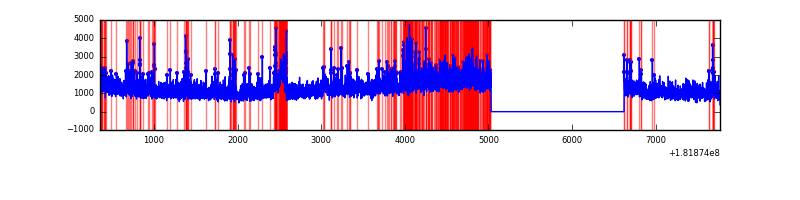 |
Top three noisy pixels from each quadrant. If the there are fewer than three noisy pixels in the level2.evt file, extra rows are filled as -1
| Pixel properties | Quadrant properties | ||||||
|---|---|---|---|---|---|---|---|
| Quadrant | DetID | PixID | Counts | Sigma | Mean | Median | Sigma |
| A | 15 | 127 | 51456 | 173.14 | 1735 | 1699 | 287.4 |
| A | 15 | 106 | 18504 | 58.48 | 1735 | 1699 | 287.4 |
| A | 14 | 187 | 13807 | 42.13 | 1735 | 1699 | 287.4 |
| B | 0 | 235 | 215842 | 562.35 | 1718 | 1721 | 380.8 |
| B | 8 | 236 | 121410 | 314.34 | 1718 | 1721 | 380.8 |
| B | 5 | 216 | 104861 | 270.88 | 1718 | 1721 | 380.8 |
| C | 2 | 192 | 11261 | 21.89 | 1561 | 1615 | 440.6 |
| C | 0 | 186 | 11070 | 21.46 | 1561 | 1615 | 440.6 |
| C | 8 | 31 | 9050 | 16.88 | 1561 | 1615 | 440.6 |
| D | 10 | 244 | 419645 | 983.83 | 1625 | 1635 | 424.9 |
| D | 1 | 55 | 127246 | 295.64 | 1625 | 1635 | 424.9 |
| D | 12 | 141 | 102643 | 237.73 | 1625 | 1635 | 424.9 |
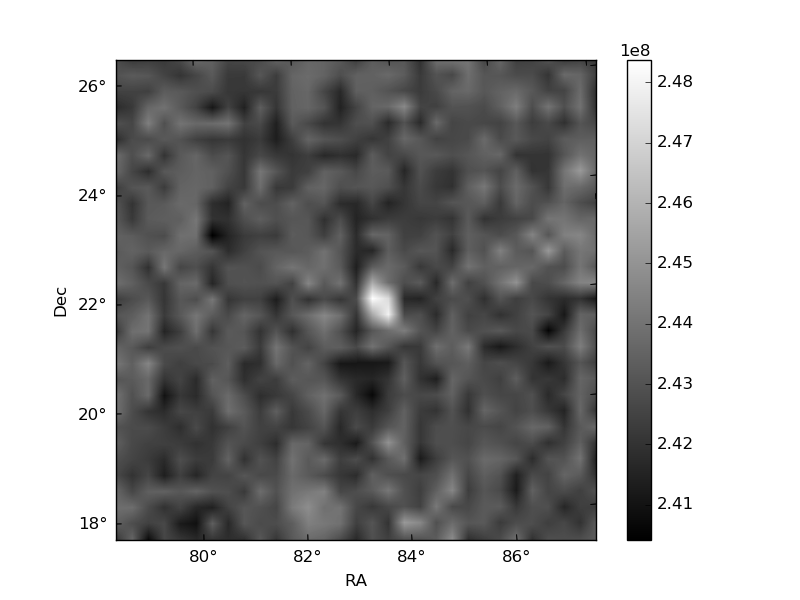
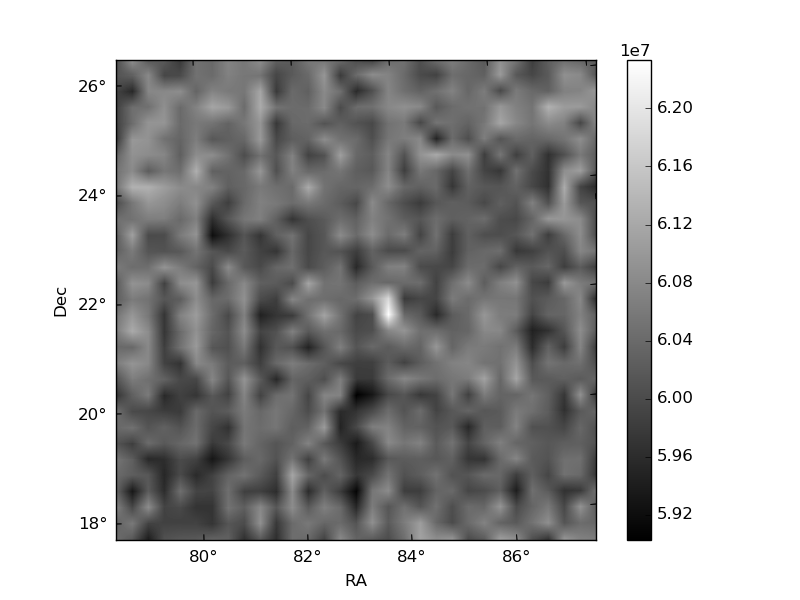
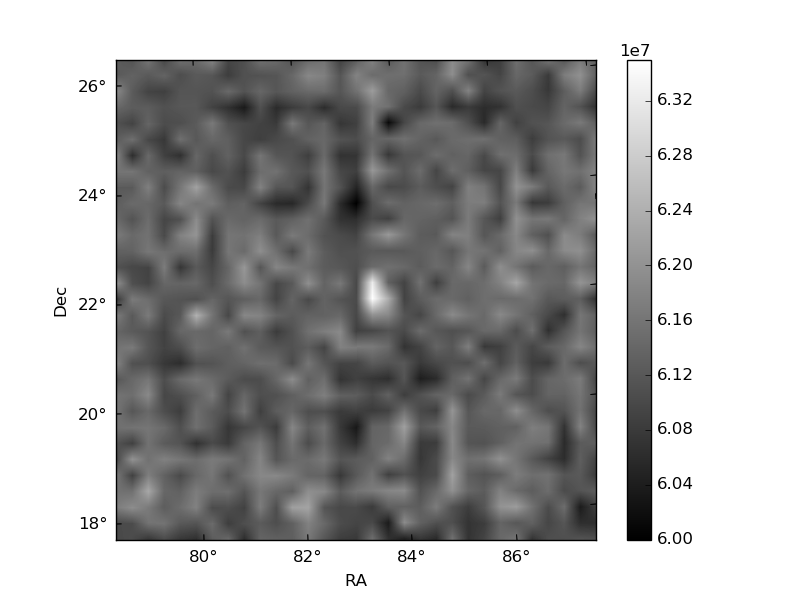
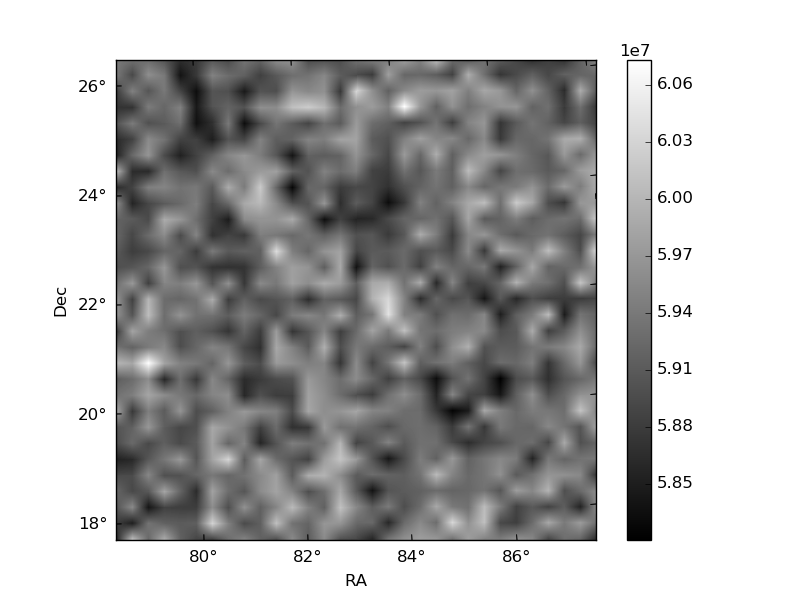
Histogram calculated using DETX and DETY for each event in the final _common_clean file
| Quadrant A | 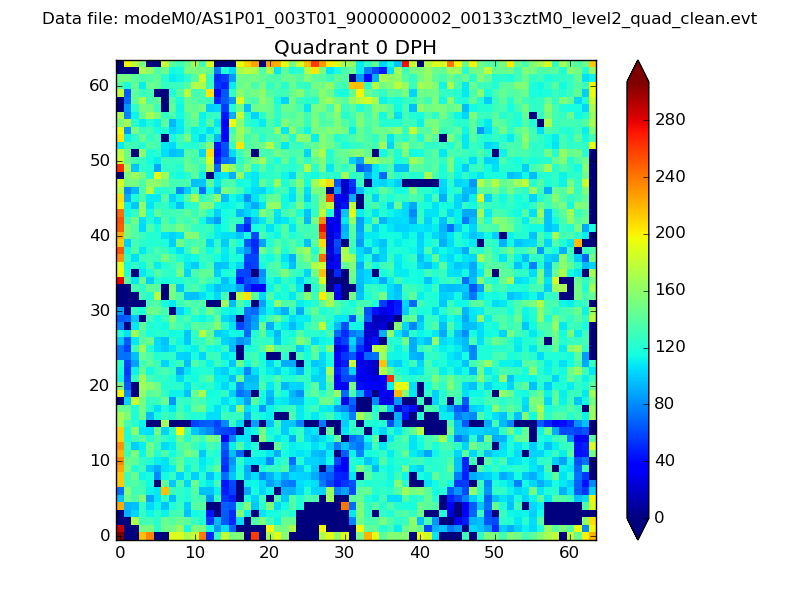 |
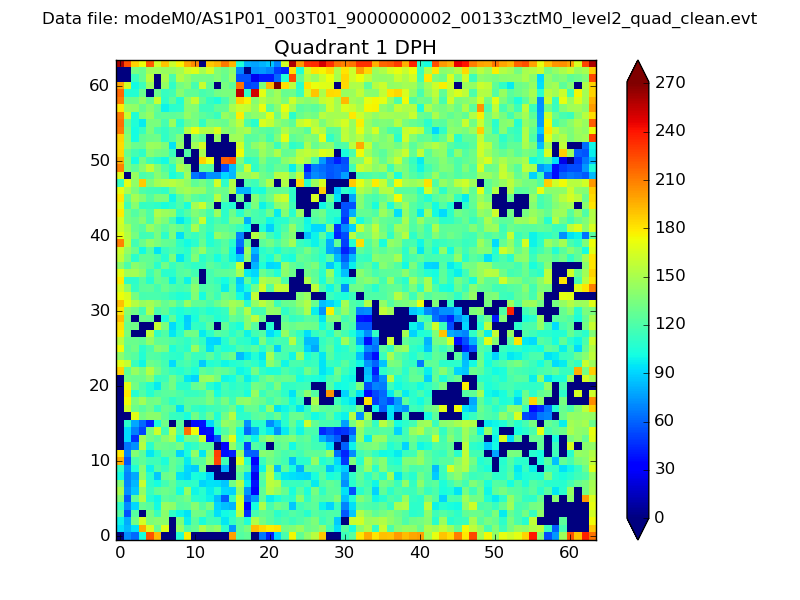 |
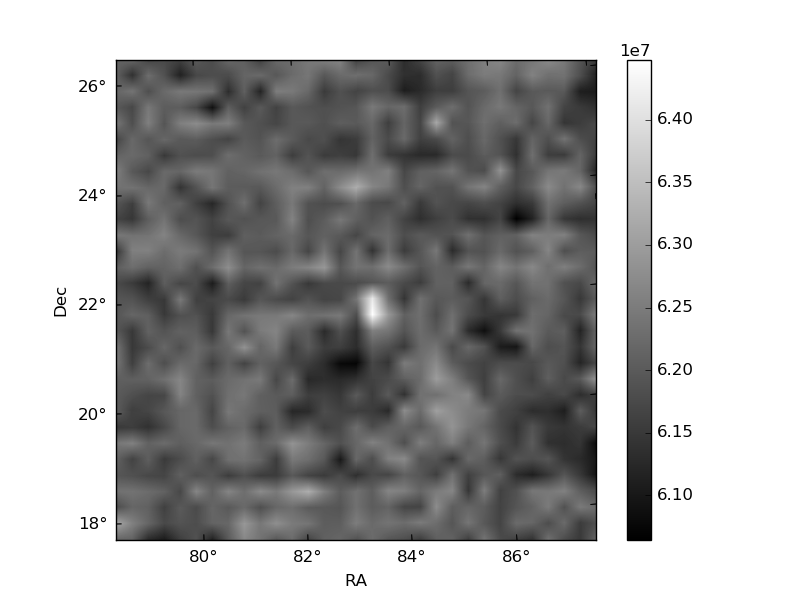
Quadrant B |
|---|---|---|---|
| Quadrant D | 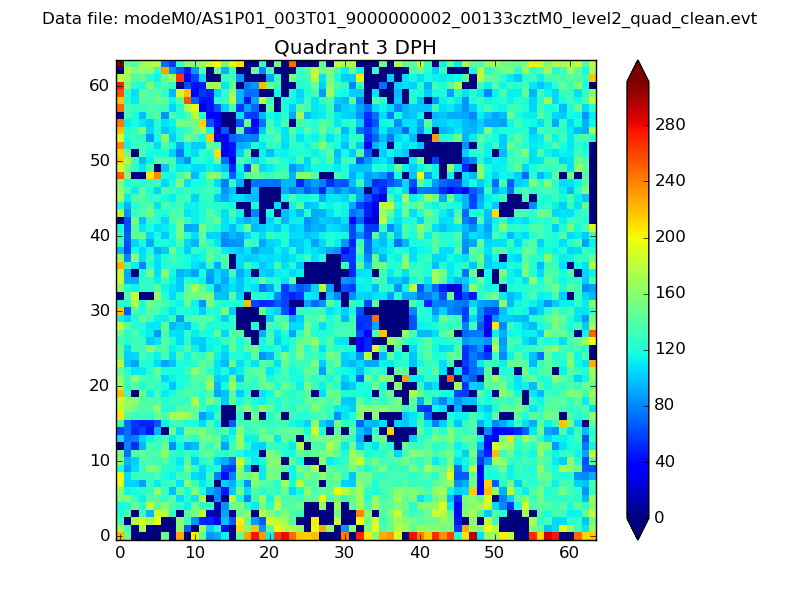 |
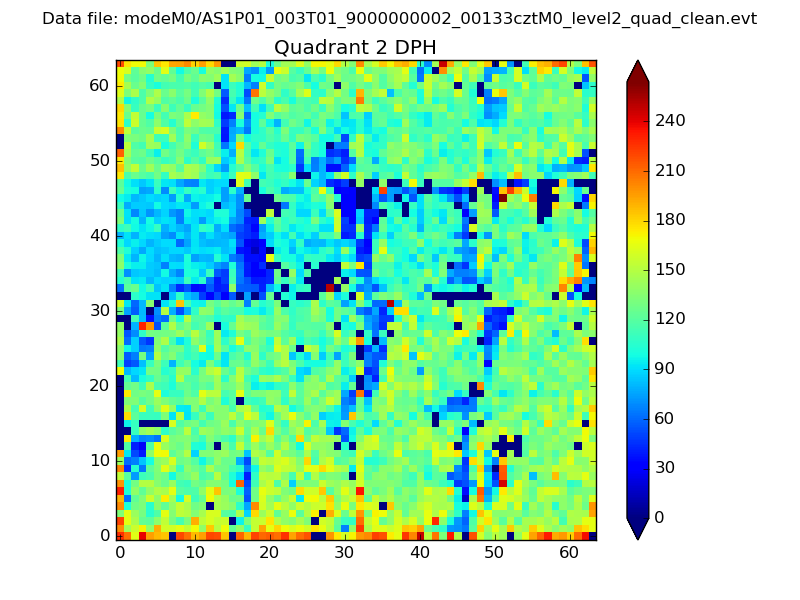 |
Quadrant C |
| Plot type | Count rate plots | Images |
|---|---|---|
| Comparison with Poisson distribution Blue bars denote a histogram of data divided into 1 sec bins. Red curve is a Poisson curve with rate = median count rate of data. |
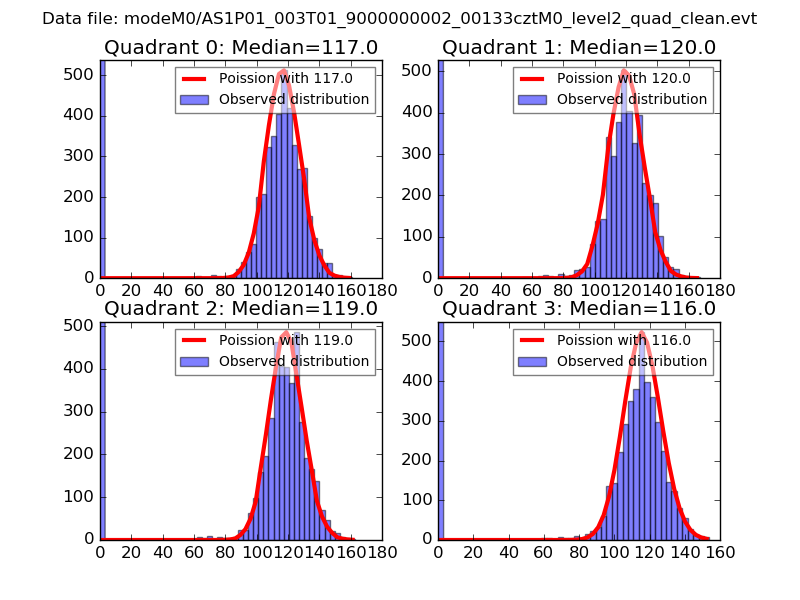 |
 |
| Quadrant-wise count rates Data is divided into 100 sec bins |
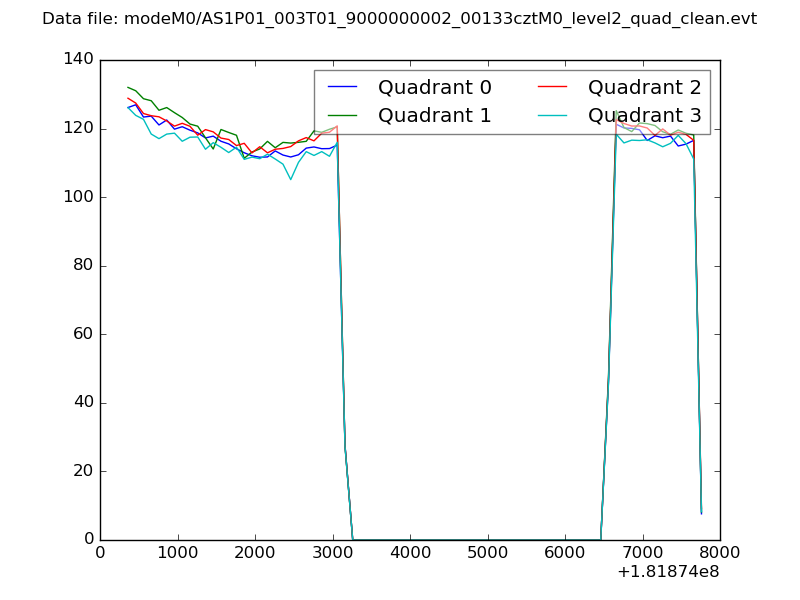 |
|
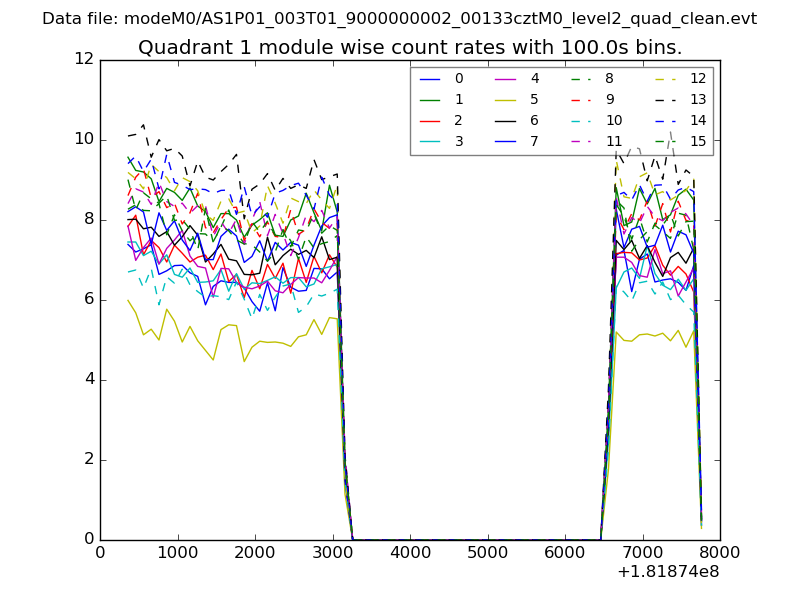
| Module-wise count rates for Quadrant A Data is divided into 100 sec bins |
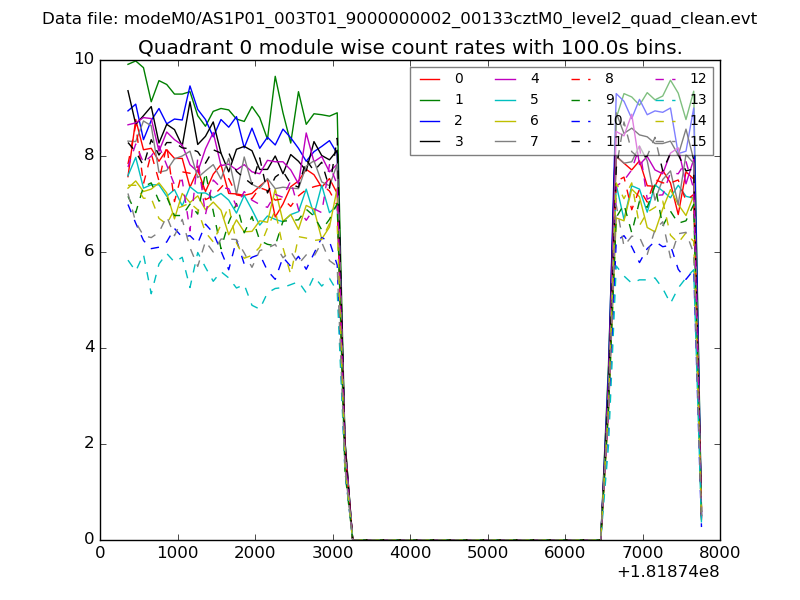 |
 |
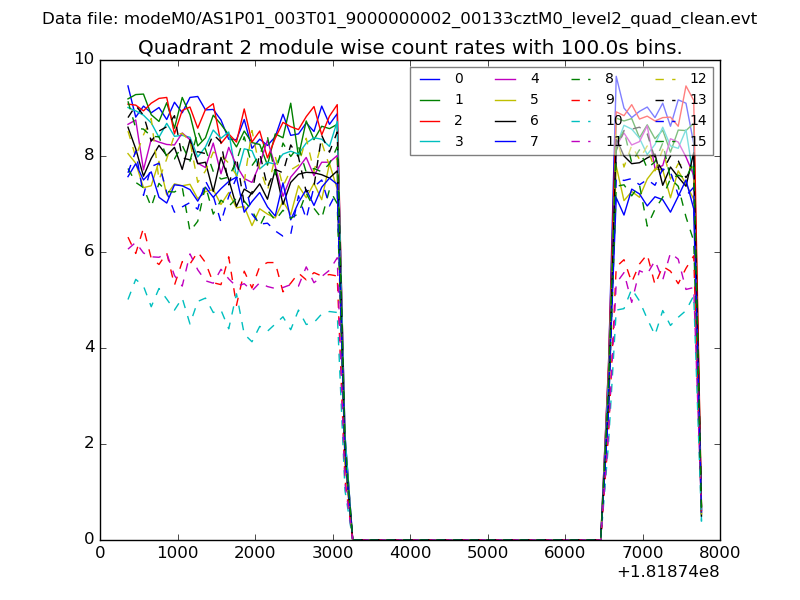
| Module-wise count rates for Quadrant B Data is divided into 100 sec bins |
 |
 |
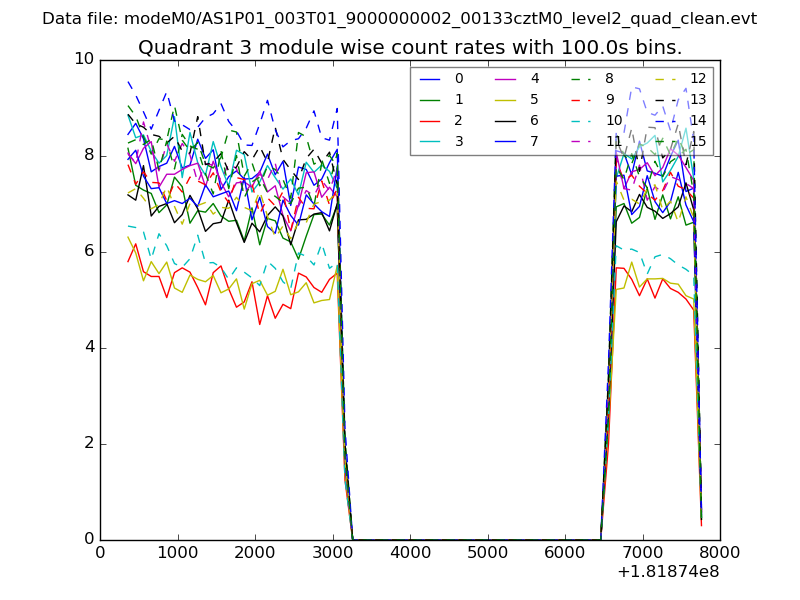
| Module-wise count rates for Quadrant C Data is divided into 100 sec bins |
 |
 |
| Module-wise count rates for Quadrant D Data is divided into 100 sec bins |
 |
 |
| Parameter | Plot |
|---|---|
| CZT HV Monitor | 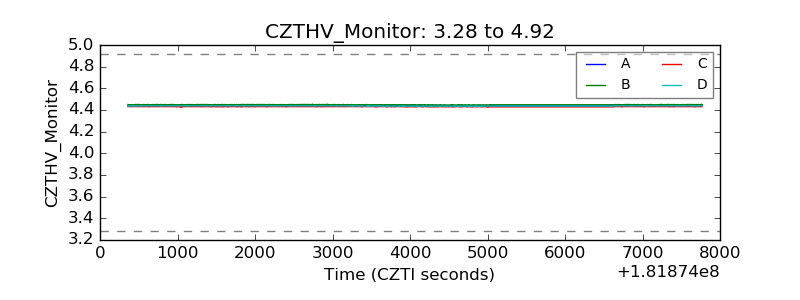 |
| D_VDD | 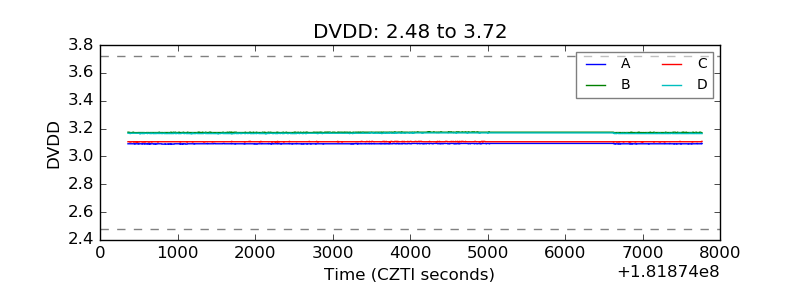 |
| Temperature 1 | 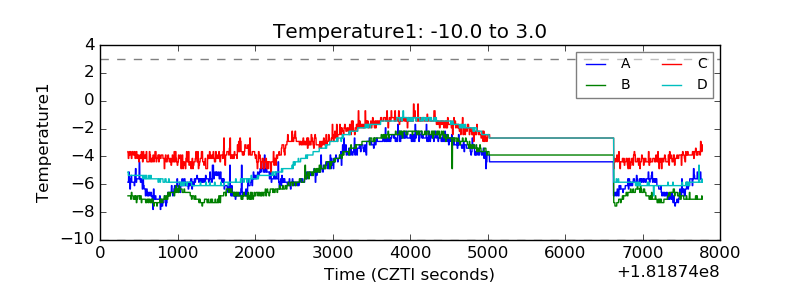 |
| Veto HV Monitor | 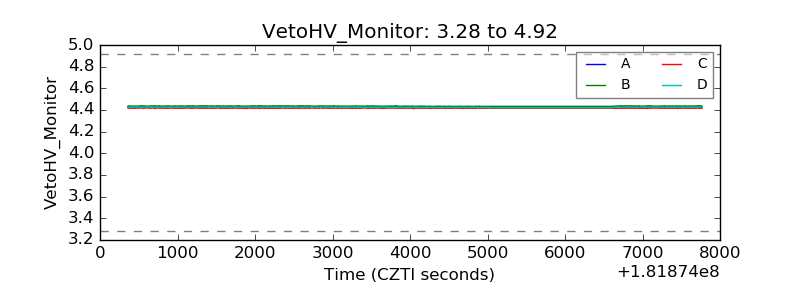 |
| Veto LLD | 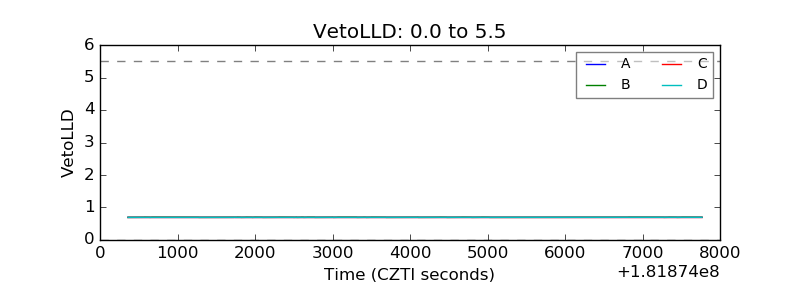 |
| Alpha Counter | 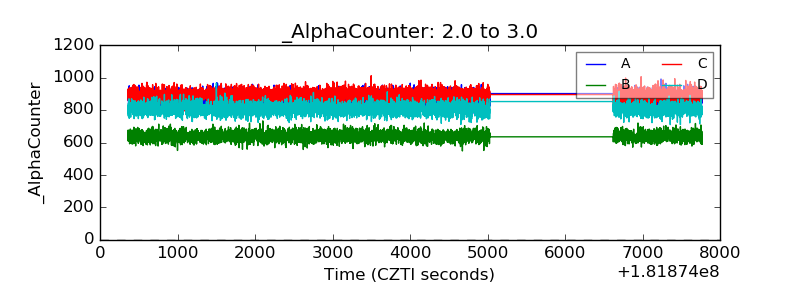 |
| _CPM_Rate | 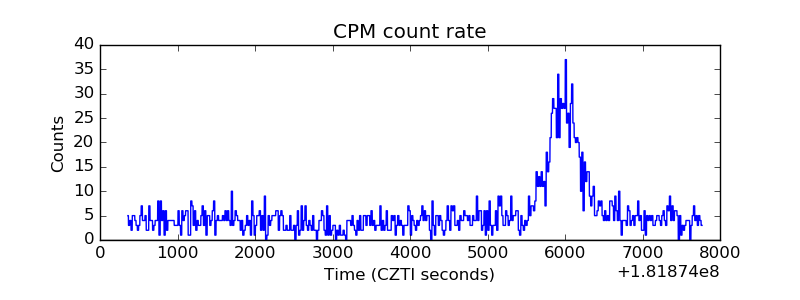 |
| CZT Counter |  |
| +2.5 Volts monitor |  |
| +5 Volts monitor |  |
| _ROLL_ROT | 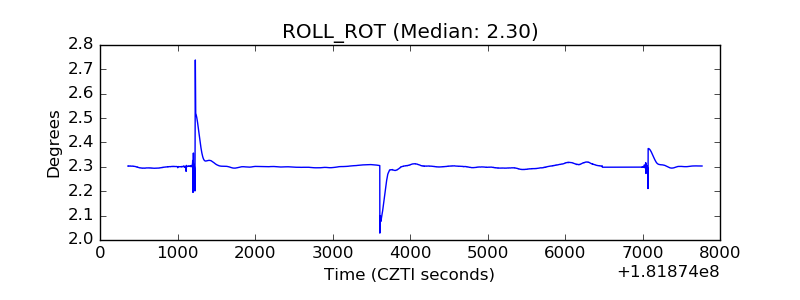 |
| _Roll_DEC | 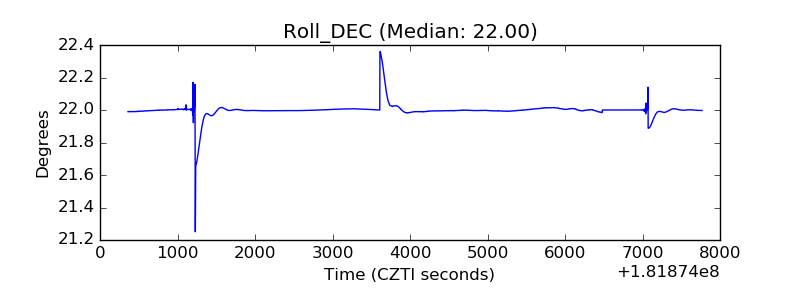 |
| _Roll_RA |  |
| Veto Counter | 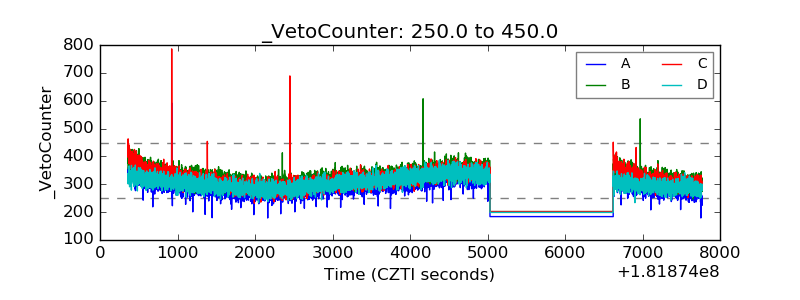 |