| Param | Original file | Final file |
|---|---|---|
| Filename | modeM0/AS1P01_003T01_9000000002_00135cztM0_level2.evt | modeM0/AS1P01_003T01_9000000002_00135cztM0_level2_quad_clean.evt |
| Size (bytes) | 688,645,440 | 41,411,520 |
| Size | 656.7 MB | 39.5 MB |
| Events in quadrant A | 5,195,663 | 234,884 |
| Events in quadrant B | 5,180,416 | 242,016 |
| Events in quadrant C | 4,624,323 | 240,096 |
| Events in quadrant D | 5,567,470 | 232,160 |
| Mode SS | |||
|---|---|---|---|
| Quadrant | BADHDUFLAG | Total packets | Discarded packets |
| A | 0 | 88 | 0 |
| B | 0 | 88 | 0 |
| C | 0 | 88 | 0 |
| D | 0 | 88 | 0 |
| Mode M9 | |||
|---|---|---|---|
| Quadrant | BADHDUFLAG | Total packets | Discarded packets |
| A | 0 | 11 | 0 |
| B | 0 | 11 | 0 |
| C | 0 | 11 | 0 |
| D | 0 | 11 | 0 |
| Mode M0 | |||
|---|---|---|---|
| Quadrant | BADHDUFLAG | Total packets | Discarded packets |
| A | 0 | 18508 | 0 |
| B | 0 | 18467 | 0 |
| C | 0 | 16826 | 0 |
| D | 0 | 19609 | 0 |
| Quadrant | Total seconds | Saturated seconds | Saturation percentage |
|---|---|---|---|
| A | 4322 | 1 | 0.023137% |
| B | 4322 | 10 | 0.231374% |
| C | 4322 | 5 | 0.115687% |
| D | 4322 | 67 | 1.550208% |
Noise dominated data is calculated using 1-second bins in cleaned event files. If a bin has >2000 counts, and if more than 50% of those come from <1% of pixels, then it is considered to be noise-dominated and hence unusable.
| Quadrant | # 1 sec bins | Bins with >0 counts | Bins with >2000 counts | High rate bins dominated by noise | Noise dominated (total time) | Noise dominated (detector-on time) | Marked lightcurve |
|---|---|---|---|---|---|---|---|
| A | 4323 | 4323 | 114 | 114 | 2.64% | 2.64% | 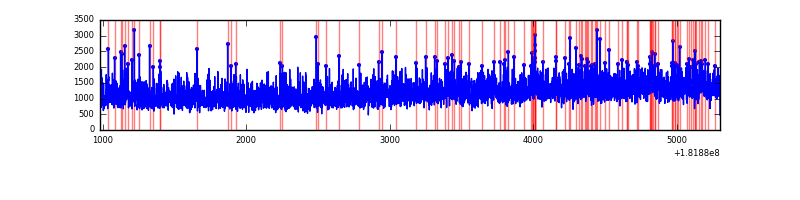 |
| B | 4323 | 4323 | 99 | 99 | 2.29% | 2.29% | 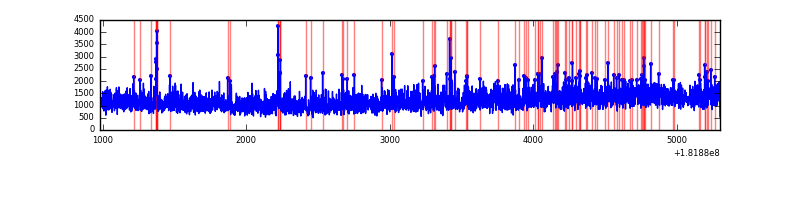 |
| C | 4323 | 4323 | 39 | 39 | 0.90% | 0.90% | 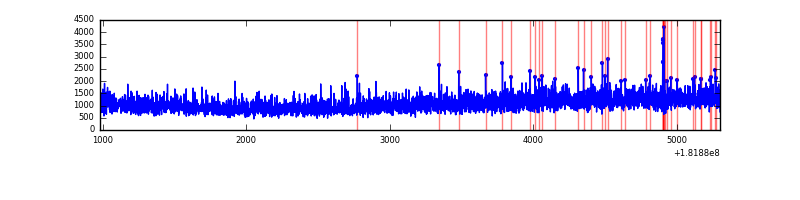 |
| D | 4323 | 4323 | 313 | 313 | 7.24% | 7.24% | 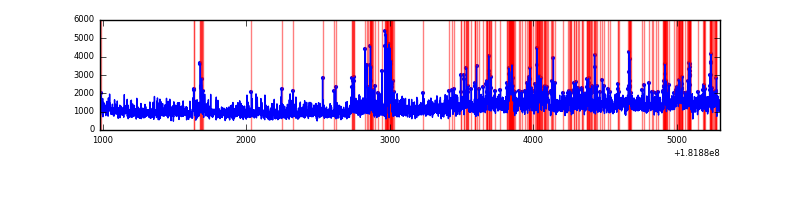 |
Top three noisy pixels from each quadrant. If the there are fewer than three noisy pixels in the level2.evt file, extra rows are filled as -1
| Pixel properties | Quadrant properties | ||||||
|---|---|---|---|---|---|---|---|
| Quadrant | DetID | PixID | Counts | Sigma | Mean | Median | Sigma |
| A | 14 | 171 | 19668 | 83.19 | 1327 | 1294 | 220.9 |
| A | 14 | 187 | 10925 | 43.6 | 1327 | 1294 | 220.9 |
| A | 13 | 239 | 9782 | 38.43 | 1327 | 1294 | 220.9 |
| B | 8 | 236 | 84147 | 285.7 | 1286 | 1291 | 290.0 |
| B | 5 | 216 | 31257 | 103.33 | 1286 | 1291 | 290.0 |
| B | 0 | 236 | 21233 | 68.76 | 1286 | 1291 | 290.0 |
| C | 0 | 186 | 21136 | 60.29 | 1164 | 1204 | 330.6 |
| C | 3 | 32 | 10727 | 28.8 | 1164 | 1204 | 330.6 |
| C | 10 | 20 | 9744 | 25.83 | 1164 | 1204 | 330.6 |
| D | 12 | 207 | 195443 | 583.52 | 1245 | 1251 | 332.8 |
| D | 13 | 207 | 104808 | 311.17 | 1245 | 1251 | 332.8 |
| D | 13 | 223 | 67294 | 198.45 | 1245 | 1251 | 332.8 |
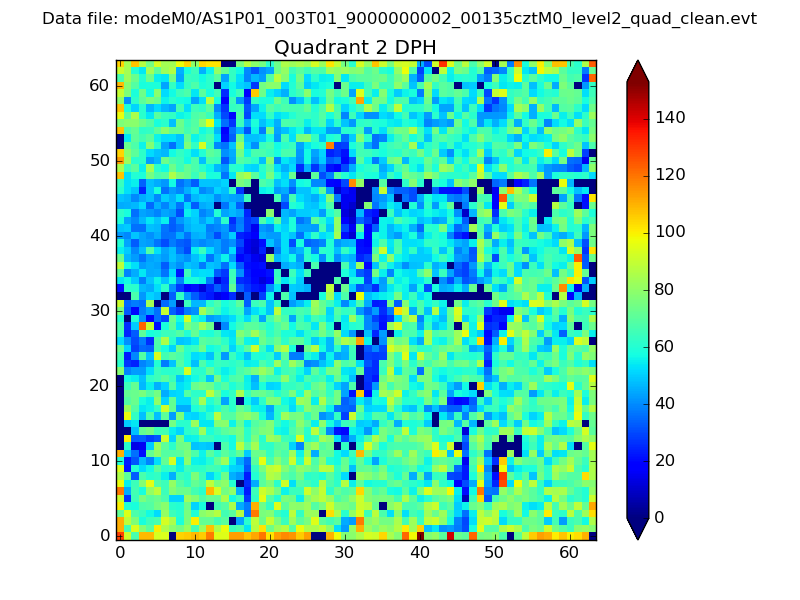
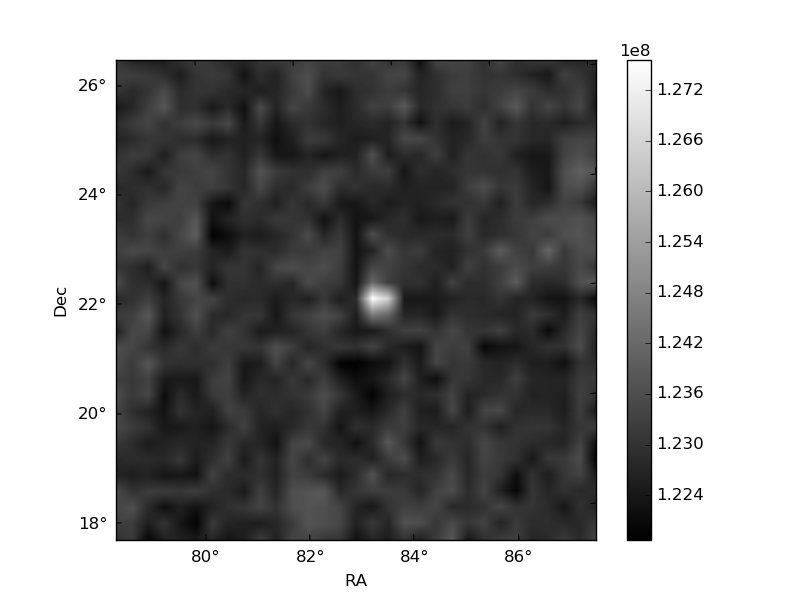
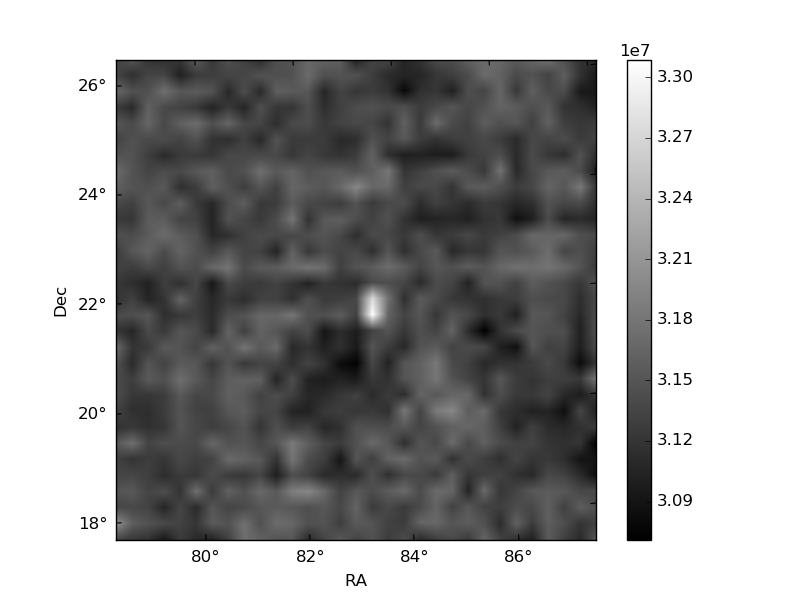
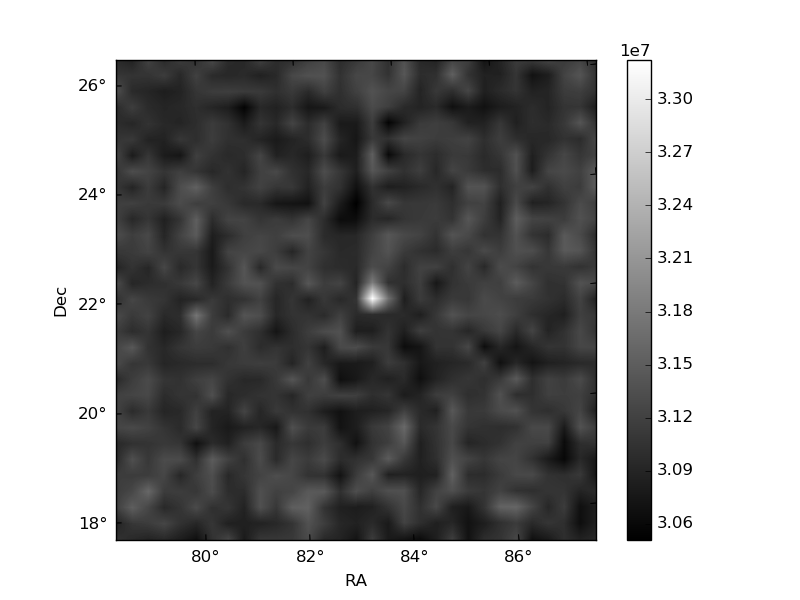
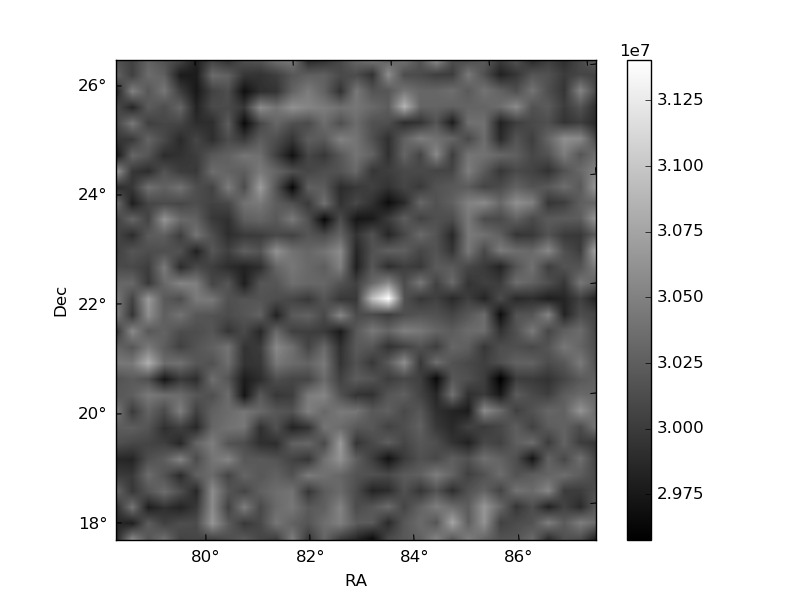
Histogram calculated using DETX and DETY for each event in the final _common_clean file
| Quadrant A | 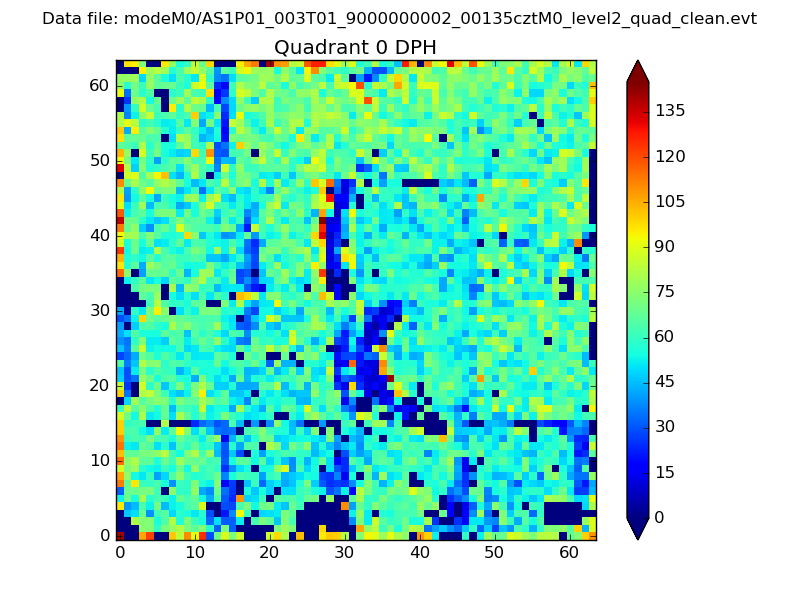 |
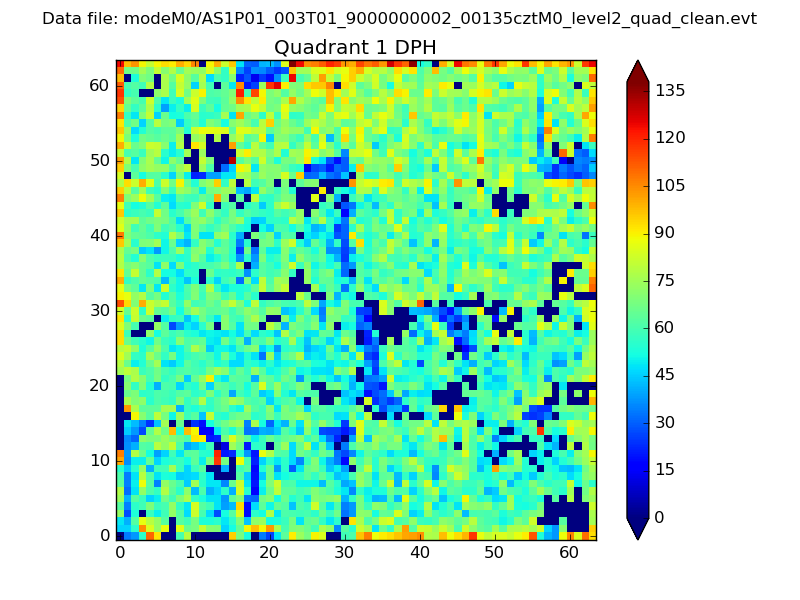 |
Quadrant B |
|---|---|---|---|
| Quadrant D | 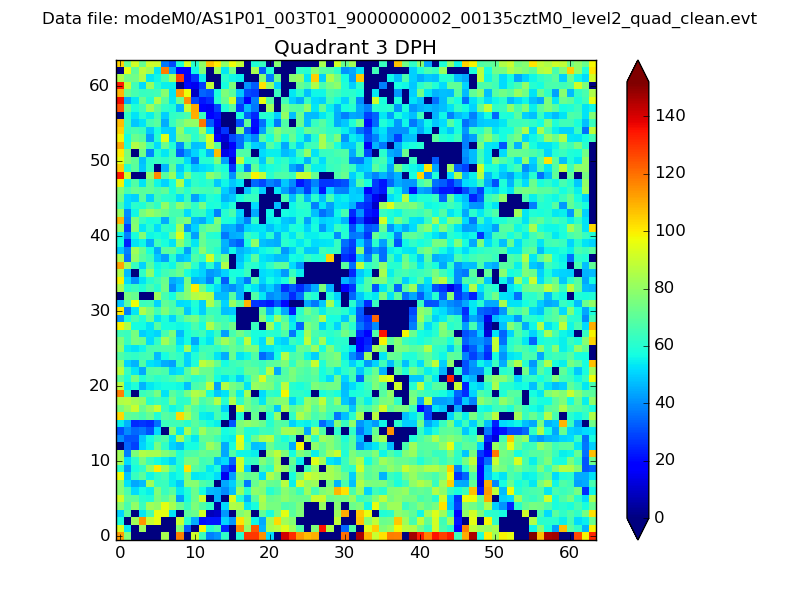 |
 |
Quadrant C |
| Plot type | Count rate plots | Images |
|---|---|---|
| Comparison with Poisson distribution Blue bars denote a histogram of data divided into 1 sec bins. Red curve is a Poisson curve with rate = median count rate of data. |
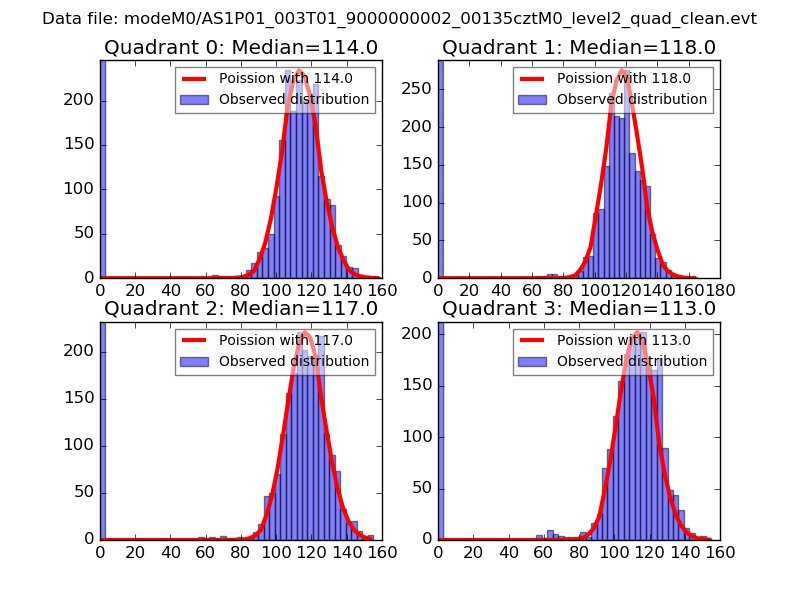 |
 |
| Quadrant-wise count rates Data is divided into 100 sec bins |
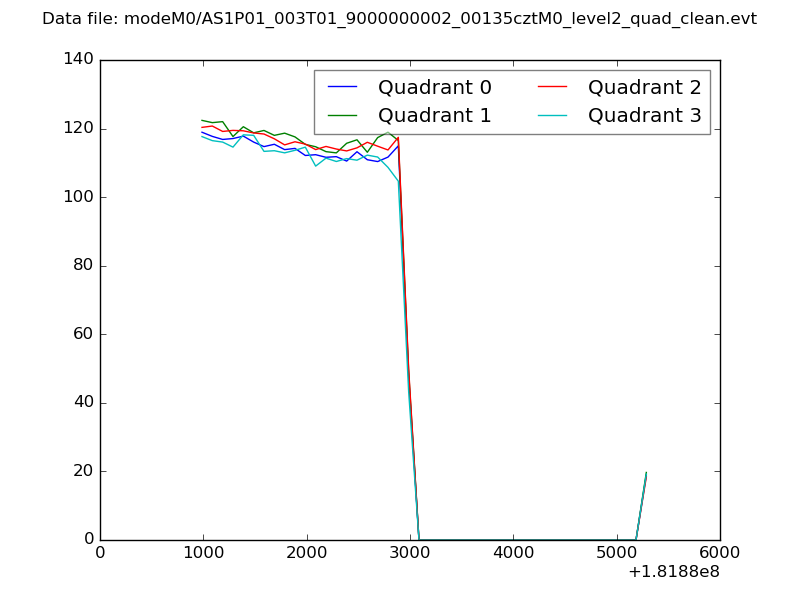 |
|
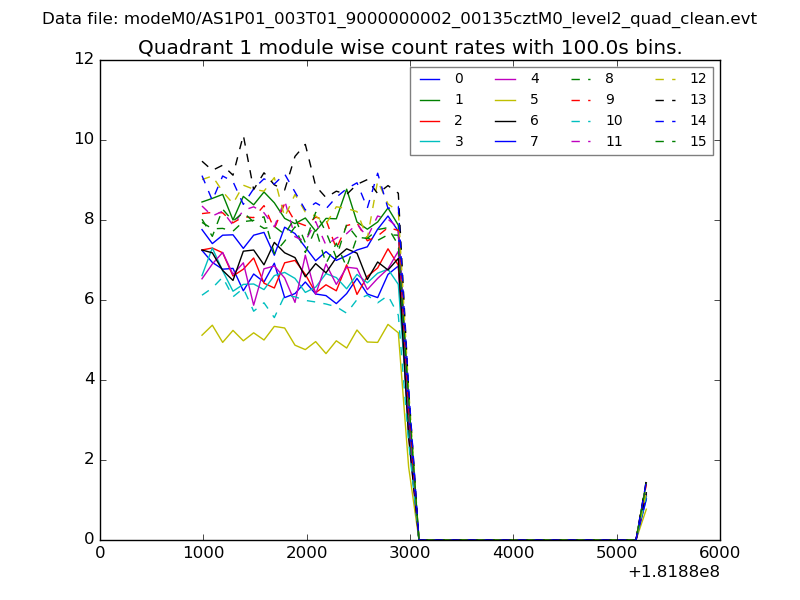
| Module-wise count rates for Quadrant A Data is divided into 100 sec bins |
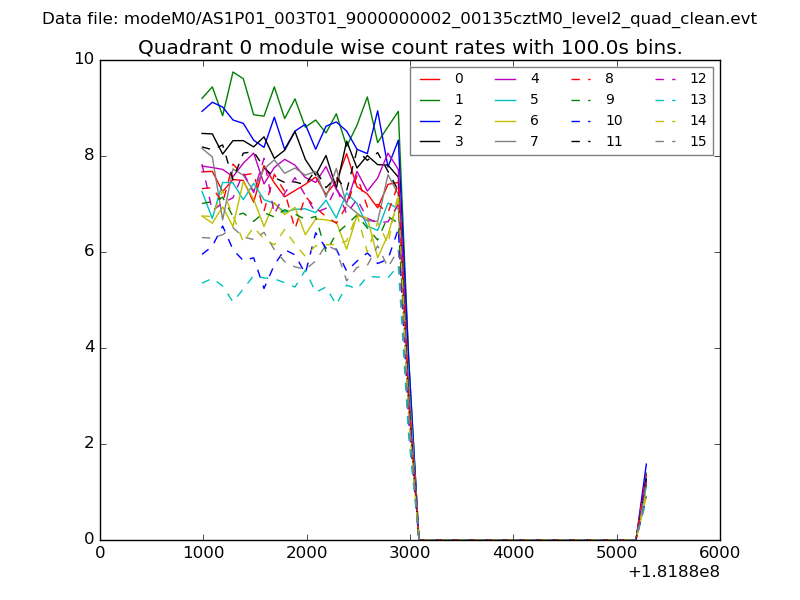 |
 |
| Module-wise count rates for Quadrant B Data is divided into 100 sec bins |
 |
 |
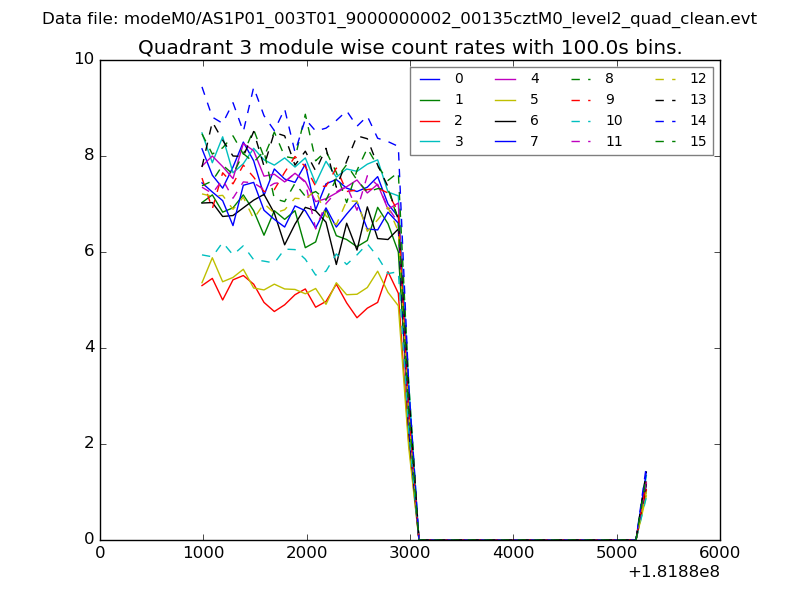
| Module-wise count rates for Quadrant C Data is divided into 100 sec bins |
 |
 |
| Module-wise count rates for Quadrant D Data is divided into 100 sec bins |
 |
 |
| Parameter | Plot |
|---|---|
| CZT HV Monitor |  |
| D_VDD | 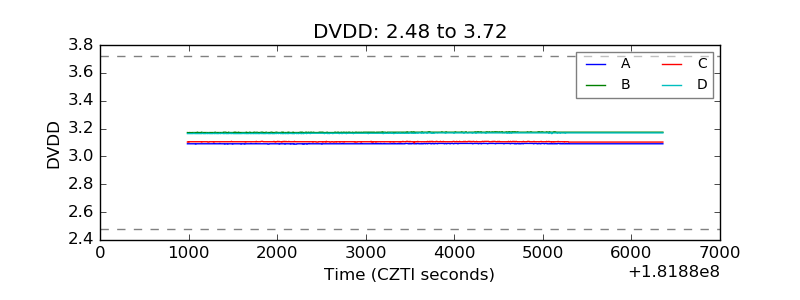 |
| Temperature 1 | 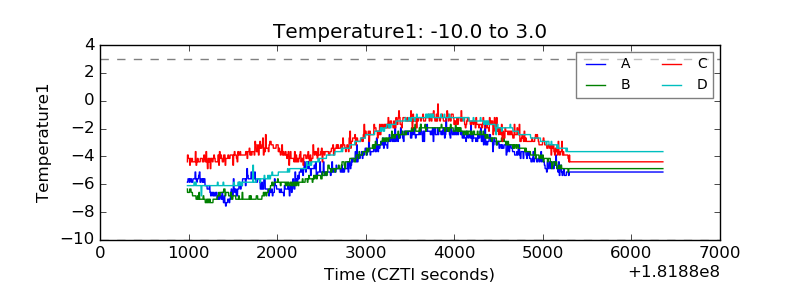 |
| Veto HV Monitor | 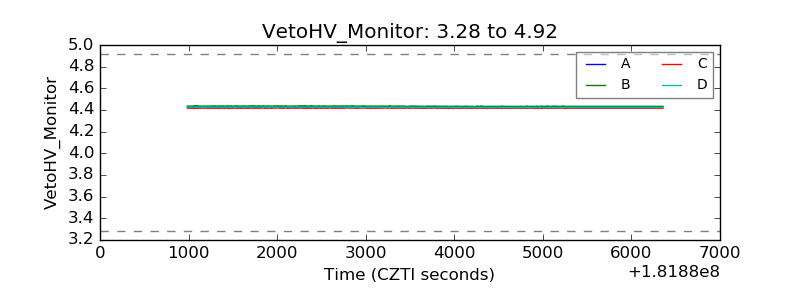 |
| Veto LLD | 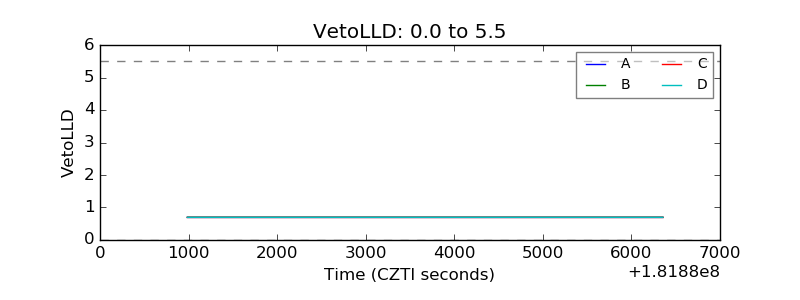 |
| Alpha Counter | 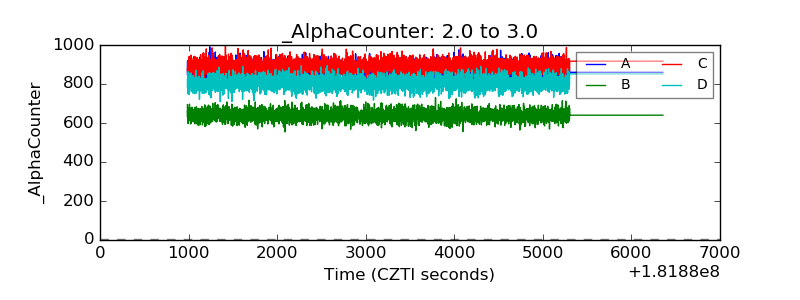 |
| _CPM_Rate | 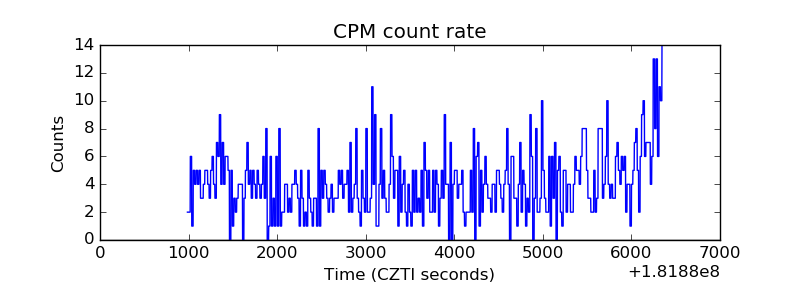 |
| CZT Counter | 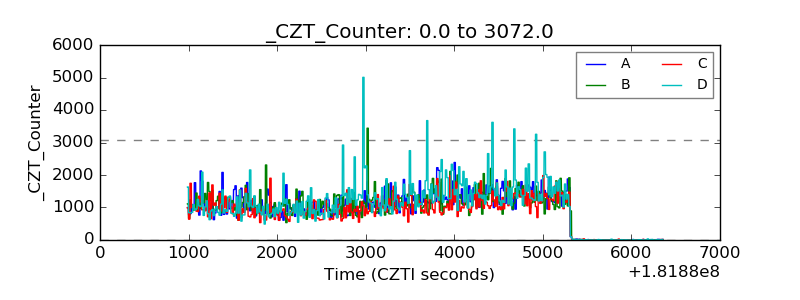 |
| +2.5 Volts monitor | 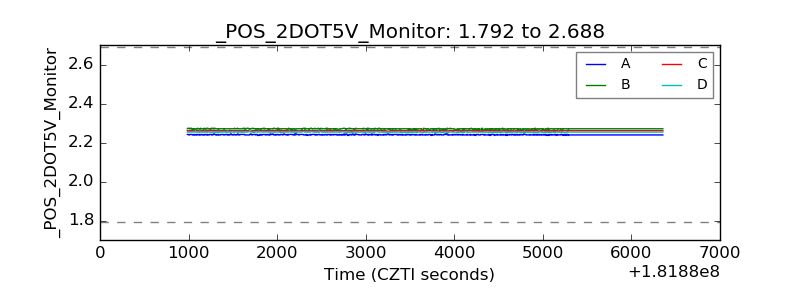 |
| +5 Volts monitor |  |
| _ROLL_ROT | 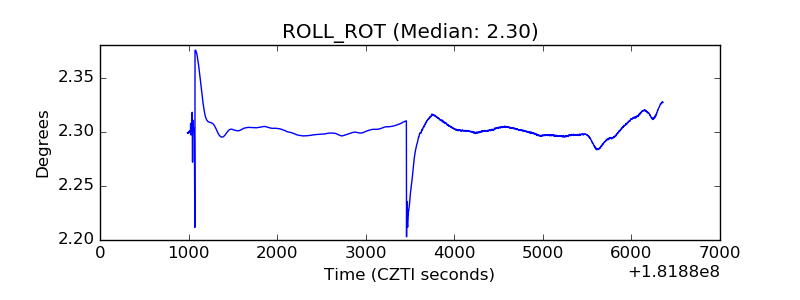 |
| _Roll_DEC | 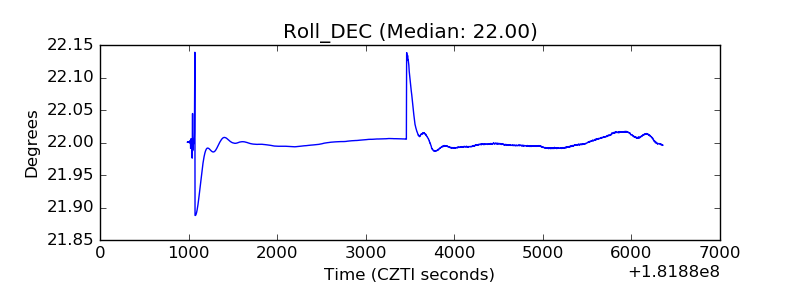 |
| _Roll_RA | 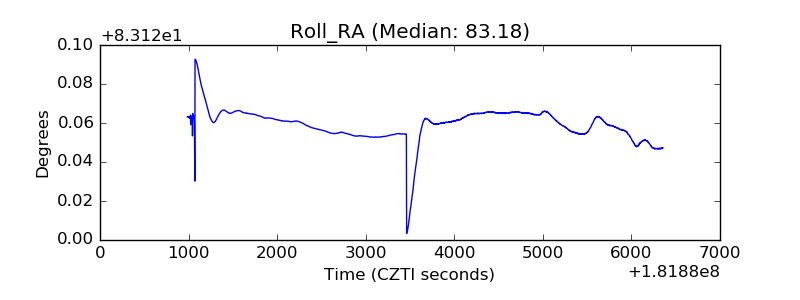 |
| Veto Counter | 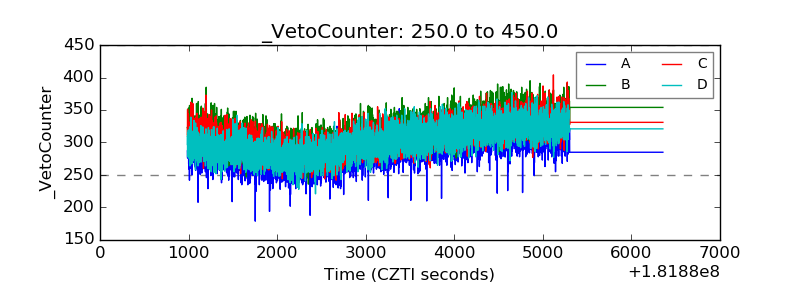 |