| Param | Original file | Final file |
|---|---|---|
| Filename | modeM0/AS1P01_140T01_9000000004_00135cztM0_level2.evt | modeM0/AS1P01_140T01_9000000004_00135cztM0_level2_quad_clean.evt |
| Size (bytes) | 683,254,080 | 43,784,640 |
| Size | 651.6 MB | 41.8 MB |
| Events in quadrant A | 4,679,790 | 269,819 |
| Events in quadrant B | 4,773,326 | 275,063 |
| Events in quadrant C | 5,265,252 | 266,148 |
| Events in quadrant D | 5,725,270 | 249,533 |
| Mode SS | |||
|---|---|---|---|
| Quadrant | BADHDUFLAG | Total packets | Discarded packets |
| A | 0 | 76 | 0 |
| B | 0 | 76 | 0 |
| C | 0 | 76 | 0 |
| D | 0 | 76 | 0 |
| Mode M9 | |||
|---|---|---|---|
| Quadrant | BADHDUFLAG | Total packets | Discarded packets |
| A | 0 | 16 | 0 |
| B | 0 | 16 | 0 |
| C | 0 | 16 | 0 |
| D | 0 | 16 | 0 |
| Mode M0 | |||
|---|---|---|---|
| Quadrant | BADHDUFLAG | Total packets | Discarded packets |
| A | 0 | 16554 | 2 |
| B | 0 | 16832 | 1 |
| C | 0 | 18289 | 1 |
| D | 0 | 19680 | 1 |
| Quadrant | Total seconds | Saturated seconds | Saturation percentage |
|---|---|---|---|
| A | 3747 | 4 | 0.106752% |
| B | 3747 | 7 | 0.186816% |
| C | 3747 | 39 | 1.040833% |
| D | 3747 | 213 | 5.684548% |
Noise dominated data is calculated using 1-second bins in cleaned event files. If a bin has >2000 counts, and if more than 50% of those come from <1% of pixels, then it is considered to be noise-dominated and hence unusable.
| Quadrant | # 1 sec bins | Bins with >0 counts | Bins with >2000 counts | High rate bins dominated by noise | Noise dominated (total time) | Noise dominated (detector-on time) | Marked lightcurve |
|---|---|---|---|---|---|---|---|
| A | 5339 | 3749 | 97 | 97 | 1.82% | 2.59% | 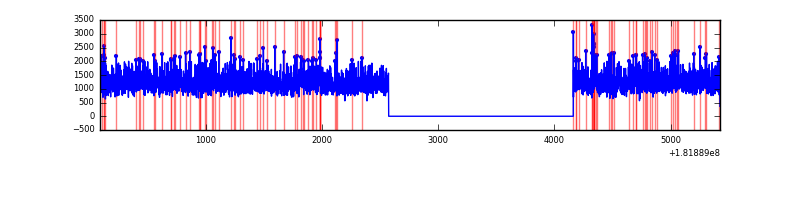 |
| B | 5339 | 3749 | 109 | 109 | 2.04% | 2.91% | 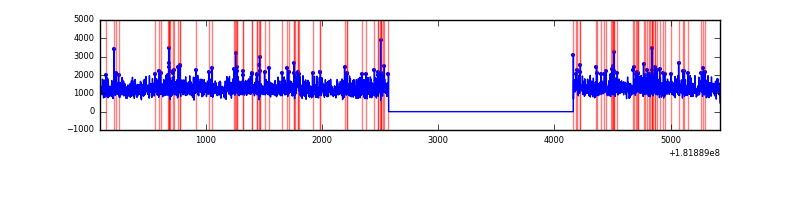 |
| C | 5339 | 3749 | 542 | 542 | 10.15% | 14.46% | 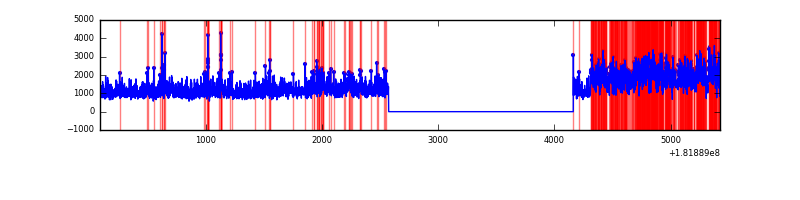 |
| D | 5339 | 3749 | 588 | 588 | 11.01% | 15.68% | 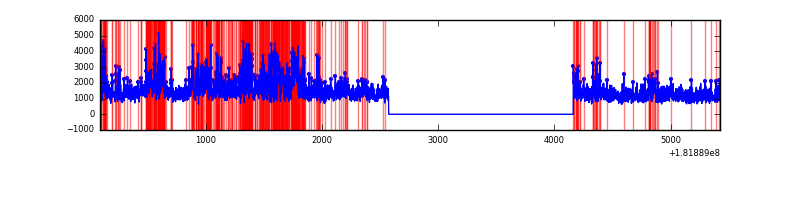 |
Top three noisy pixels from each quadrant. If the there are fewer than three noisy pixels in the level2.evt file, extra rows are filled as -1
| Pixel properties | Quadrant properties | ||||||
|---|---|---|---|---|---|---|---|
| Quadrant | DetID | PixID | Counts | Sigma | Mean | Median | Sigma |
| A | 15 | 106 | 19123 | 90.99 | 1180 | 1152 | 197.5 |
| A | 15 | 233 | 14194 | 66.03 | 1180 | 1152 | 197.5 |
| A | 14 | 171 | 14045 | 65.28 | 1180 | 1152 | 197.5 |
| B | 0 | 235 | 105628 | 404.84 | 1147 | 1147 | 258.1 |
| B | 8 | 236 | 81531 | 311.47 | 1147 | 1147 | 258.1 |
| B | 0 | 234 | 58648 | 222.8 | 1147 | 1147 | 258.1 |
| C | 3 | 32 | 1013940 | 3428.31 | 1040 | 1076 | 295.4 |
| C | 0 | 203 | 54269 | 180.05 | 1040 | 1076 | 295.4 |
| C | 4 | 253 | 45411 | 150.06 | 1040 | 1076 | 295.4 |
| D | 10 | 244 | 594024 | 2062.43 | 1083 | 1089 | 287.5 |
| D | 12 | 207 | 135486 | 467.48 | 1083 | 1089 | 287.5 |
| D | 14 | 34 | 126645 | 436.73 | 1083 | 1089 | 287.5 |
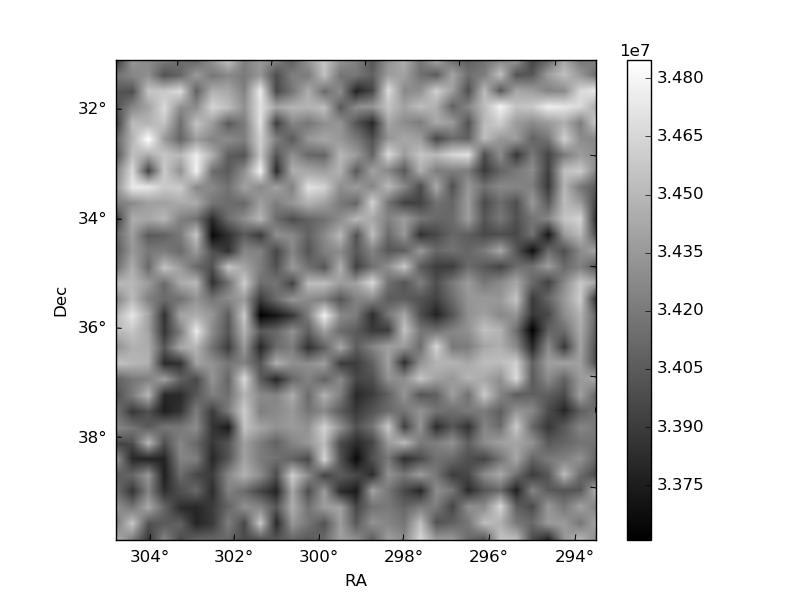
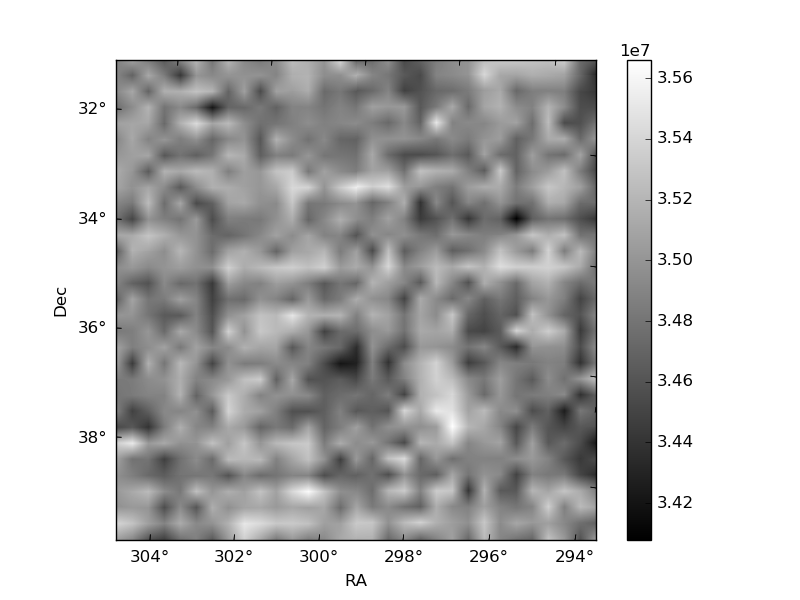
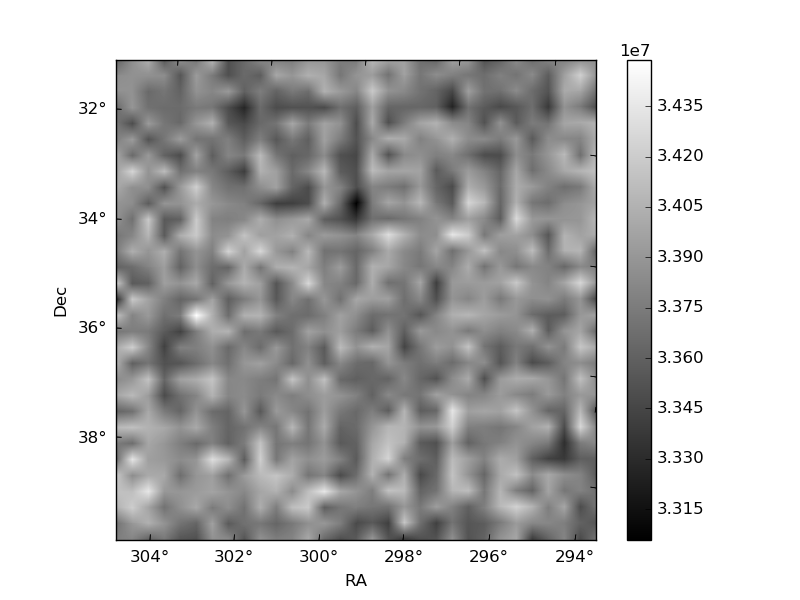
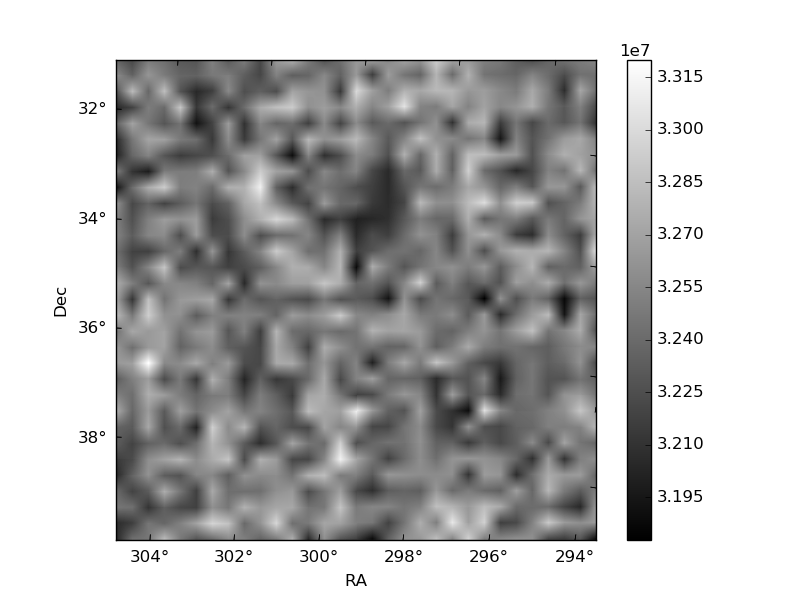
Histogram calculated using DETX and DETY for each event in the final _common_clean file
| Quadrant A | 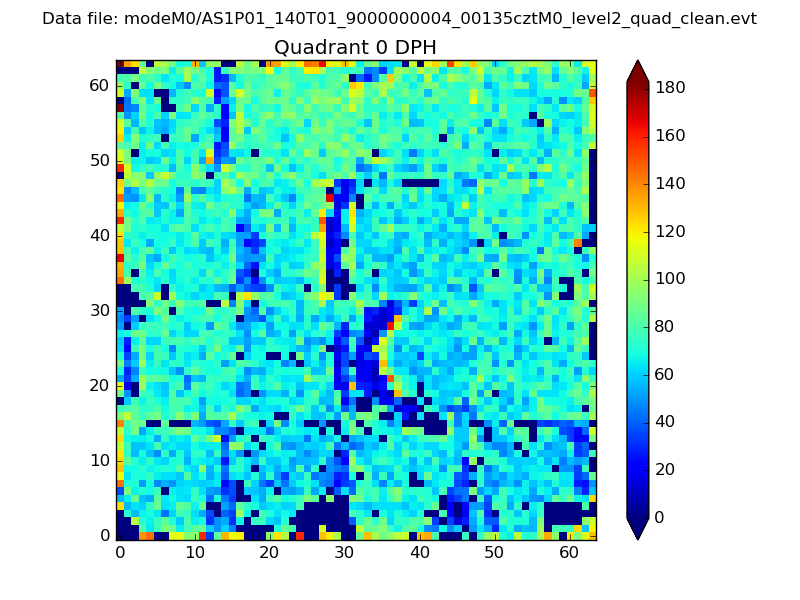 |
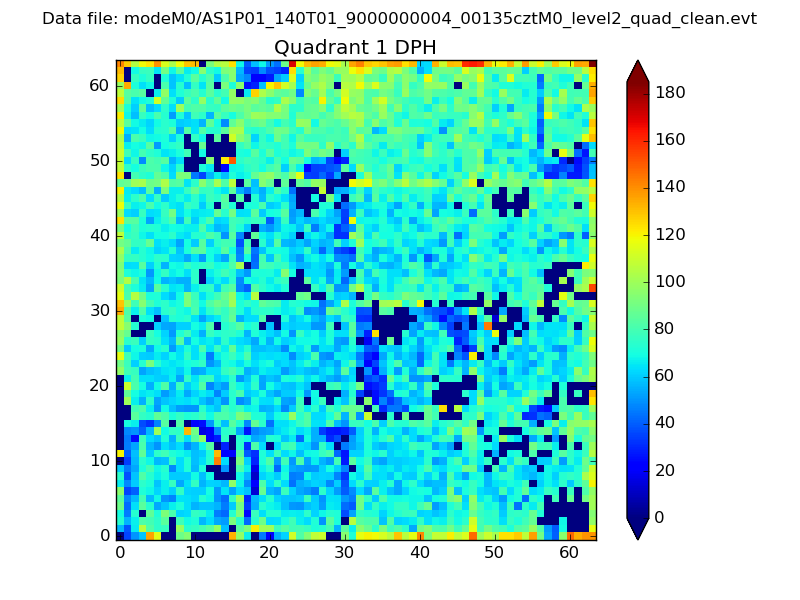 |
Quadrant B |
|---|---|---|---|
| Quadrant D | 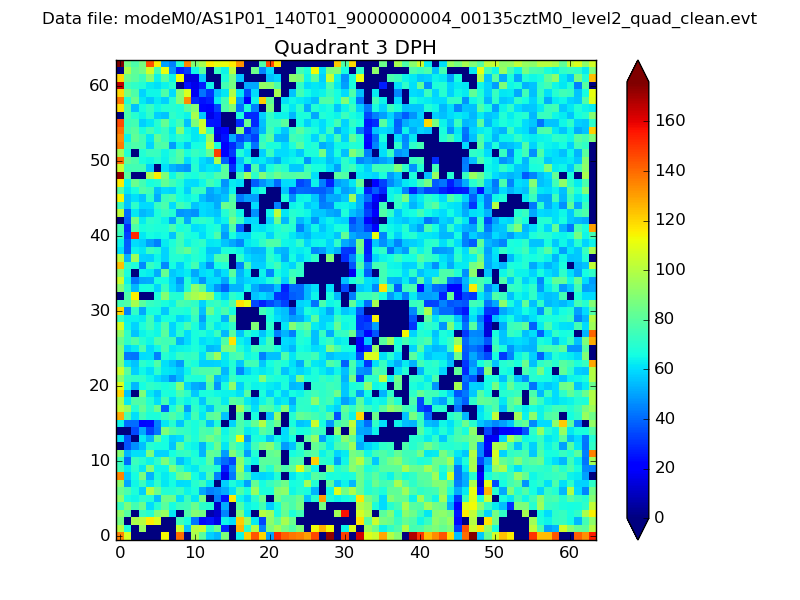 |
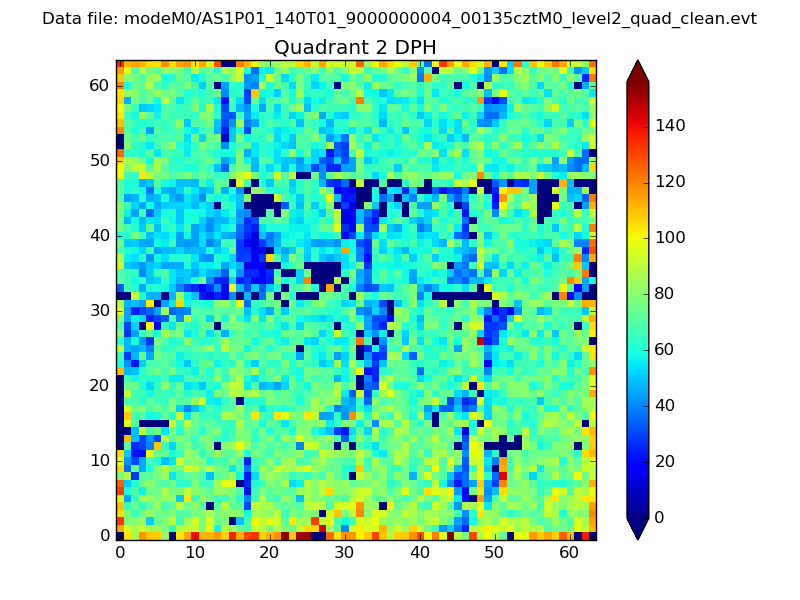 |
Quadrant C |
| Plot type | Count rate plots | Images |
|---|---|---|
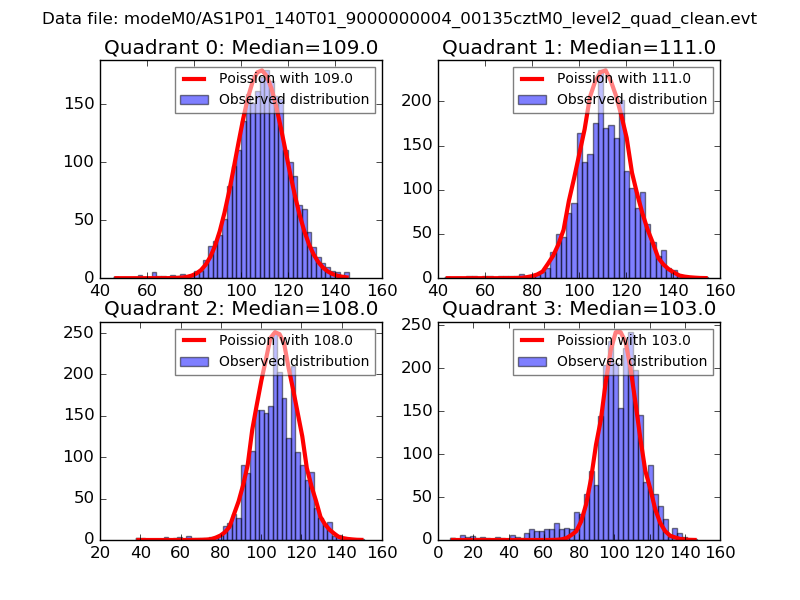
| Comparison with Poisson distribution Blue bars denote a histogram of data divided into 1 sec bins. Red curve is a Poisson curve with rate = median count rate of data. |
 |
 |
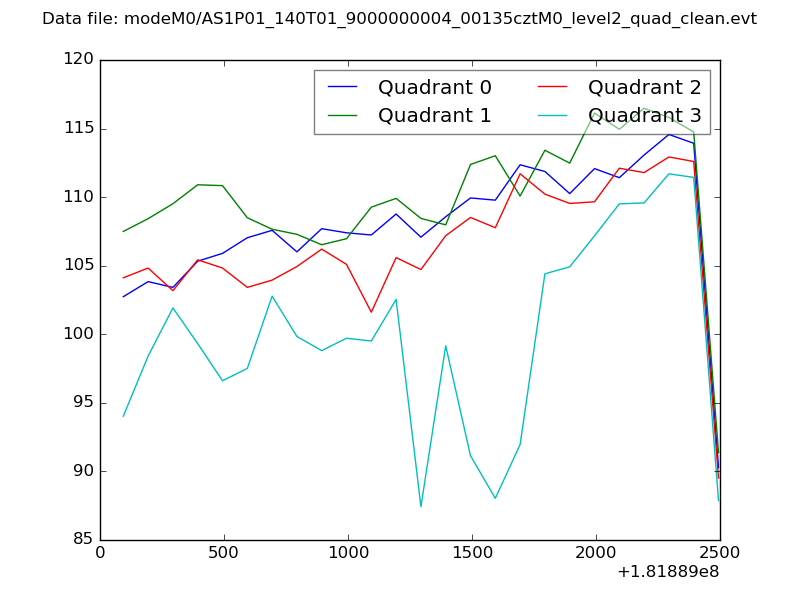
| Quadrant-wise count rates Data is divided into 100 sec bins |
 |
|
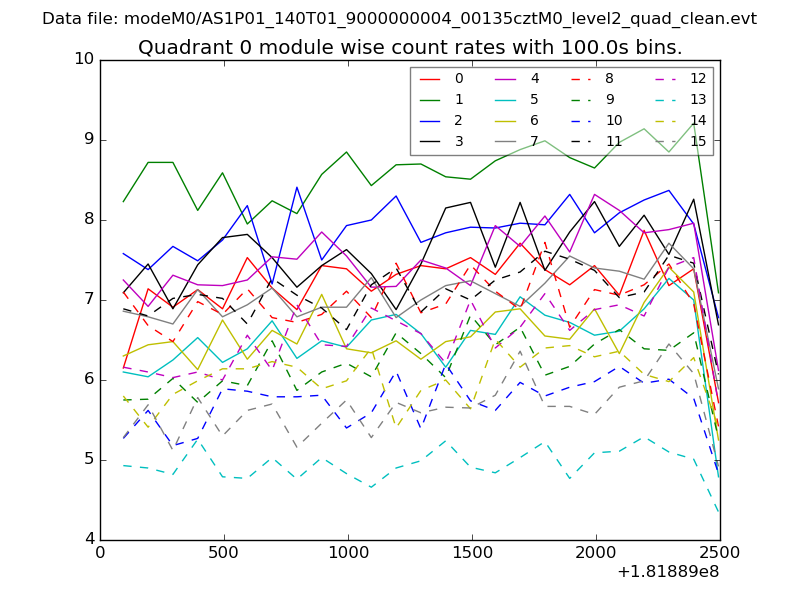
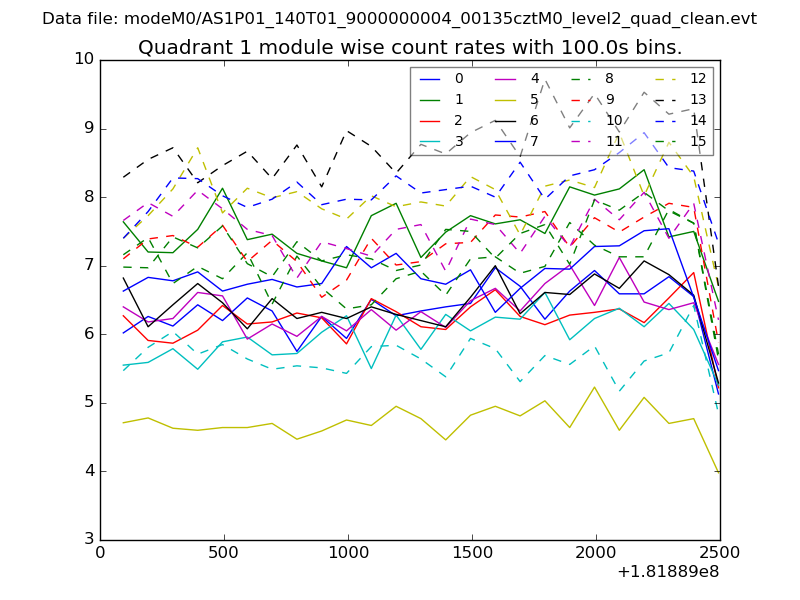
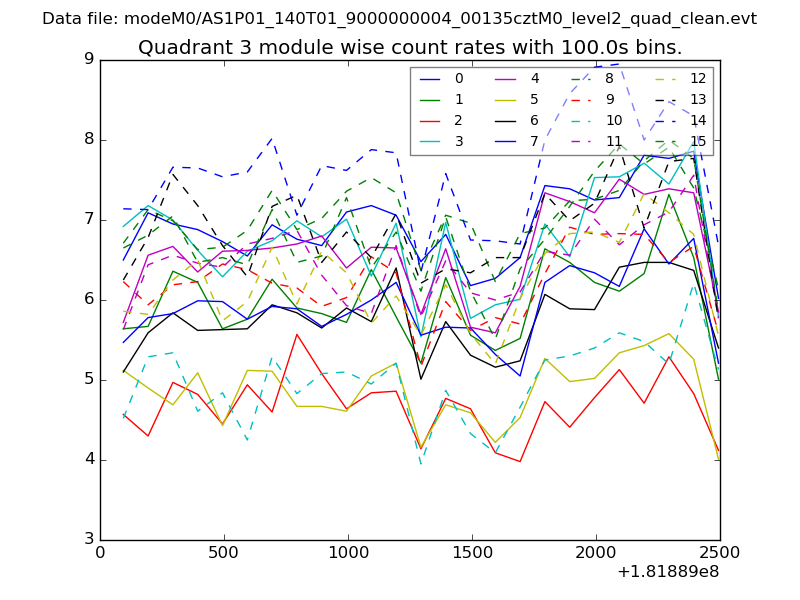
| Module-wise count rates for Quadrant A Data is divided into 100 sec bins |
 |
 |
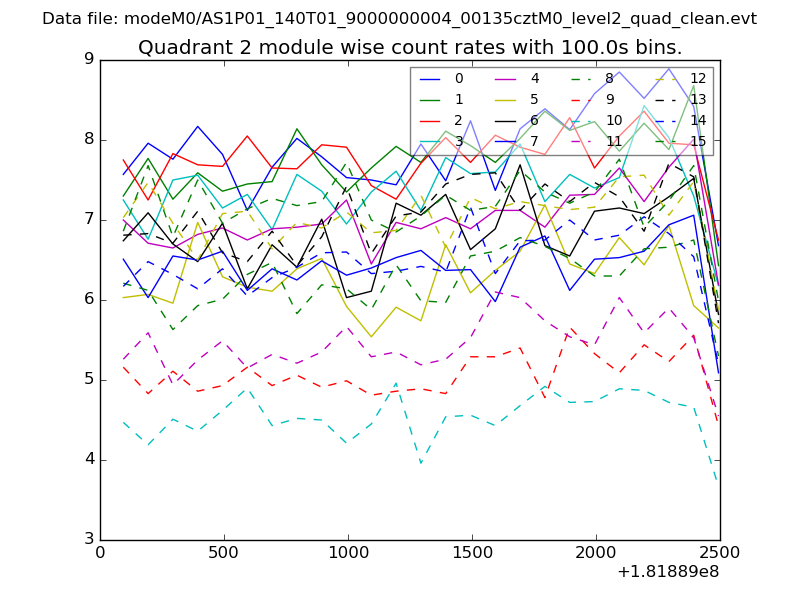
| Module-wise count rates for Quadrant B Data is divided into 100 sec bins |
 |
 |
| Module-wise count rates for Quadrant C Data is divided into 100 sec bins |
 |
 |
| Module-wise count rates for Quadrant D Data is divided into 100 sec bins |
 |
 |
| Parameter | Plot |
|---|---|
| CZT HV Monitor | 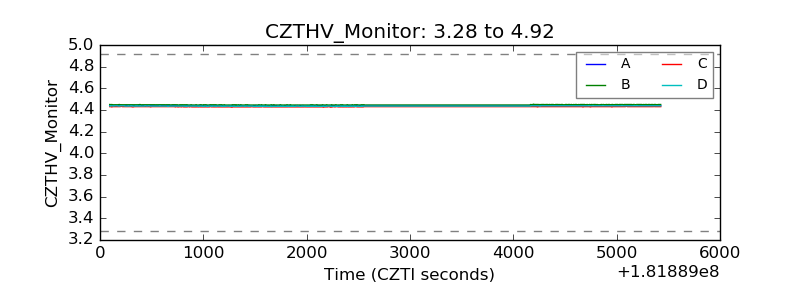 |
| D_VDD | 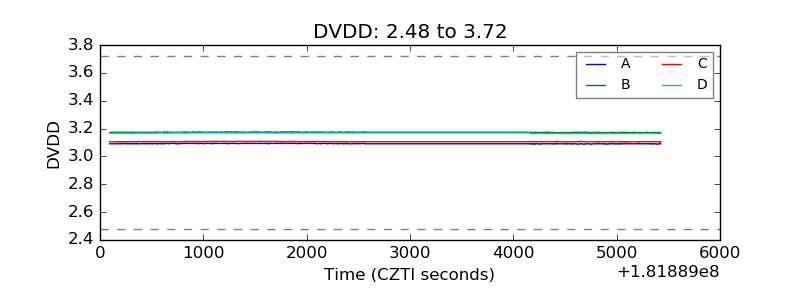 |
| Temperature 1 | 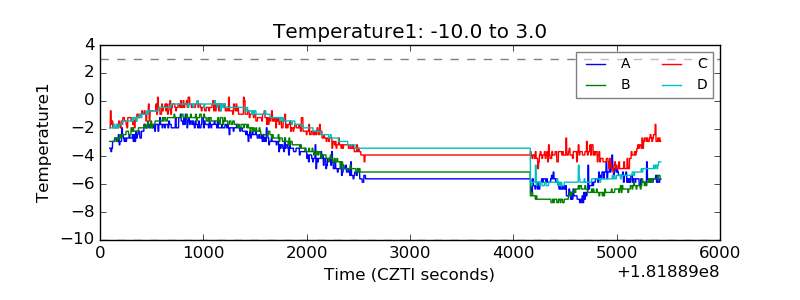 |
| Veto HV Monitor | 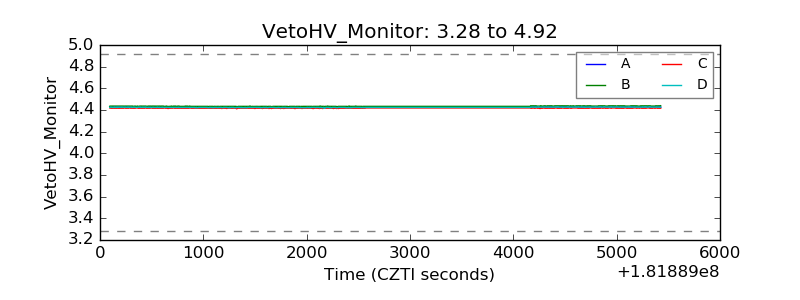 |
| Veto LLD | 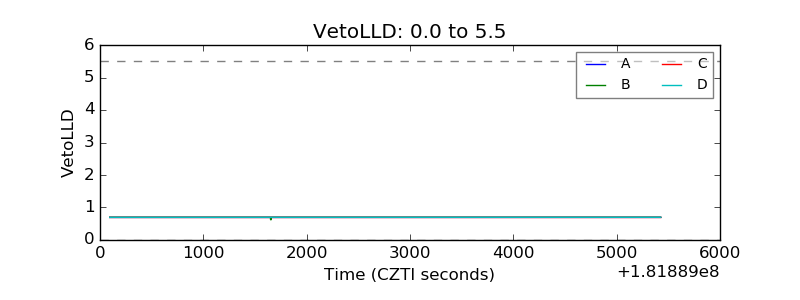 |
| Alpha Counter |  |
| _CPM_Rate | 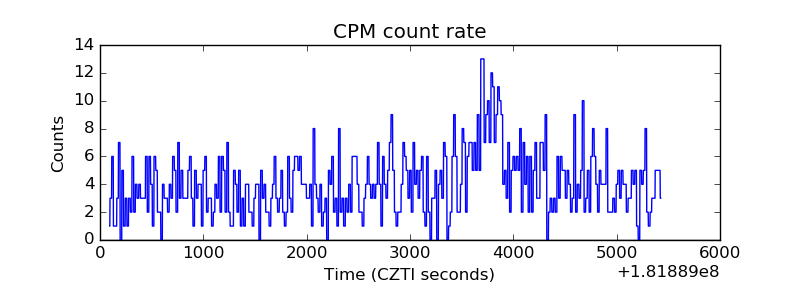 |
| CZT Counter | 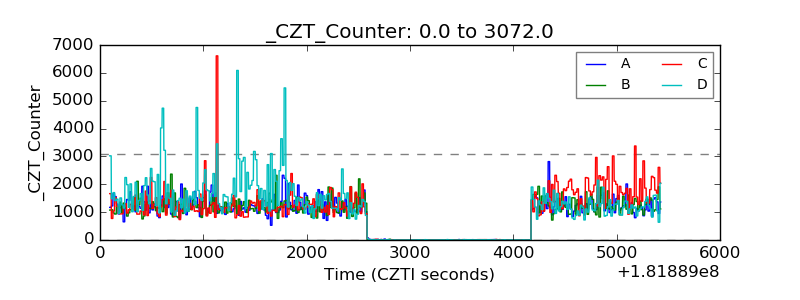 |
| +2.5 Volts monitor |  |
| +5 Volts monitor |  |
| _ROLL_ROT | 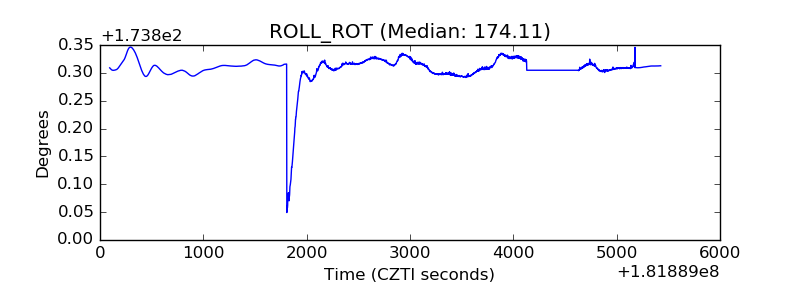 |
| _Roll_DEC | 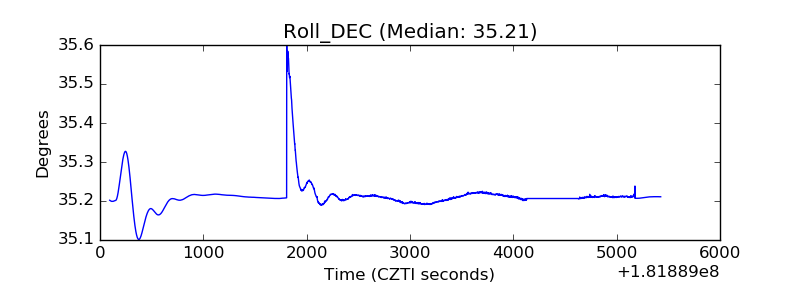 |
| _Roll_RA | 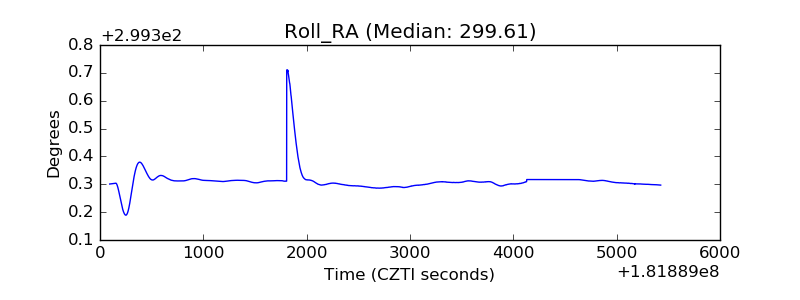 |
| Veto Counter | 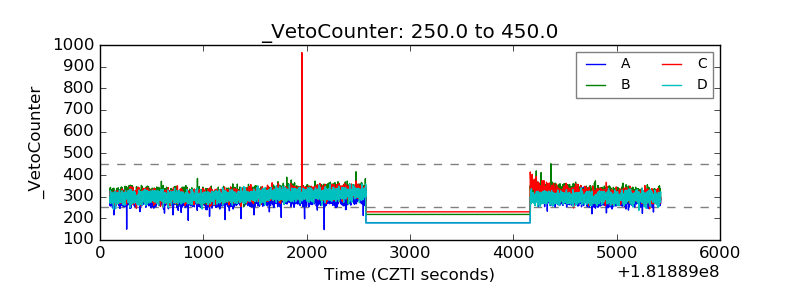 |