| Param | Original file | Final file |
|---|---|---|
| Filename | modeM0/AS1P01_140T01_9000000004_00136cztM0_level2.evt | modeM0/AS1P01_140T01_9000000004_00136cztM0_level2_quad_clean.evt |
| Size (bytes) | 1,004,356,800 | 61,260,480 |
| Size | 957.8 MB | 58.4 MB |
| Events in quadrant A | 7,036,766 | 370,930 |
| Events in quadrant B | 7,188,620 | 380,181 |
| Events in quadrant C | 7,495,912 | 368,457 |
| Events in quadrant D | 8,328,300 | 346,171 |
| Mode SS | |||
|---|---|---|---|
| Quadrant | BADHDUFLAG | Total packets | Discarded packets |
| A | 0 | 114 | 0 |
| B | 0 | 114 | 0 |
| C | 0 | 114 | 0 |
| D | 0 | 114 | 0 |
| Mode M9 | |||
|---|---|---|---|
| Quadrant | BADHDUFLAG | Total packets | Discarded packets |
| A | 0 | 16 | 0 |
| B | 0 | 16 | 0 |
| C | 0 | 16 | 0 |
| D | 0 | 16 | 0 |
| Mode M0 | |||
|---|---|---|---|
| Quadrant | BADHDUFLAG | Total packets | Discarded packets |
| A | 0 | 24856 | 2 |
| B | 0 | 25282 | 1 |
| C | 0 | 26214 | 1 |
| D | 0 | 28736 | 1 |
| Quadrant | Total seconds | Saturated seconds | Saturation percentage |
|---|---|---|---|
| A | 5555 | 17 | 0.306031% |
| B | 5555 | 3 | 0.054005% |
| C | 5555 | 90 | 1.620162% |
| D | 5555 | 324 | 5.832583% |
Noise dominated data is calculated using 1-second bins in cleaned event files. If a bin has >2000 counts, and if more than 50% of those come from <1% of pixels, then it is considered to be noise-dominated and hence unusable.
| Quadrant | # 1 sec bins | Bins with >0 counts | Bins with >2000 counts | High rate bins dominated by noise | Noise dominated (total time) | Noise dominated (detector-on time) | Marked lightcurve |
|---|---|---|---|---|---|---|---|
| A | 7147 | 5557 | 185 | 185 | 2.59% | 3.33% | 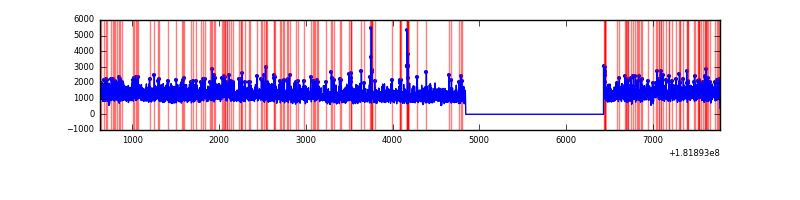 |
| B | 7147 | 5557 | 189 | 189 | 2.64% | 3.40% | 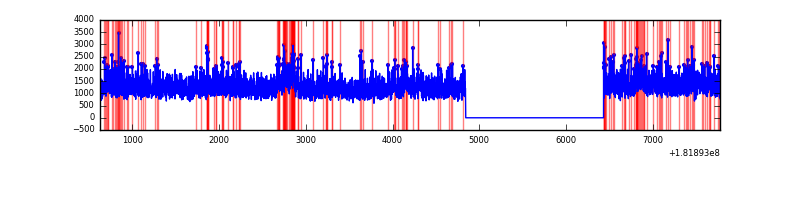 |
| C | 7147 | 5557 | 648 | 648 | 9.07% | 11.66% | 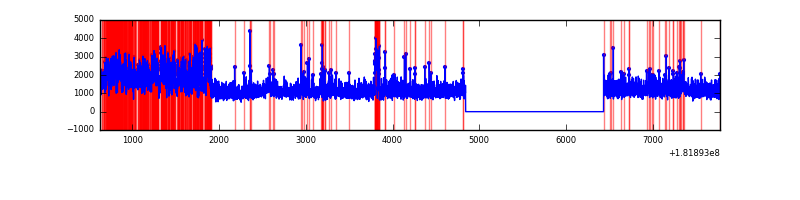 |
| D | 7147 | 5557 | 920 | 920 | 12.87% | 16.56% | 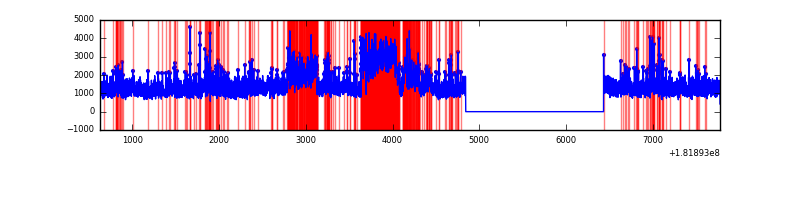 |
Top three noisy pixels from each quadrant. If the there are fewer than three noisy pixels in the level2.evt file, extra rows are filled as -1
| Pixel properties | Quadrant properties | ||||||
|---|---|---|---|---|---|---|---|
| Quadrant | DetID | PixID | Counts | Sigma | Mean | Median | Sigma |
| A | 15 | 233 | 50862 | 168.04 | 1773 | 1730 | 292.4 |
| A | 13 | 65 | 21882 | 68.92 | 1773 | 1730 | 292.4 |
| A | 14 | 187 | 20820 | 65.29 | 1773 | 1730 | 292.4 |
| B | 15 | 64 | 114413 | 287.02 | 1731 | 1736 | 392.6 |
| B | 2 | 2 | 90077 | 225.03 | 1731 | 1736 | 392.6 |
| B | 8 | 236 | 85126 | 212.42 | 1731 | 1736 | 392.6 |
| C | 3 | 32 | 1117731 | 2565.53 | 1545 | 1602 | 435.0 |
| C | 0 | 186 | 143329 | 325.77 | 1545 | 1602 | 435.0 |
| C | 0 | 203 | 102175 | 231.18 | 1545 | 1602 | 435.0 |
| D | 13 | 69 | 1158373 | 2679.74 | 1636 | 1644 | 431.7 |
| D | 10 | 244 | 125220 | 286.28 | 1636 | 1644 | 431.7 |
| D | 0 | 243 | 119911 | 273.98 | 1636 | 1644 | 431.7 |
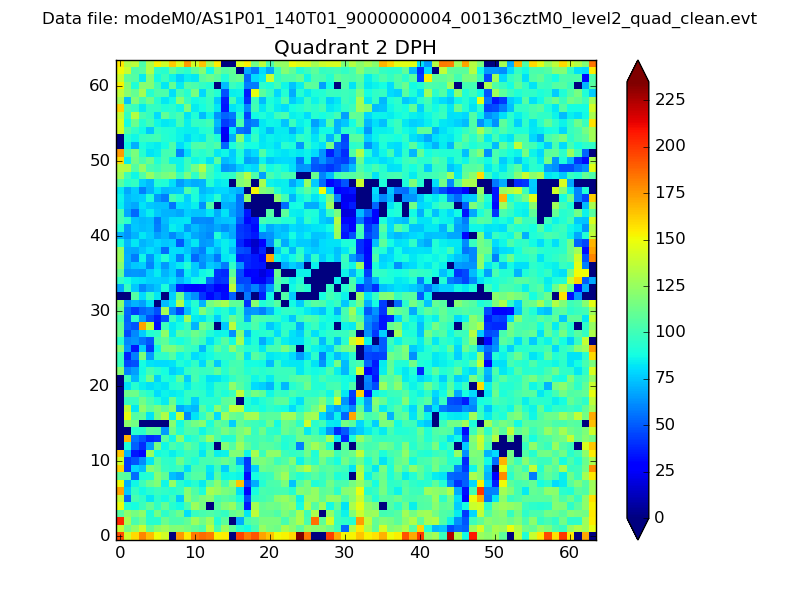
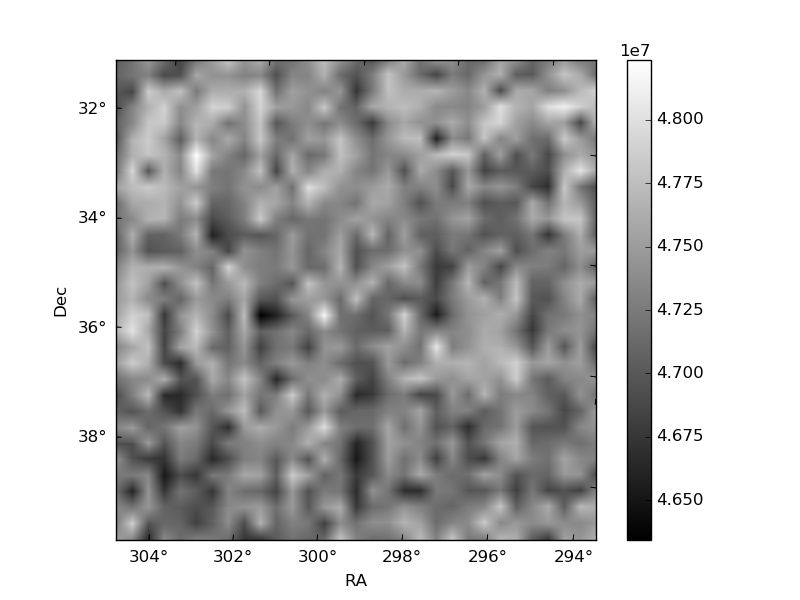
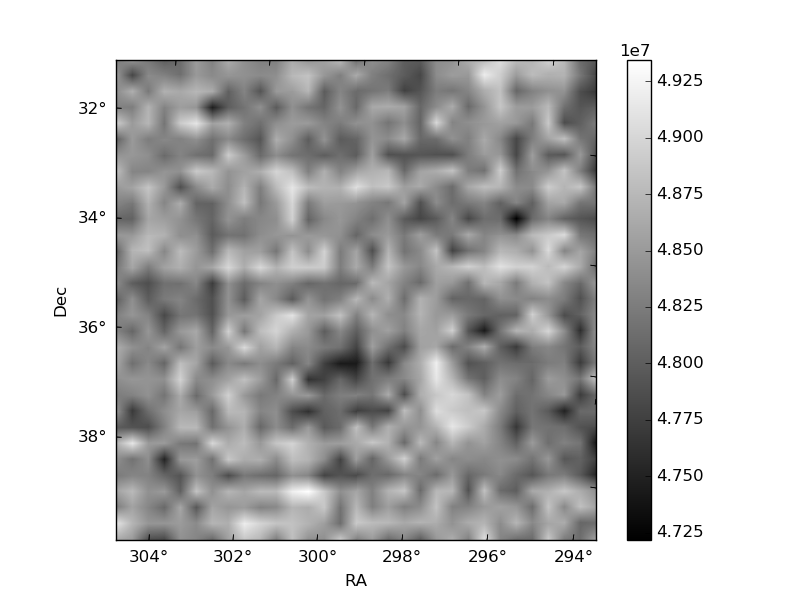
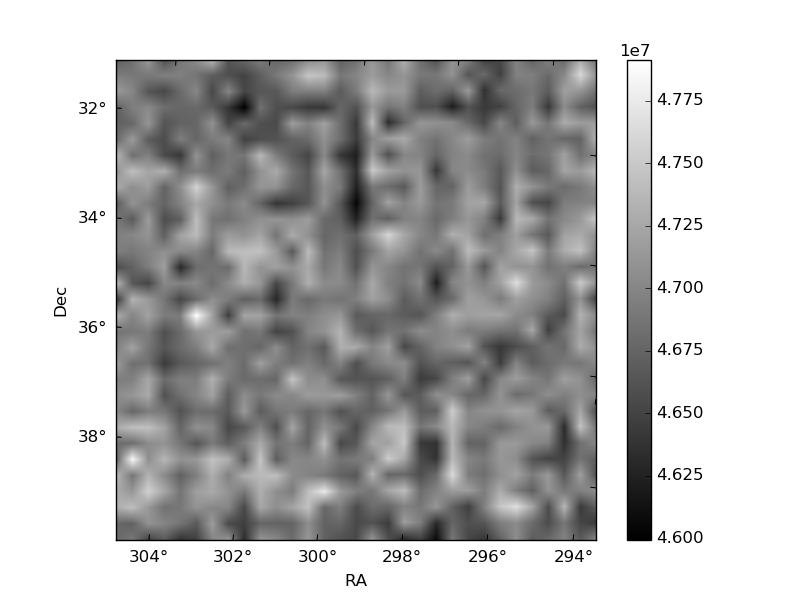
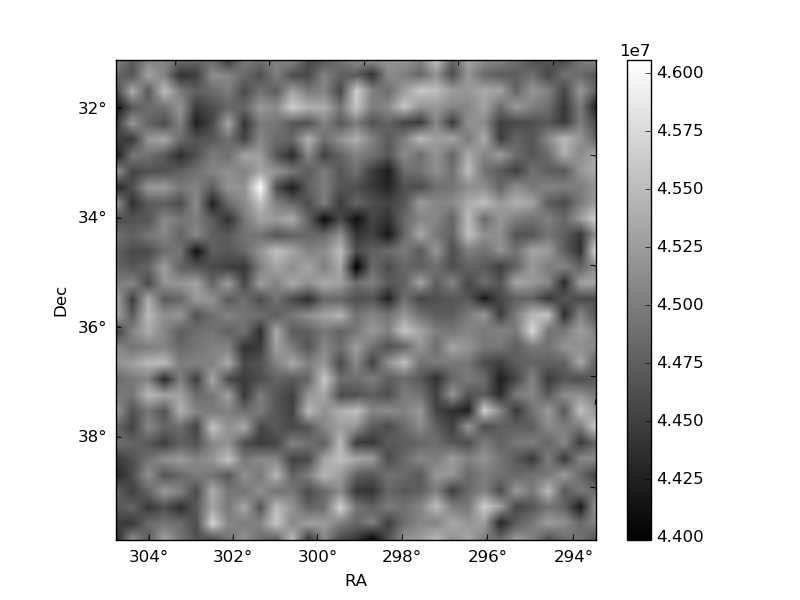
Histogram calculated using DETX and DETY for each event in the final _common_clean file
| Quadrant A |  |
 |
Quadrant B |
|---|---|---|---|
| Quadrant D | 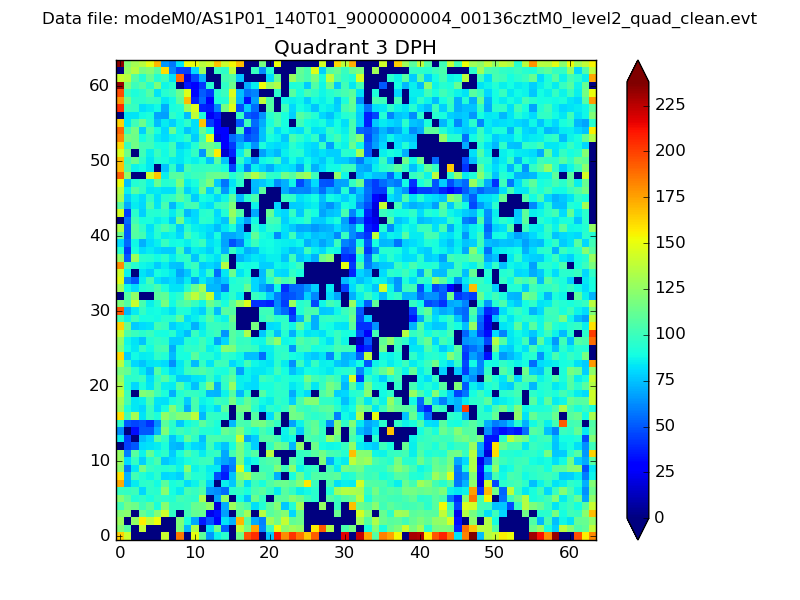 |
 |
Quadrant C |
| Plot type | Count rate plots | Images |
|---|---|---|
| Comparison with Poisson distribution Blue bars denote a histogram of data divided into 1 sec bins. Red curve is a Poisson curve with rate = median count rate of data. |
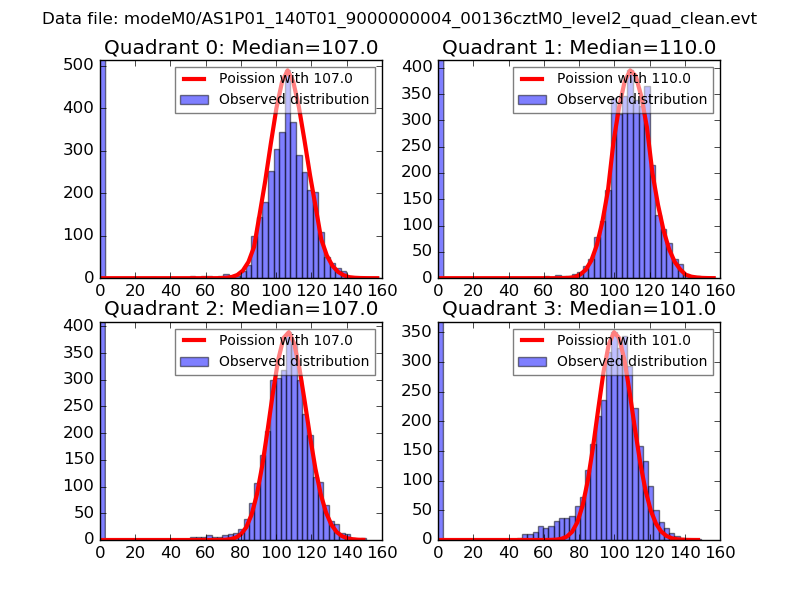 |
 |
| Quadrant-wise count rates Data is divided into 100 sec bins |
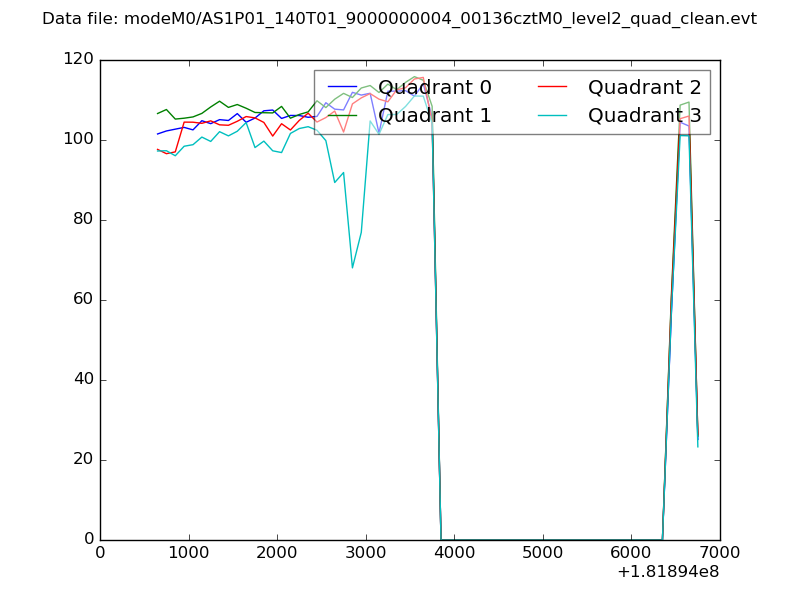 |
|
| Module-wise count rates for Quadrant A Data is divided into 100 sec bins |
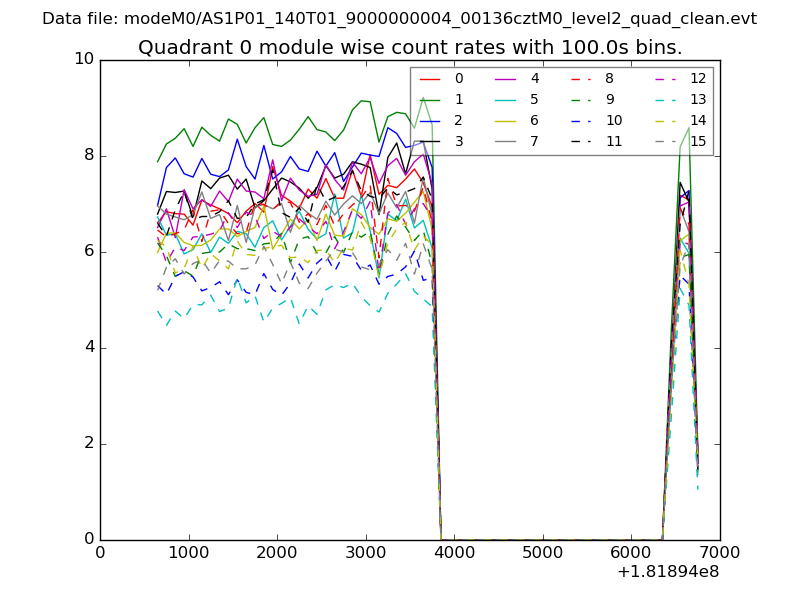 |
 |
| Module-wise count rates for Quadrant B Data is divided into 100 sec bins |
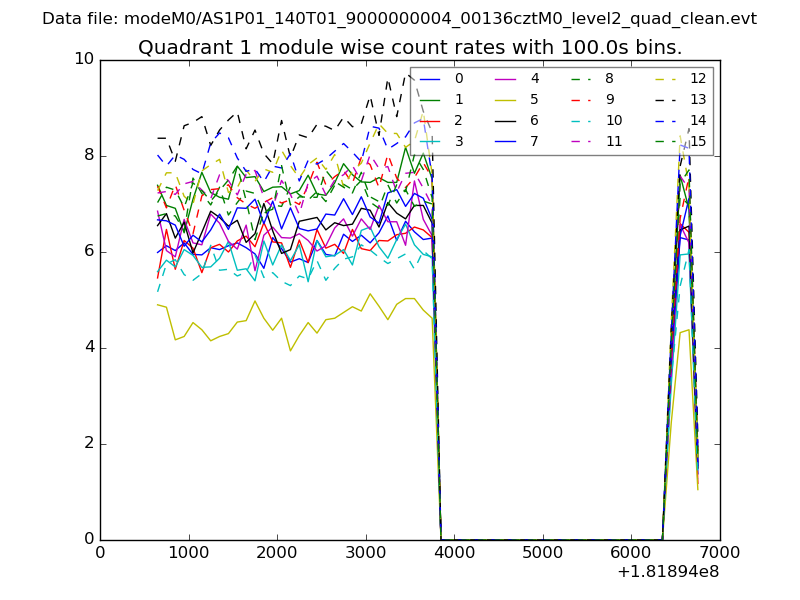 |
 |
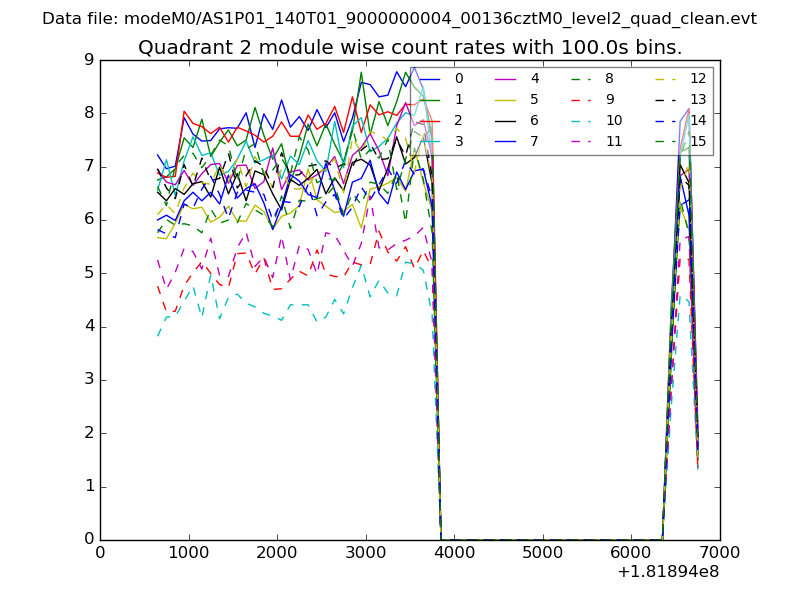
| Module-wise count rates for Quadrant C Data is divided into 100 sec bins |
 |
 |
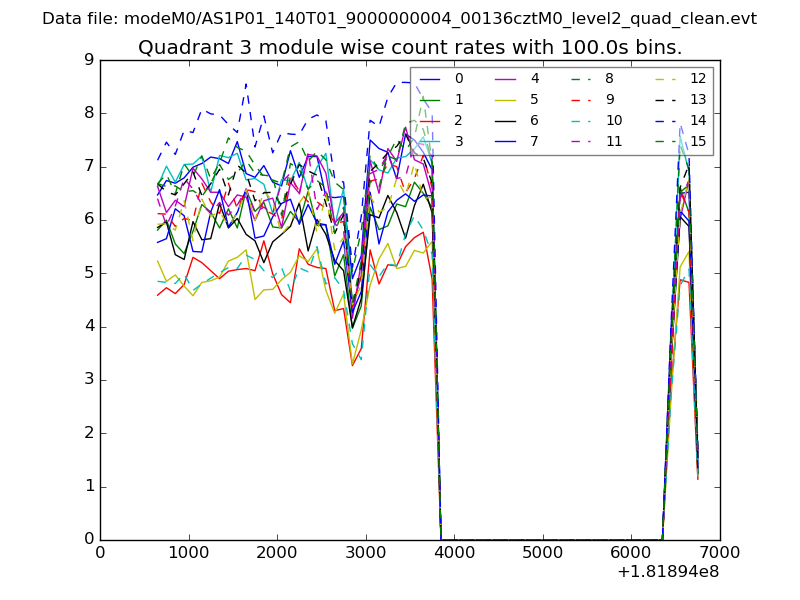
| Module-wise count rates for Quadrant D Data is divided into 100 sec bins |
 |
 |
| Parameter | Plot |
|---|---|
| CZT HV Monitor | 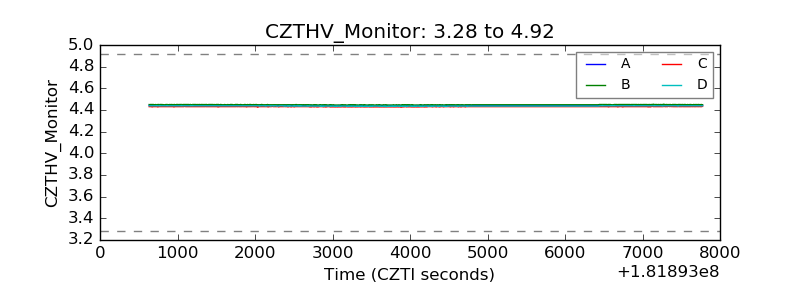 |
| D_VDD | 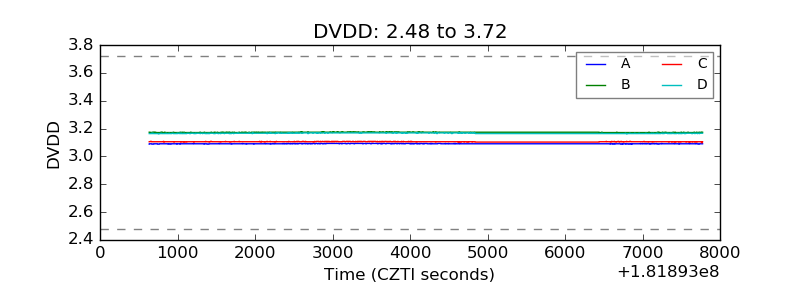 |
| Temperature 1 | 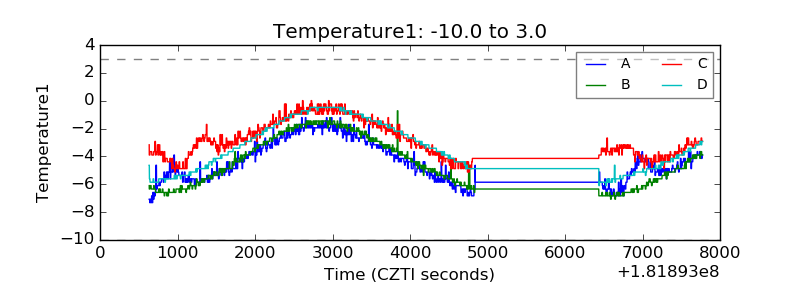 |
| Veto HV Monitor |  |
| Veto LLD | 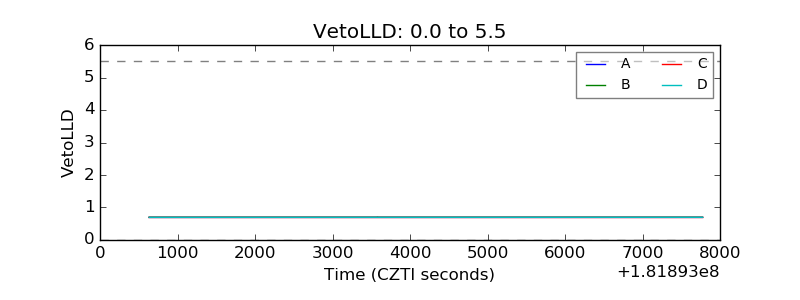 |
| Alpha Counter | 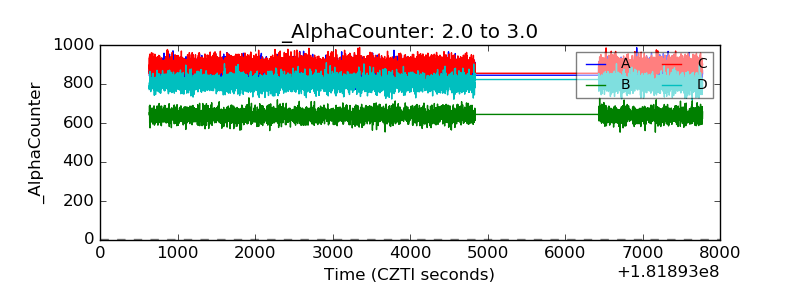 |
| _CPM_Rate | 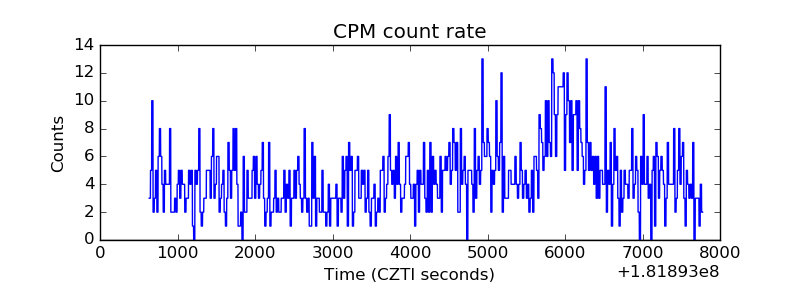 |
| CZT Counter | 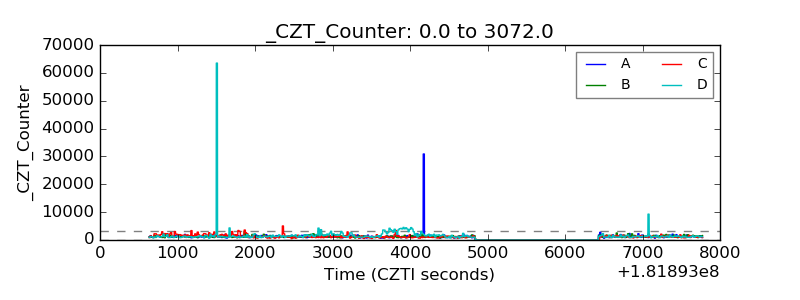 |
| +2.5 Volts monitor | 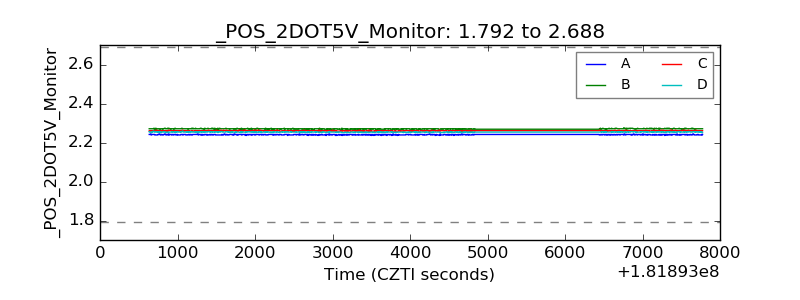 |
| +5 Volts monitor |  |
| _ROLL_ROT | 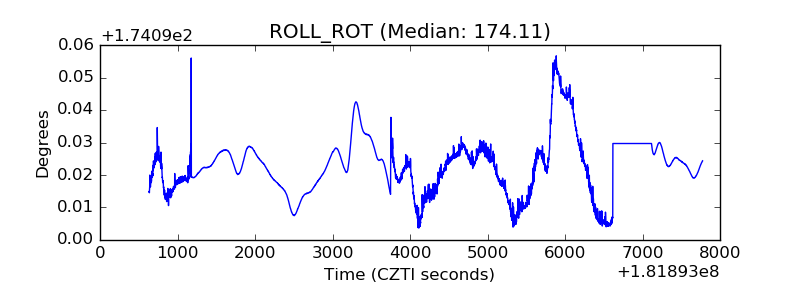 |
| _Roll_DEC |  |
| _Roll_RA |  |
| Veto Counter | 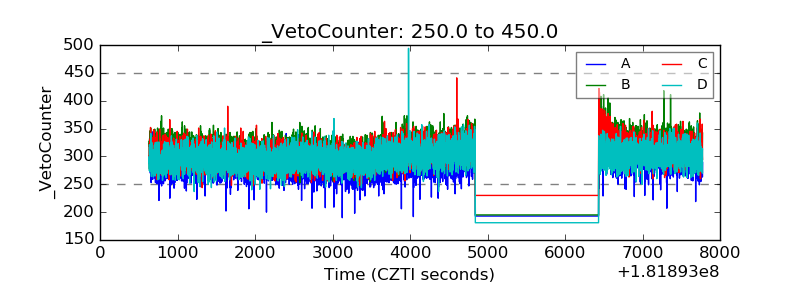 |