| Param | Original file | Final file |
|---|---|---|
| Filename | modeM0/AS1P01_140T01_9000000004_00137cztM0_level2.evt | modeM0/AS1P01_140T01_9000000004_00137cztM0_level2_quad_clean.evt |
| Size (bytes) | 915,701,760 | 71,568,000 |
| Size | 873.3 MB | 68.3 MB |
| Events in quadrant A | 6,648,212 | 456,874 |
| Events in quadrant B | 6,713,329 | 463,868 |
| Events in quadrant C | 6,003,727 | 453,778 |
| Events in quadrant D | 8,017,779 | 423,281 |
| Mode SS | |||
|---|---|---|---|
| Quadrant | BADHDUFLAG | Total packets | Discarded packets |
| A | 0 | 108 | 0 |
| B | 0 | 108 | 0 |
| C | 0 | 108 | 0 |
| D | 0 | 108 | 0 |
| Mode M9 | |||
|---|---|---|---|
| Quadrant | BADHDUFLAG | Total packets | Discarded packets |
| A | 0 | 16 | 0 |
| B | 0 | 16 | 0 |
| C | 0 | 16 | 0 |
| D | 0 | 16 | 0 |
| Mode M0 | |||
|---|---|---|---|
| Quadrant | BADHDUFLAG | Total packets | Discarded packets |
| A | 0 | 23513 | 3 |
| B | 0 | 23709 | 1 |
| C | 0 | 21597 | 1 |
| D | 0 | 27620 | 1 |
| Quadrant | Total seconds | Saturated seconds | Saturation percentage |
|---|---|---|---|
| A | 5285 | 3 | 0.056764% |
| B | 5256 | 14 | 0.266362% |
| C | 5285 | 8 | 0.151372% |
| D | 5257 | 217 | 4.127830% |
Noise dominated data is calculated using 1-second bins in cleaned event files. If a bin has >2000 counts, and if more than 50% of those come from <1% of pixels, then it is considered to be noise-dominated and hence unusable.
| Quadrant | # 1 sec bins | Bins with >0 counts | Bins with >2000 counts | High rate bins dominated by noise | Noise dominated (total time) | Noise dominated (detector-on time) | Marked lightcurve |
|---|---|---|---|---|---|---|---|
| A | 6910 | 5288 | 183 | 183 | 2.65% | 3.46% | 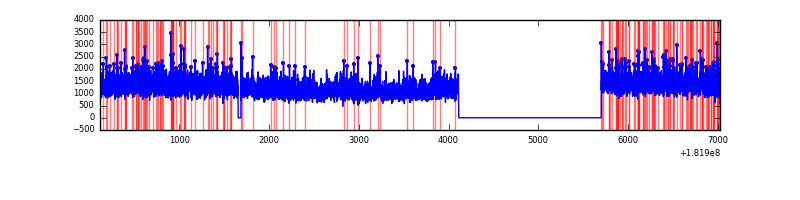 |
| B | 6910 | 5259 | 171 | 171 | 2.47% | 3.25% | 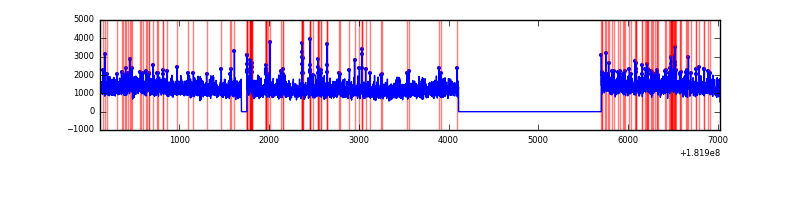 |
| C | 6910 | 5288 | 66 | 66 | 0.96% | 1.25% | 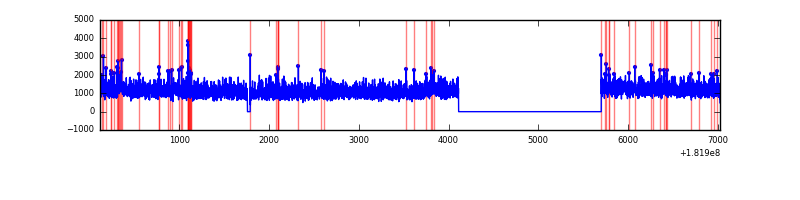 |
| D | 6910 | 5260 | 732 | 732 | 10.59% | 13.92% | 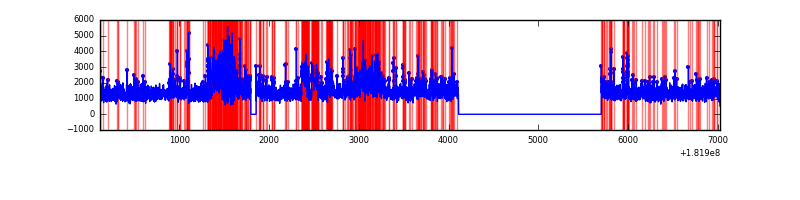 |
Top three noisy pixels from each quadrant. If the there are fewer than three noisy pixels in the level2.evt file, extra rows are filled as -1
| Pixel properties | Quadrant properties | ||||||
|---|---|---|---|---|---|---|---|
| Quadrant | DetID | PixID | Counts | Sigma | Mean | Median | Sigma |
| A | 14 | 171 | 17536 | 55.86 | 1698 | 1655 | 284.3 |
| A | 0 | 166 | 12078 | 36.66 | 1698 | 1655 | 284.3 |
| A | 14 | 187 | 9275 | 26.8 | 1698 | 1655 | 284.3 |
| B | 8 | 236 | 129157 | 349.25 | 1630 | 1632 | 365.1 |
| B | 0 | 151 | 58972 | 157.03 | 1630 | 1632 | 365.1 |
| B | 2 | 2 | 51181 | 135.7 | 1630 | 1632 | 365.1 |
| C | 0 | 203 | 46708 | 107.34 | 1484 | 1533 | 420.9 |
| C | 5 | 251 | 26695 | 59.79 | 1484 | 1533 | 420.9 |
| C | 5 | 203 | 25419 | 56.76 | 1484 | 1533 | 420.9 |
| D | 12 | 141 | 233285 | 558.53 | 1561 | 1570 | 414.9 |
| D | 10 | 171 | 221815 | 530.89 | 1561 | 1570 | 414.9 |
| D | 13 | 223 | 217454 | 520.37 | 1561 | 1570 | 414.9 |
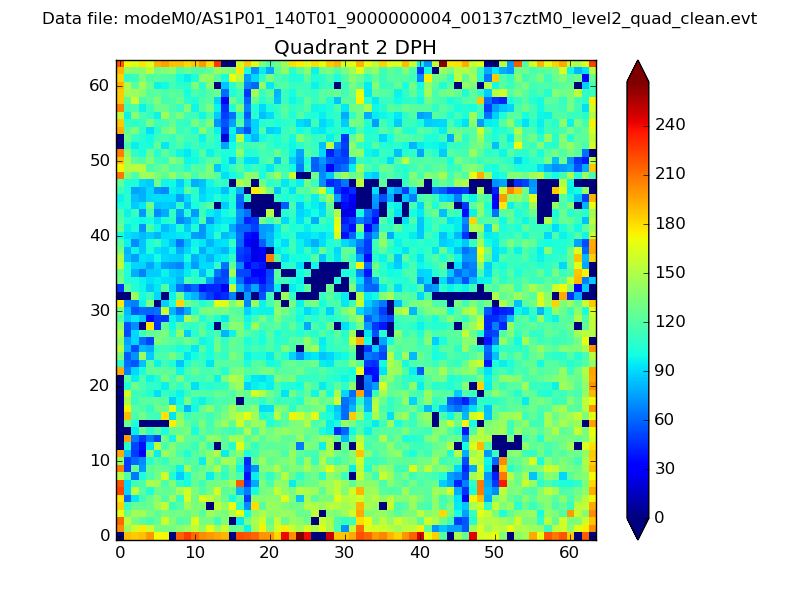
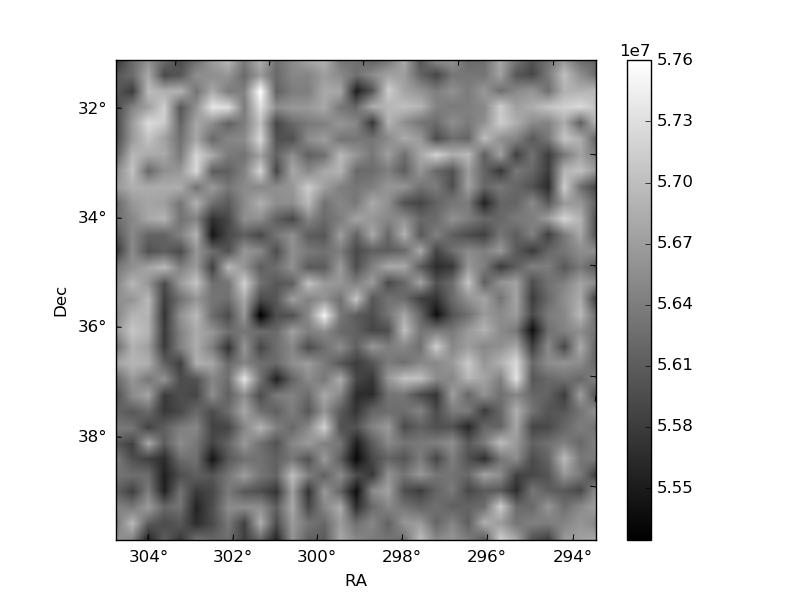
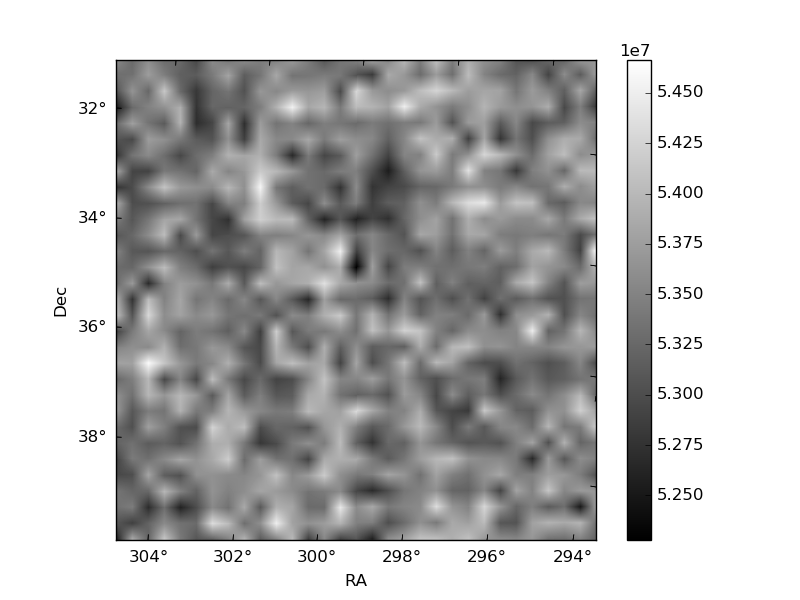
Histogram calculated using DETX and DETY for each event in the final _common_clean file
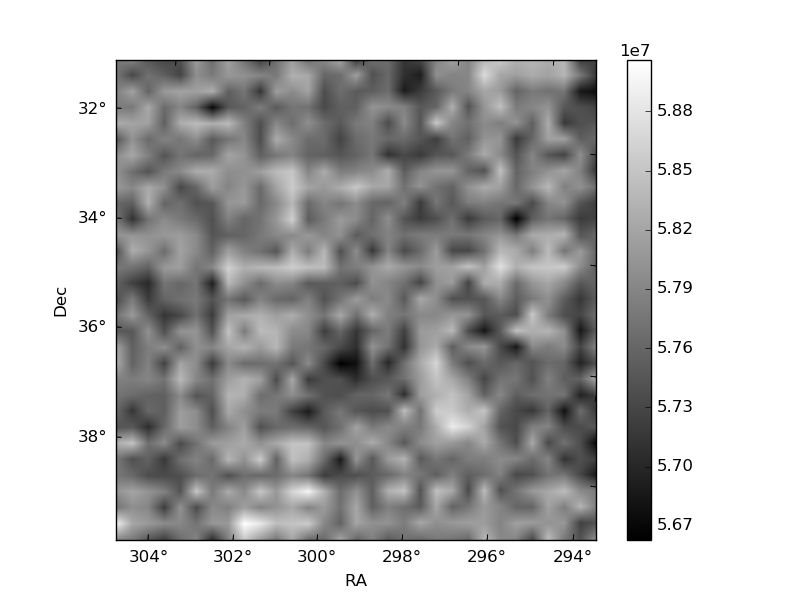
| Quadrant A | 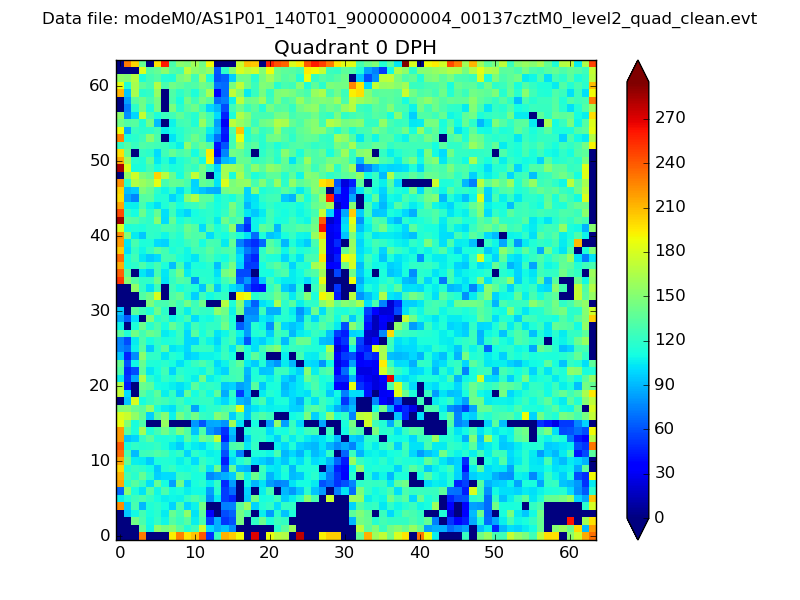 |
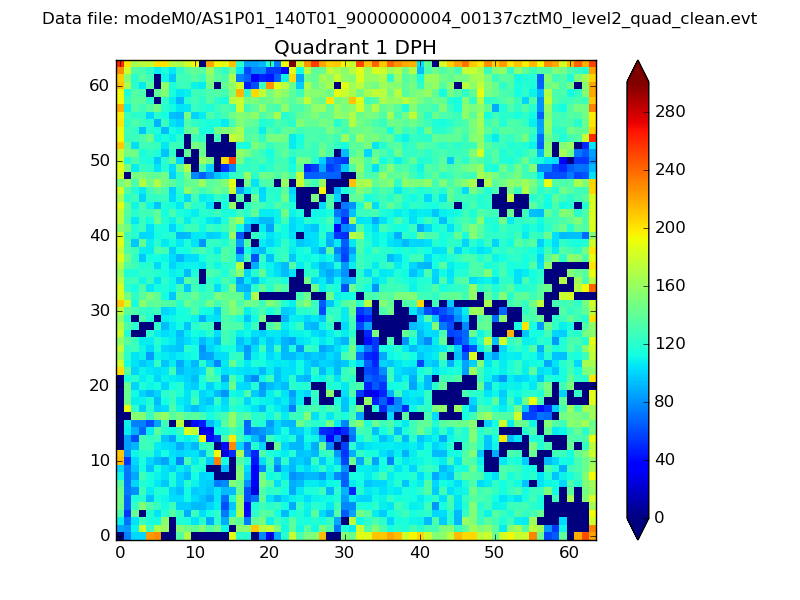 |
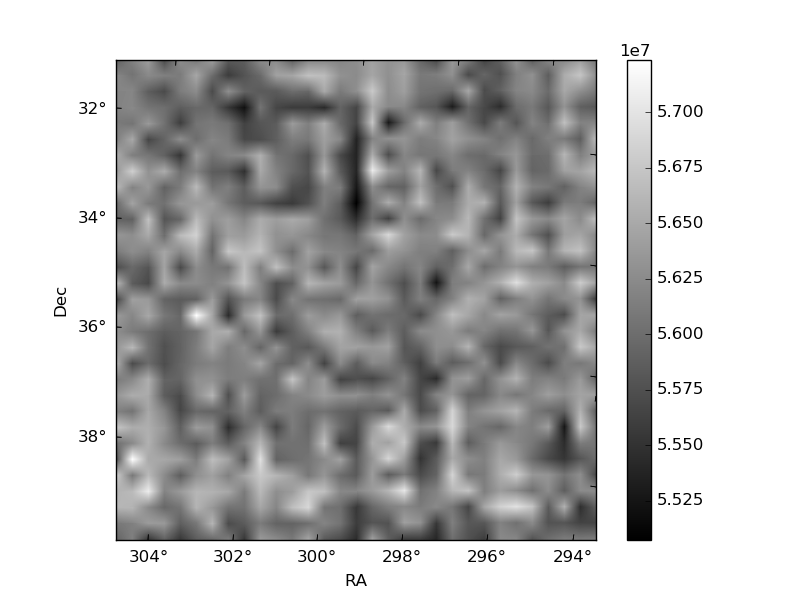
Quadrant B |
|---|---|---|---|
| Quadrant D | 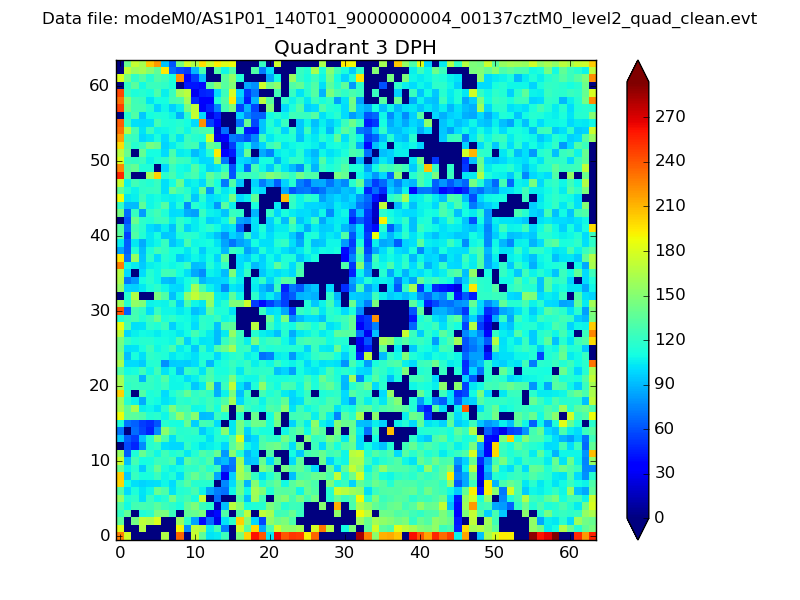 |
 |
Quadrant C |
| Plot type | Count rate plots | Images |
|---|---|---|
| Comparison with Poisson distribution Blue bars denote a histogram of data divided into 1 sec bins. Red curve is a Poisson curve with rate = median count rate of data. |
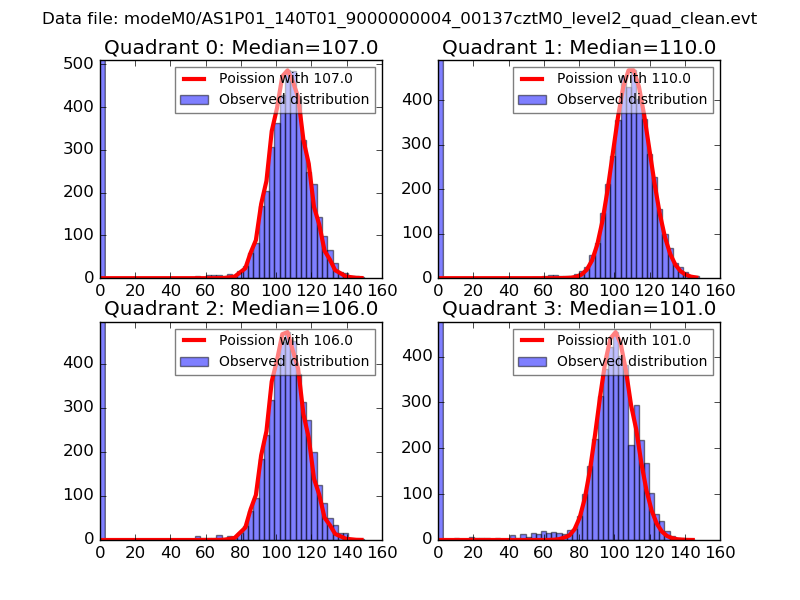 |
 |
| Quadrant-wise count rates Data is divided into 100 sec bins |
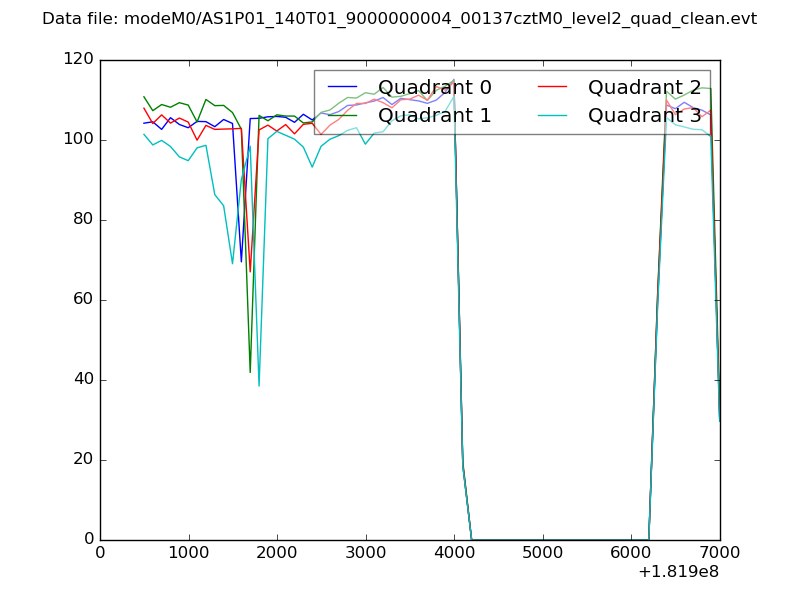 |
|
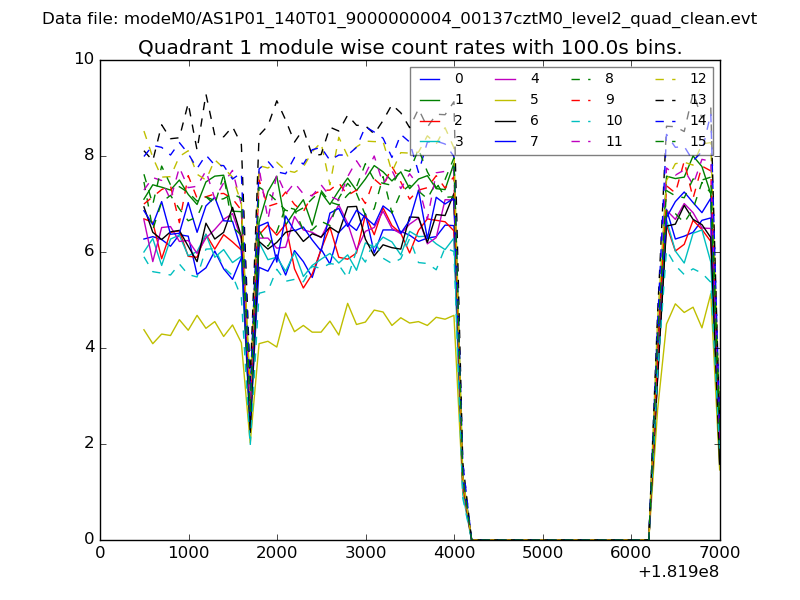
| Module-wise count rates for Quadrant A Data is divided into 100 sec bins |
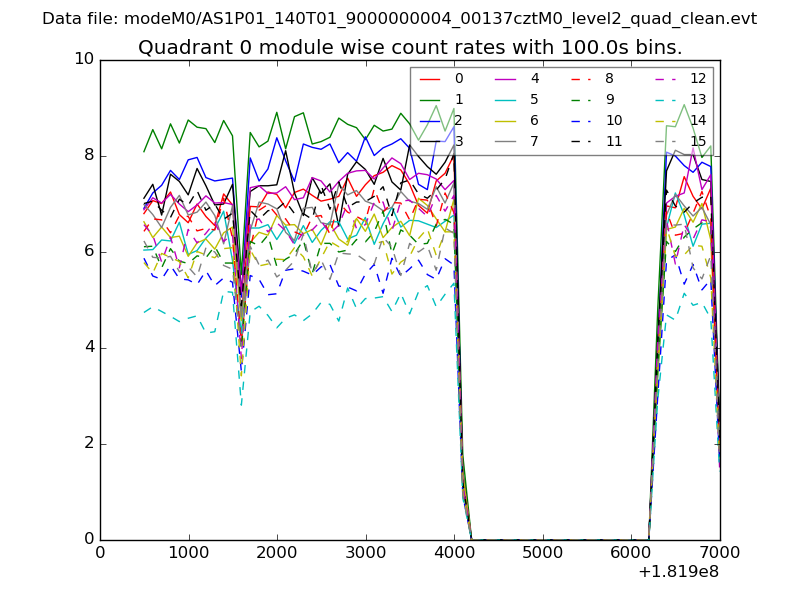 |
 |
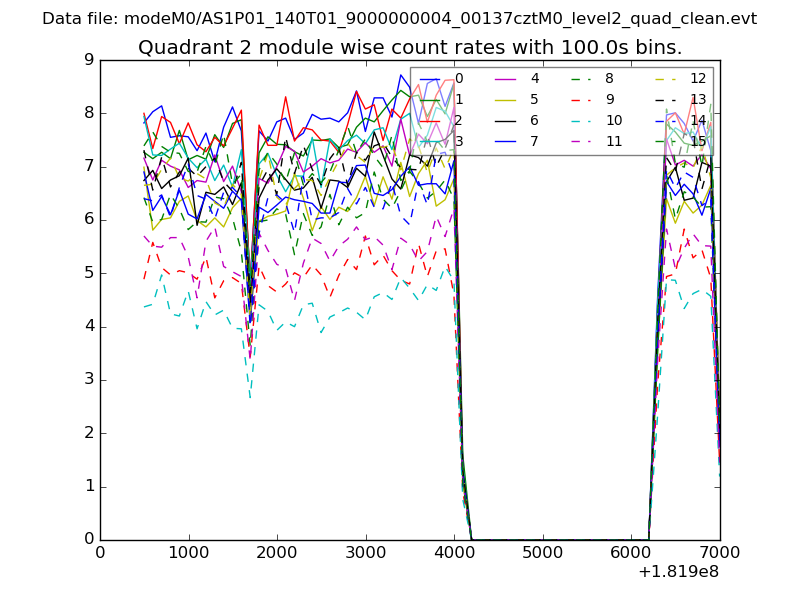
| Module-wise count rates for Quadrant B Data is divided into 100 sec bins |
 |
 |
| Module-wise count rates for Quadrant C Data is divided into 100 sec bins |
 |
 |
| Module-wise count rates for Quadrant D Data is divided into 100 sec bins |
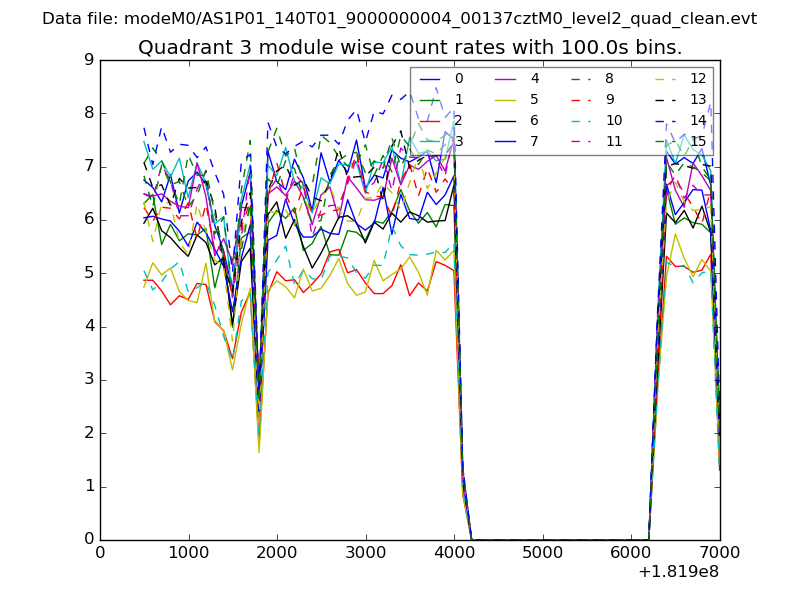 |
 |
| Parameter | Plot |
|---|---|
| CZT HV Monitor | 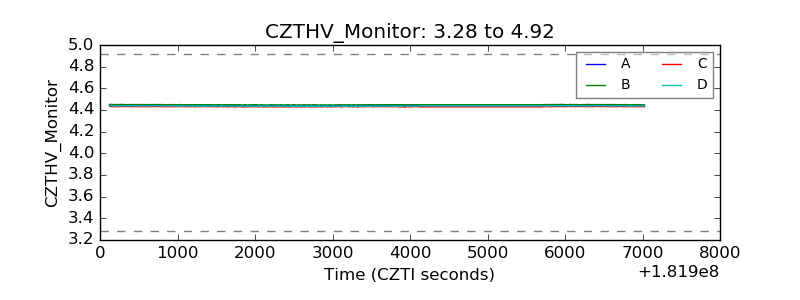 |
| D_VDD | 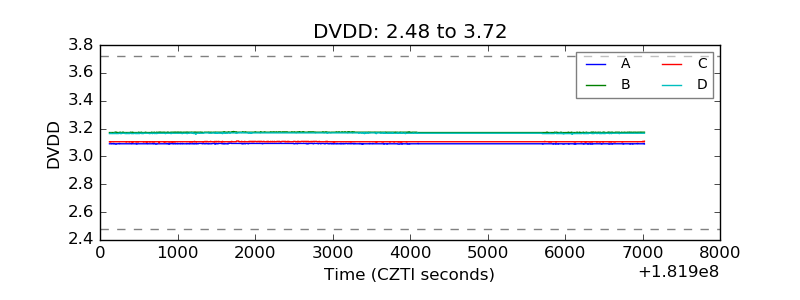 |
| Temperature 1 | 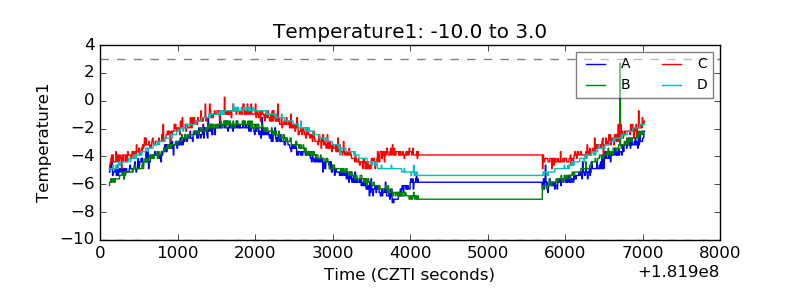 |
| Veto HV Monitor | 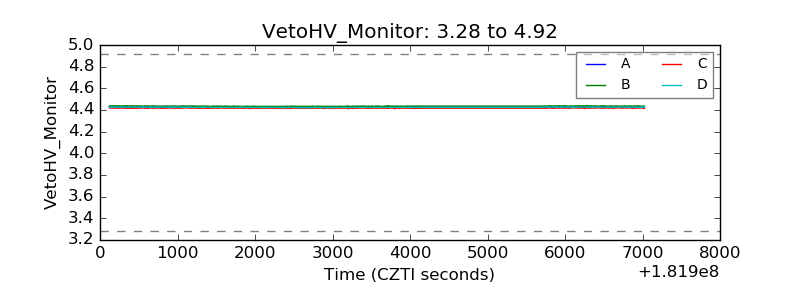 |
| Veto LLD | 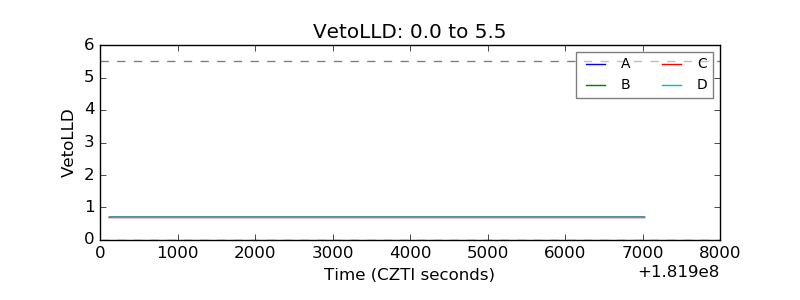 |
| Alpha Counter | 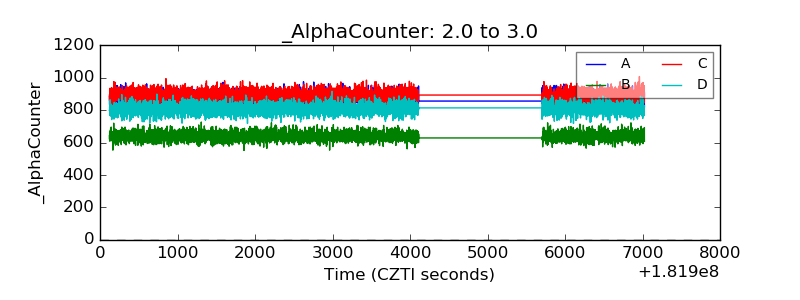 |
| _CPM_Rate | 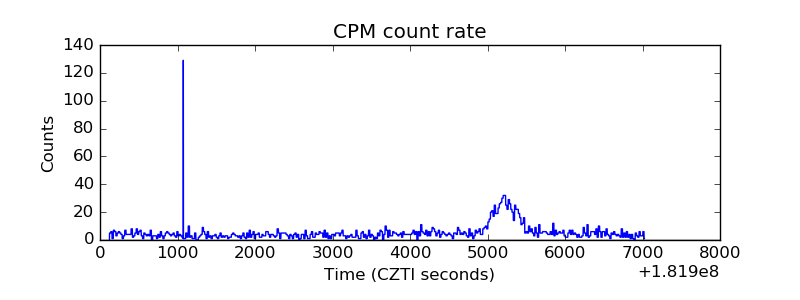 |
| CZT Counter | 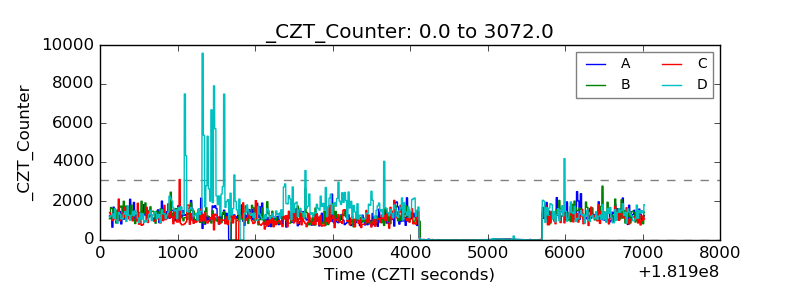 |
| +2.5 Volts monitor |  |
| +5 Volts monitor |  |
| _ROLL_ROT | 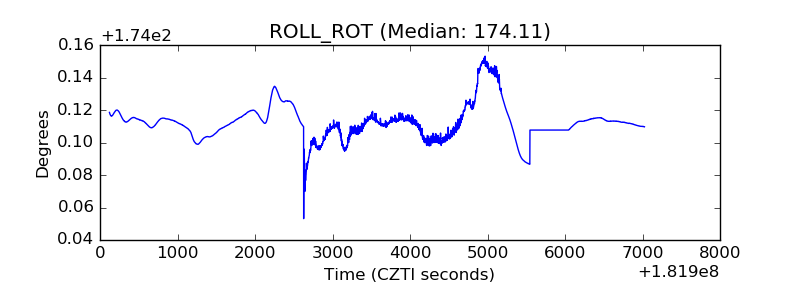 |
| _Roll_DEC |  |
| _Roll_RA | 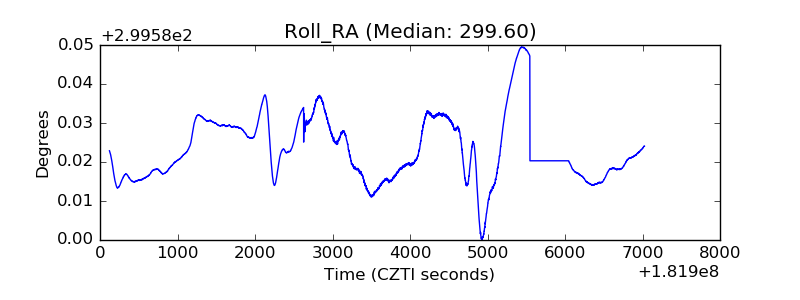 |
| Veto Counter |  |