| Param | Original file | Final file |
|---|---|---|
| Filename | modeM0/AS1P01_140T01_9000000004_00138cztM0_level2.evt | modeM0/AS1P01_140T01_9000000004_00138cztM0_level2_quad_clean.evt |
| Size (bytes) | 981,426,240 | 80,648,640 |
| Size | 936.0 MB | 76.9 MB |
| Events in quadrant A | 7,113,748 | 517,435 |
| Events in quadrant B | 7,118,038 | 529,704 |
| Events in quadrant C | 6,318,174 | 513,368 |
| Events in quadrant D | 8,800,021 | 487,830 |
| Mode SS | |||
|---|---|---|---|
| Quadrant | BADHDUFLAG | Total packets | Discarded packets |
| A | 0 | 116 | 0 |
| B | 0 | 116 | 0 |
| C | 0 | 116 | 0 |
| D | 0 | 116 | 0 |
| Mode M9 | |||
|---|---|---|---|
| Quadrant | BADHDUFLAG | Total packets | Discarded packets |
| A | 0 | 16 | 0 |
| B | 0 | 16 | 0 |
| C | 0 | 16 | 0 |
| D | 0 | 16 | 0 |
| Mode M0 | |||
|---|---|---|---|
| Quadrant | BADHDUFLAG | Total packets | Discarded packets |
| A | 0 | 25082 | 2 |
| B | 0 | 25098 | 1 |
| C | 0 | 22759 | 1 |
| D | 0 | 30104 | 1 |
| Quadrant | Total seconds | Saturated seconds | Saturation percentage |
|---|---|---|---|
| A | 5626 | 6 | 0.106648% |
| B | 5626 | 11 | 0.195521% |
| C | 5626 | 3 | 0.053324% |
| D | 5626 | 152 | 2.701742% |
Noise dominated data is calculated using 1-second bins in cleaned event files. If a bin has >2000 counts, and if more than 50% of those come from <1% of pixels, then it is considered to be noise-dominated and hence unusable.
| Quadrant | # 1 sec bins | Bins with >0 counts | Bins with >2000 counts | High rate bins dominated by noise | Noise dominated (total time) | Noise dominated (detector-on time) | Marked lightcurve |
|---|---|---|---|---|---|---|---|
| A | 7218 | 5628 | 228 | 228 | 3.16% | 4.05% | 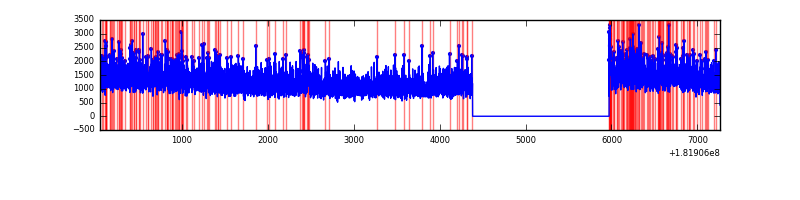 |
| B | 7218 | 5628 | 198 | 198 | 2.74% | 3.52% | 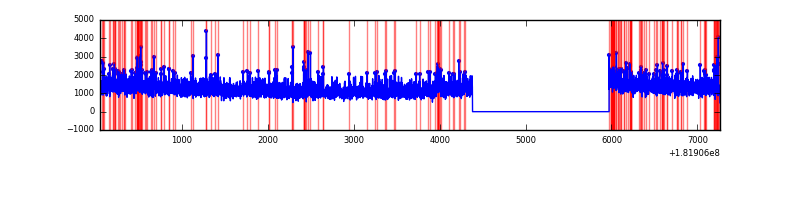 |
| C | 7218 | 5628 | 46 | 46 | 0.64% | 0.82% | 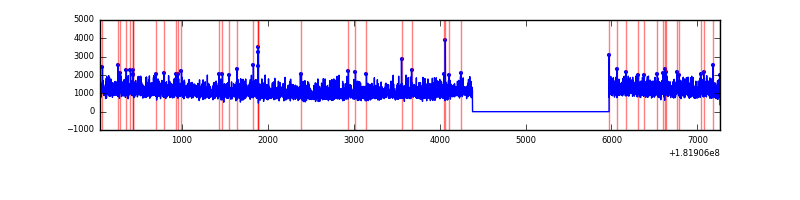 |
| D | 7218 | 5628 | 899 | 899 | 12.45% | 15.97% | 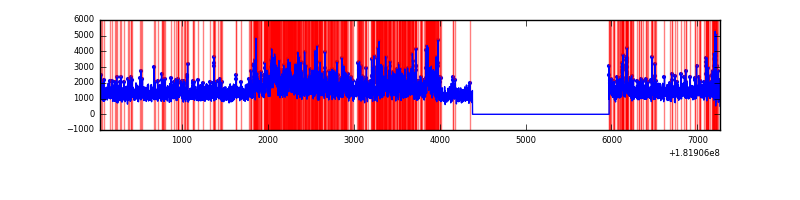 |
Top three noisy pixels from each quadrant. If the there are fewer than three noisy pixels in the level2.evt file, extra rows are filled as -1
| Pixel properties | Quadrant properties | ||||||
|---|---|---|---|---|---|---|---|
| Quadrant | DetID | PixID | Counts | Sigma | Mean | Median | Sigma |
| A | 12 | 150 | 25327 | 78.99 | 1810 | 1764 | 298.3 |
| A | 14 | 10 | 18602 | 56.45 | 1810 | 1764 | 298.3 |
| A | 0 | 166 | 13132 | 38.11 | 1810 | 1764 | 298.3 |
| B | 8 | 236 | 117537 | 294.03 | 1746 | 1749 | 393.8 |
| B | 8 | 5 | 49080 | 120.19 | 1746 | 1749 | 393.8 |
| B | 14 | 50 | 39031 | 94.67 | 1746 | 1749 | 393.8 |
| C | 9 | 204 | 21229 | 44.14 | 1580 | 1636 | 443.9 |
| C | 2 | 37 | 13773 | 27.34 | 1580 | 1636 | 443.9 |
| C | 3 | 0 | 12173 | 23.74 | 1580 | 1636 | 443.9 |
| D | 0 | 243 | 1497479 | 3372.57 | 1681 | 1691 | 443.5 |
| D | 10 | 171 | 99535 | 220.61 | 1681 | 1691 | 443.5 |
| D | 2 | 154 | 89476 | 197.93 | 1681 | 1691 | 443.5 |
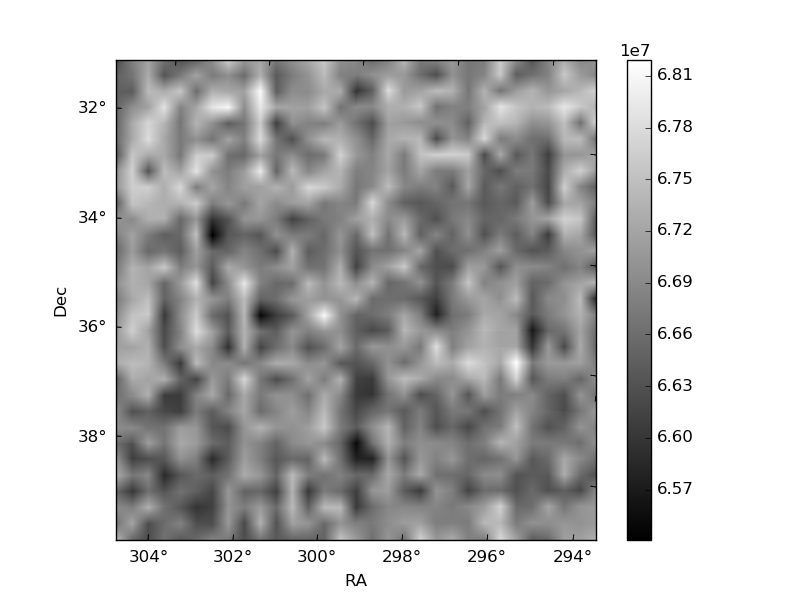
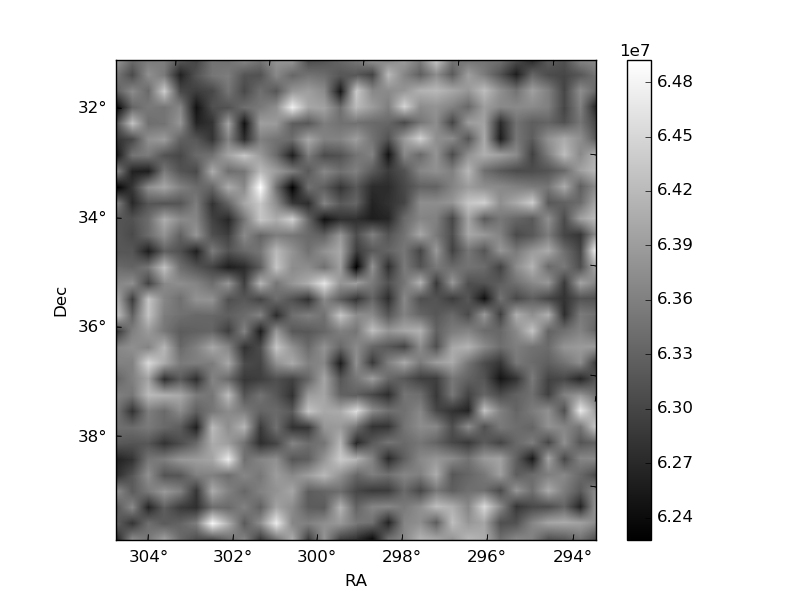
Histogram calculated using DETX and DETY for each event in the final _common_clean file
| Quadrant A |  |
 |
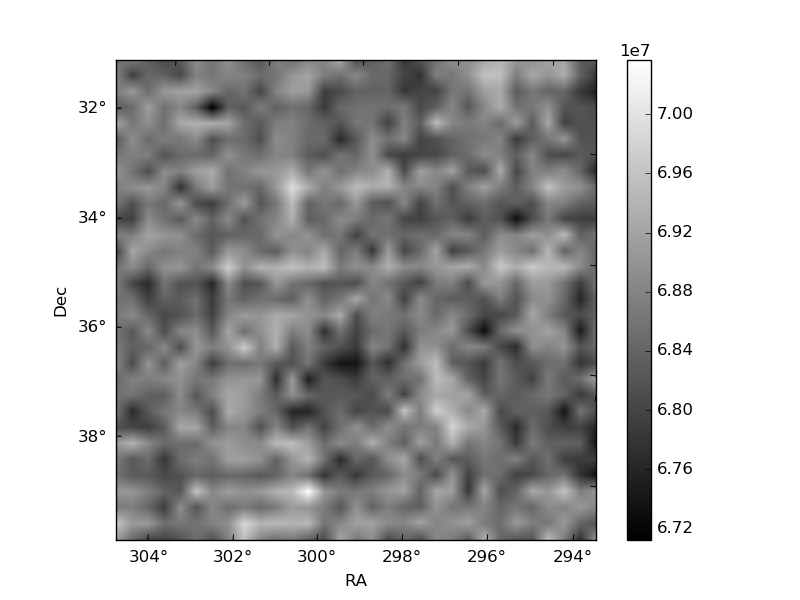
Quadrant B |
|---|---|---|---|
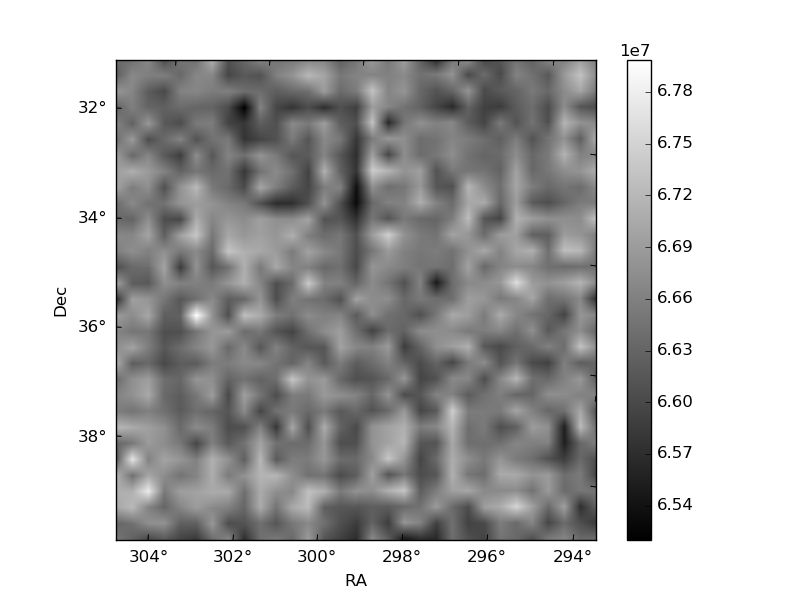
| Quadrant D |  |
 |
Quadrant C |
| Plot type | Count rate plots | Images |
|---|---|---|
| Comparison with Poisson distribution Blue bars denote a histogram of data divided into 1 sec bins. Red curve is a Poisson curve with rate = median count rate of data. |
 |
 |
| Quadrant-wise count rates Data is divided into 100 sec bins |
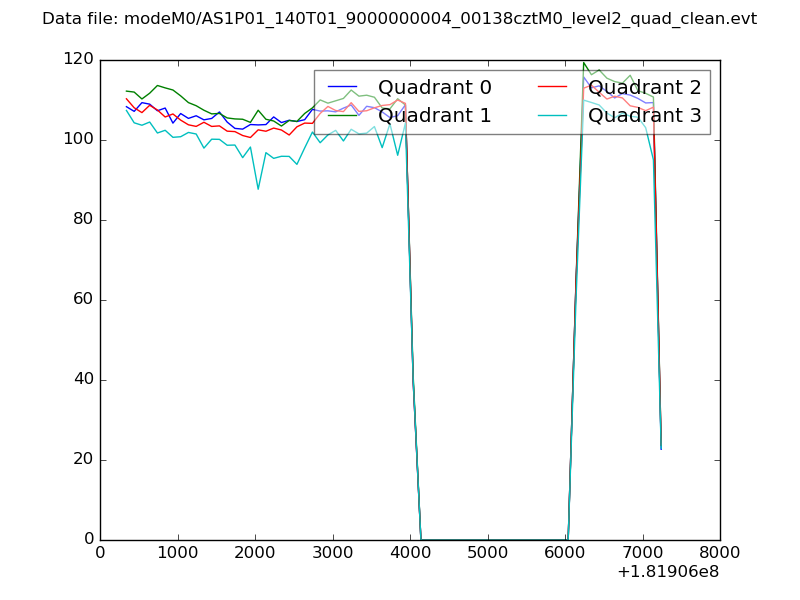 |
|
| Module-wise count rates for Quadrant A Data is divided into 100 sec bins |
 |
 |
| Module-wise count rates for Quadrant B Data is divided into 100 sec bins |
 |
 |
| Module-wise count rates for Quadrant C Data is divided into 100 sec bins |
 |
 |
| Module-wise count rates for Quadrant D Data is divided into 100 sec bins |
 |
 |
| Parameter | Plot |
|---|---|
| CZT HV Monitor |  |
| D_VDD | 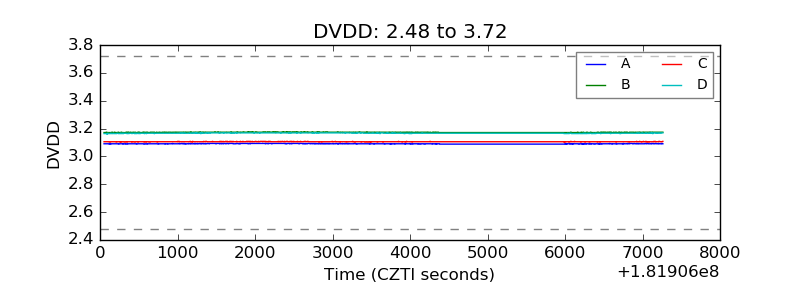 |
| Temperature 1 |  |
| Veto HV Monitor | 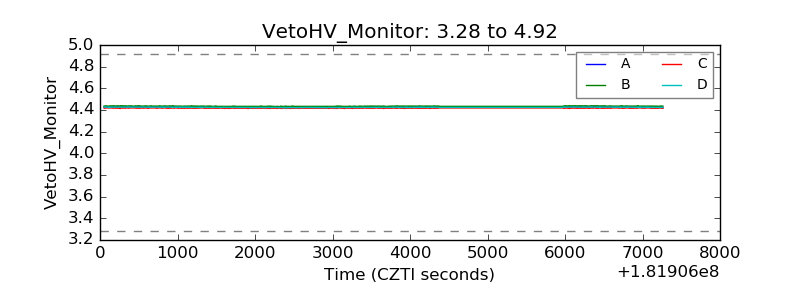 |
| Veto LLD | 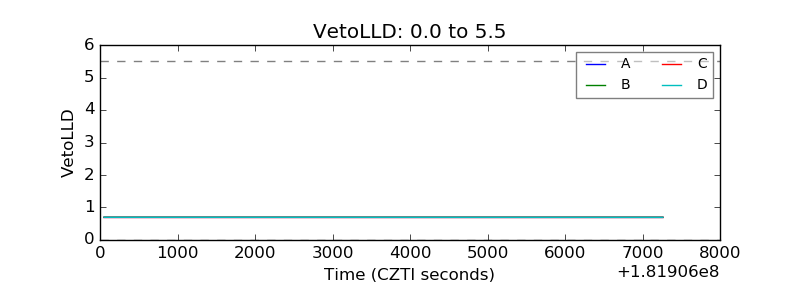 |
| Alpha Counter | 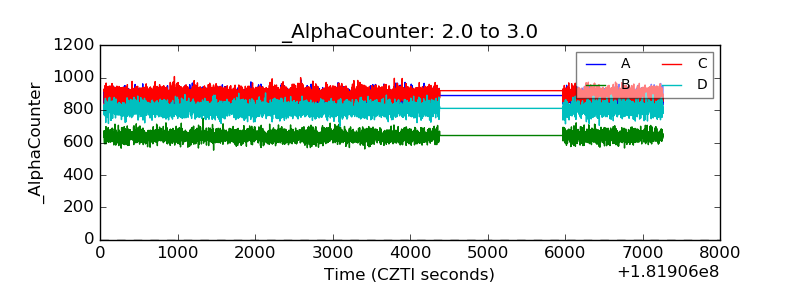 |
| _CPM_Rate | 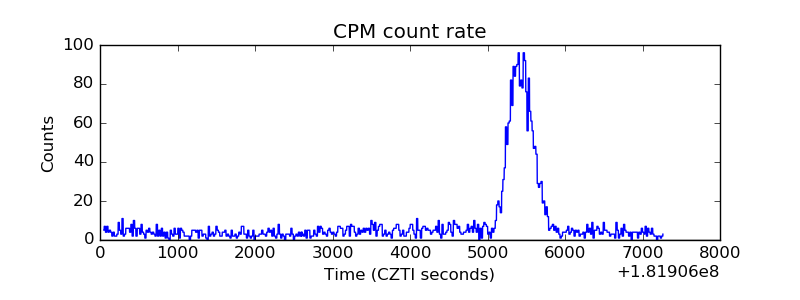 |
| CZT Counter |  |
| +2.5 Volts monitor | 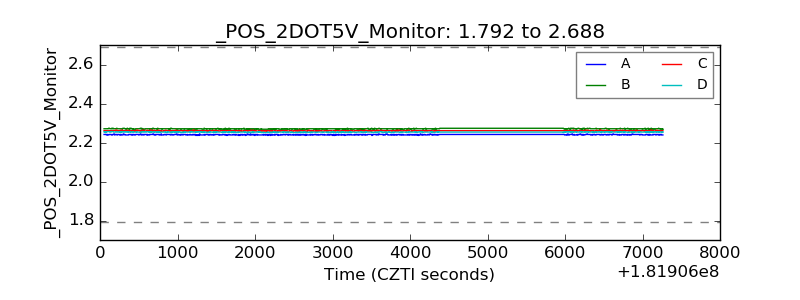 |
| +5 Volts monitor | 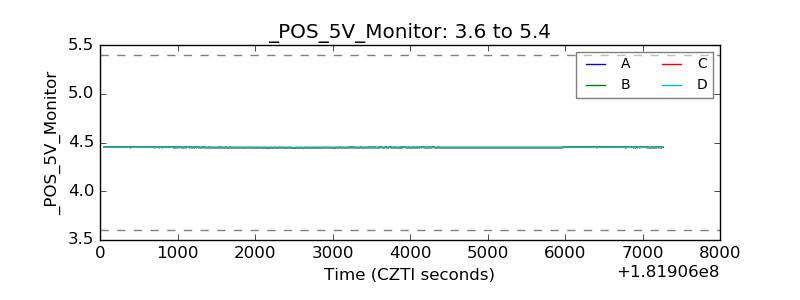 |
| _ROLL_ROT |  |
| _Roll_DEC | 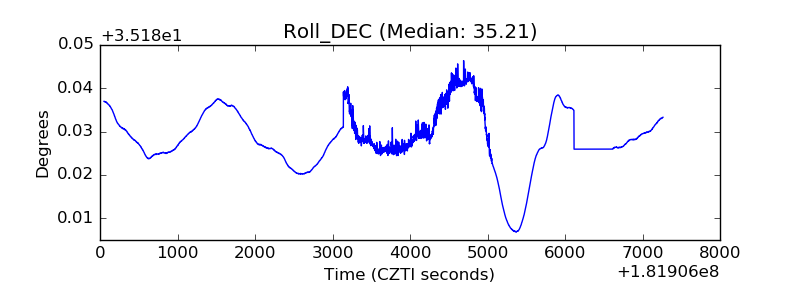 |
| _Roll_RA |  |
| Veto Counter |  |