| Param | Original file | Final file |
|---|---|---|
| Filename | modeM0/AS1P01_140T01_9000000004_00141cztM0_level2.evt | modeM0/AS1P01_140T01_9000000004_00141cztM0_level2_quad_clean.evt |
| Size (bytes) | 884,390,400 | 67,838,400 |
| Size | 843.4 MB | 64.7 MB |
| Events in quadrant A | 6,742,593 | 422,468 |
| Events in quadrant B | 6,449,429 | 437,445 |
| Events in quadrant C | 5,742,656 | 425,410 |
| Events in quadrant D | 7,498,885 | 399,064 |
| Mode SS | |||
|---|---|---|---|
| Quadrant | BADHDUFLAG | Total packets | Discarded packets |
| A | 0 | 106 | 0 |
| B | 0 | 106 | 0 |
| C | 0 | 106 | 0 |
| D | 0 | 106 | 0 |
| Mode M9 | |||
|---|---|---|---|
| Quadrant | BADHDUFLAG | Total packets | Discarded packets |
| A | 0 | 16 | 0 |
| B | 0 | 16 | 0 |
| C | 0 | 16 | 0 |
| D | 0 | 16 | 0 |
| Mode M0 | |||
|---|---|---|---|
| Quadrant | BADHDUFLAG | Total packets | Discarded packets |
| A | 0 | 23809 | 2 |
| B | 0 | 22897 | 1 |
| C | 0 | 20804 | 1 |
| D | 0 | 26035 | 1 |
| Quadrant | Total seconds | Saturated seconds | Saturation percentage |
|---|---|---|---|
| A | 5283 | 131 | 2.479652% |
| B | 5283 | 14 | 0.265001% |
| C | 5283 | 3 | 0.056786% |
| D | 5283 | 251 | 4.751088% |
Noise dominated data is calculated using 1-second bins in cleaned event files. If a bin has >2000 counts, and if more than 50% of those come from <1% of pixels, then it is considered to be noise-dominated and hence unusable.
| Quadrant | # 1 sec bins | Bins with >0 counts | Bins with >2000 counts | High rate bins dominated by noise | Noise dominated (total time) | Noise dominated (detector-on time) | Marked lightcurve |
|---|---|---|---|---|---|---|---|
| A | 6875 | 5285 | 372 | 372 | 5.41% | 7.04% | 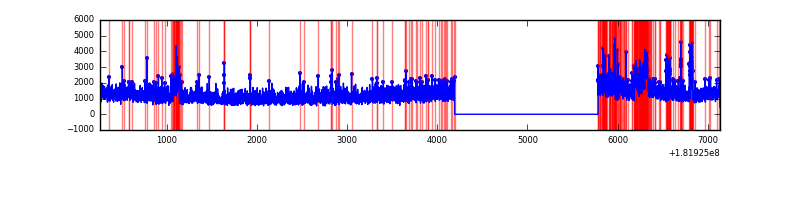 |
| B | 6875 | 5285 | 135 | 135 | 1.96% | 2.55% | 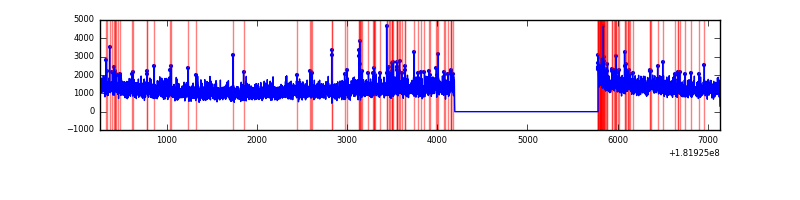 |
| C | 6875 | 5285 | 41 | 41 | 0.60% | 0.78% | 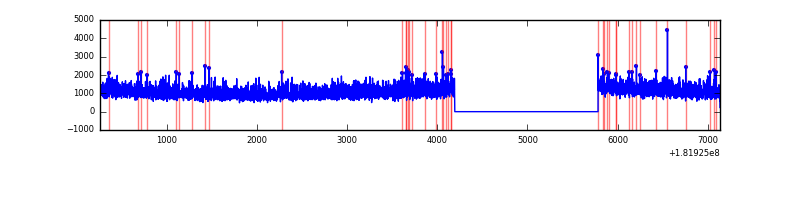 |
| D | 6875 | 5285 | 645 | 645 | 9.38% | 12.20% | 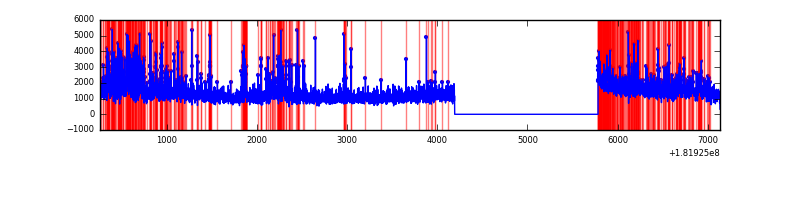 |
Top three noisy pixels from each quadrant. If the there are fewer than three noisy pixels in the level2.evt file, extra rows are filled as -1
| Pixel properties | Quadrant properties | ||||||
|---|---|---|---|---|---|---|---|
| Quadrant | DetID | PixID | Counts | Sigma | Mean | Median | Sigma |
| A | 15 | 22 | 476074 | 1876.97 | 1563 | 1527 | 252.8 |
| A | 13 | 224 | 102081 | 397.72 | 1563 | 1527 | 252.8 |
| A | 12 | 150 | 24243 | 89.85 | 1563 | 1527 | 252.8 |
| B | 8 | 236 | 121718 | 347.99 | 1565 | 1562 | 345.3 |
| B | 5 | 216 | 78063 | 221.56 | 1565 | 1562 | 345.3 |
| B | 0 | 255 | 44650 | 124.79 | 1565 | 1562 | 345.3 |
| C | 3 | 32 | 10074 | 21.12 | 1448 | 1501 | 405.9 |
| C | 10 | 56 | 7130 | 13.87 | 1448 | 1501 | 405.9 |
| C | 2 | 192 | 6891 | 13.28 | 1448 | 1501 | 405.9 |
| D | 1 | 30 | 150206 | 375.72 | 1565 | 1524 | 395.7 |
| D | 14 | 53 | 147686 | 369.35 | 1565 | 1524 | 395.7 |
| D | 13 | 222 | 86101 | 213.73 | 1565 | 1524 | 395.7 |
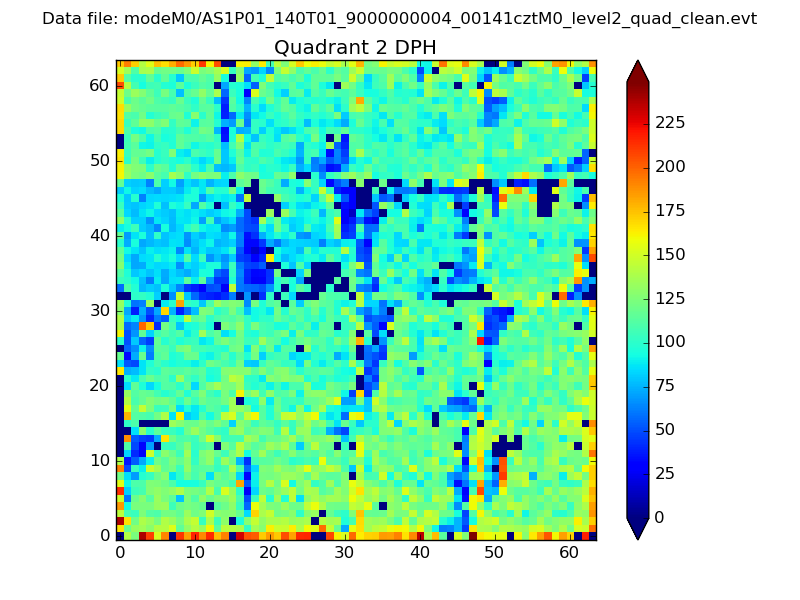
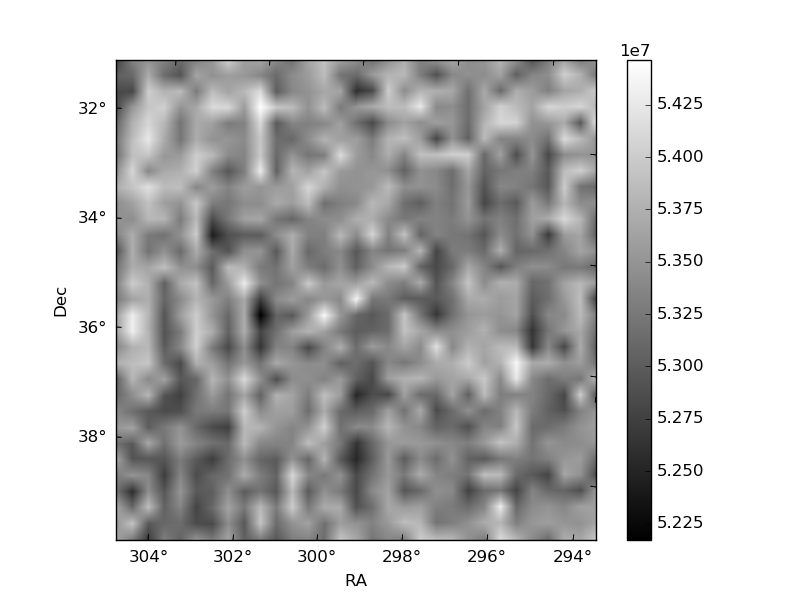
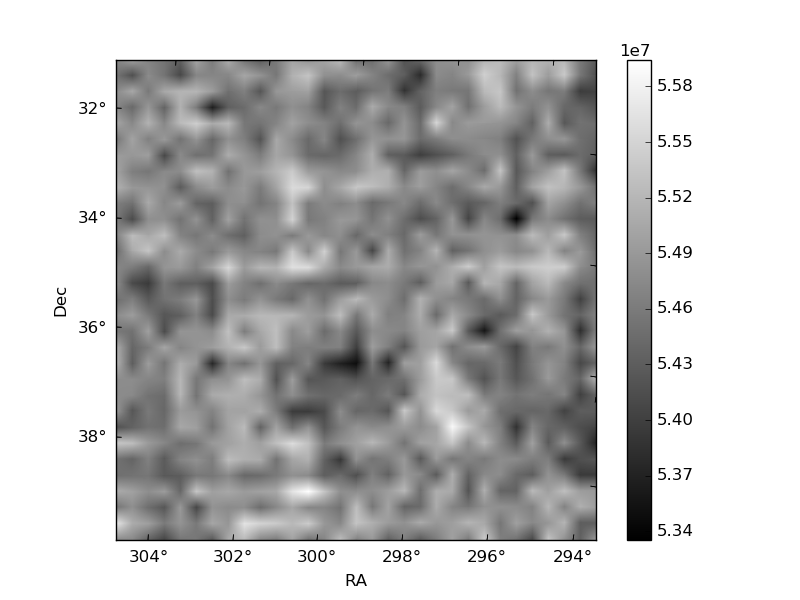
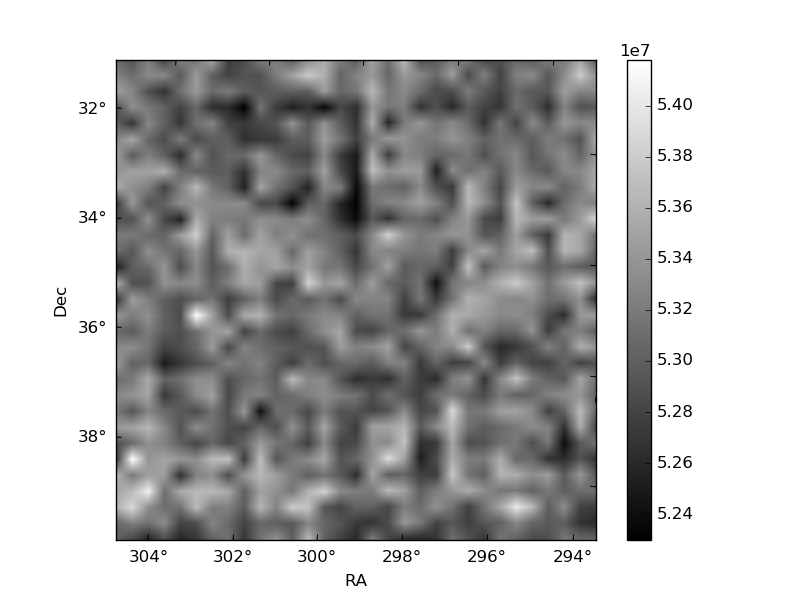
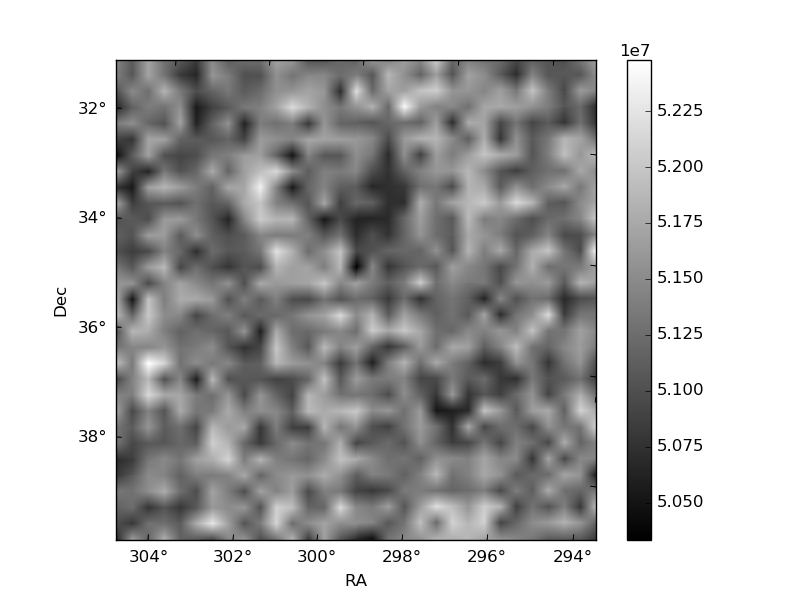
Histogram calculated using DETX and DETY for each event in the final _common_clean file
| Quadrant A | 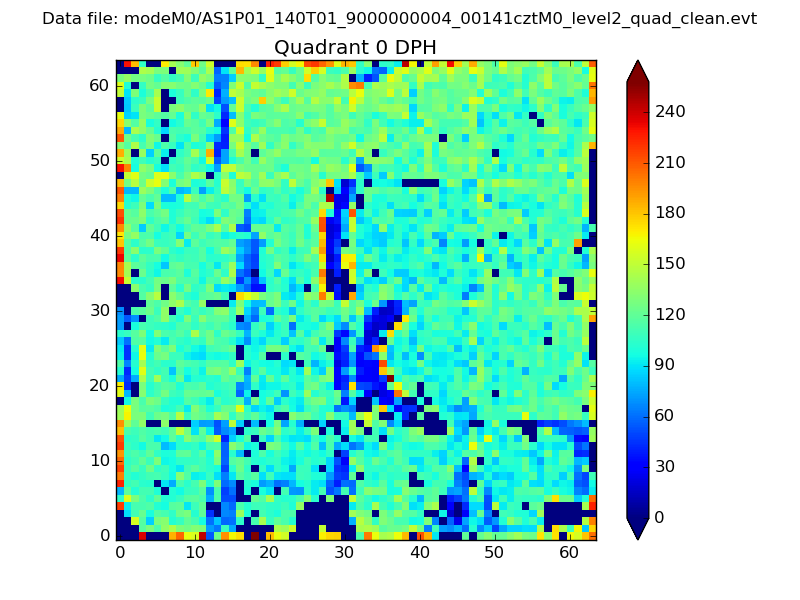 |
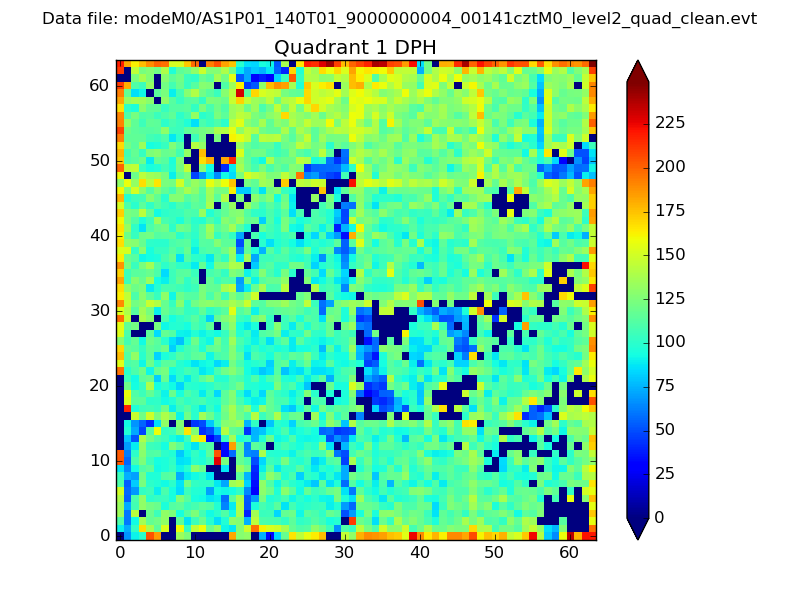 |
Quadrant B |
|---|---|---|---|
| Quadrant D | 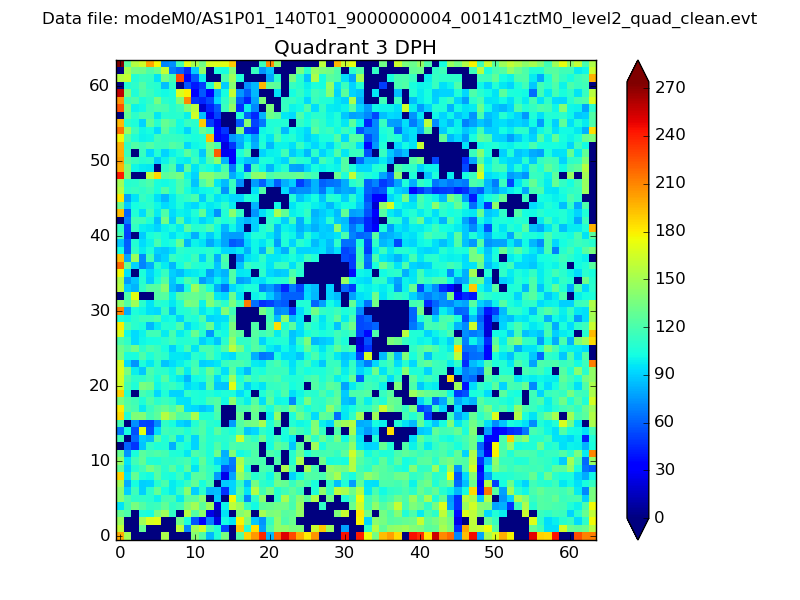 |
 |
Quadrant C |
| Plot type | Count rate plots | Images |
|---|---|---|
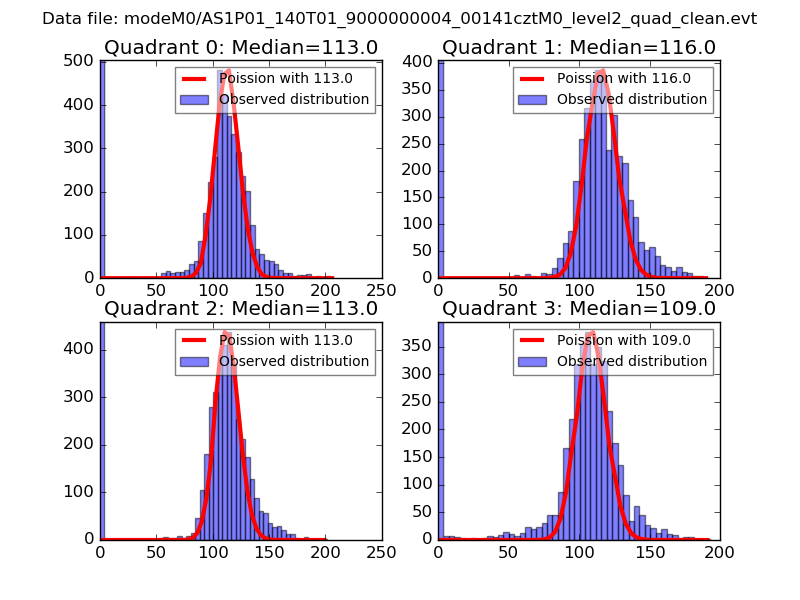
| Comparison with Poisson distribution Blue bars denote a histogram of data divided into 1 sec bins. Red curve is a Poisson curve with rate = median count rate of data. |
 |
 |
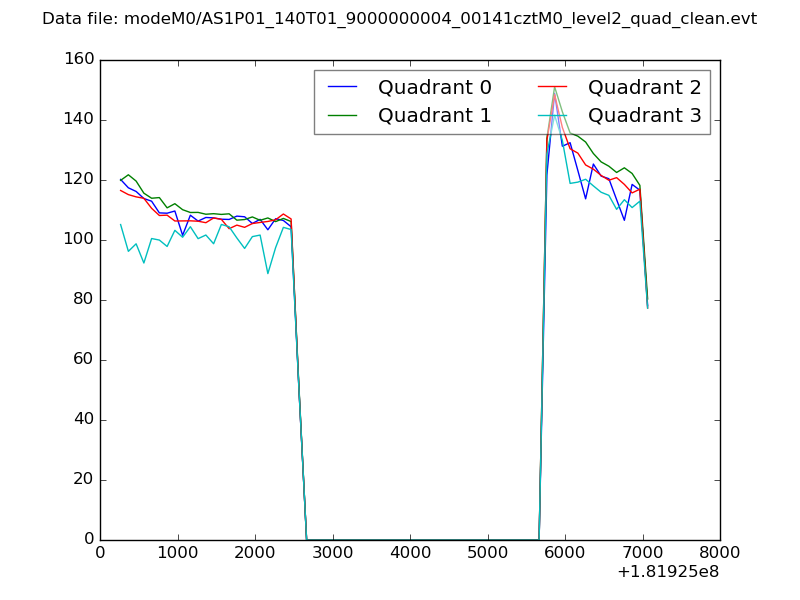
| Quadrant-wise count rates Data is divided into 100 sec bins |
 |
|
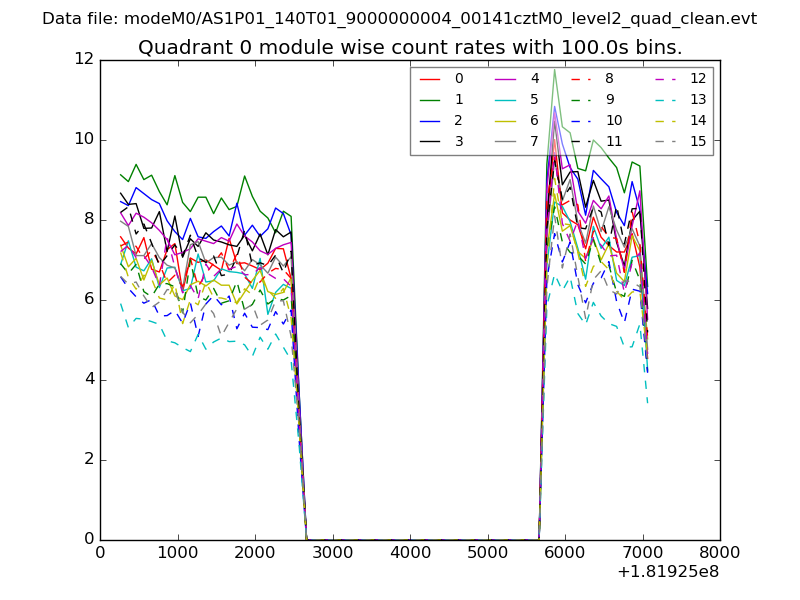
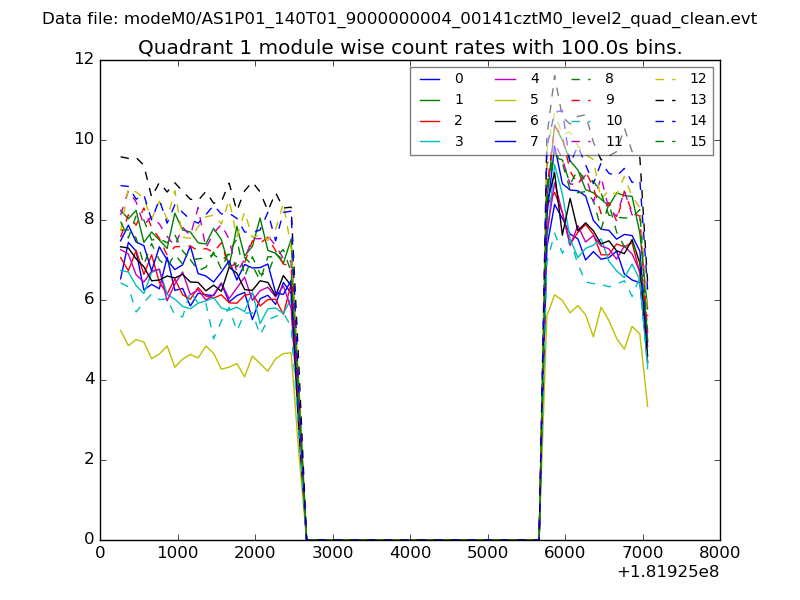
| Module-wise count rates for Quadrant A Data is divided into 100 sec bins |
 |
 |
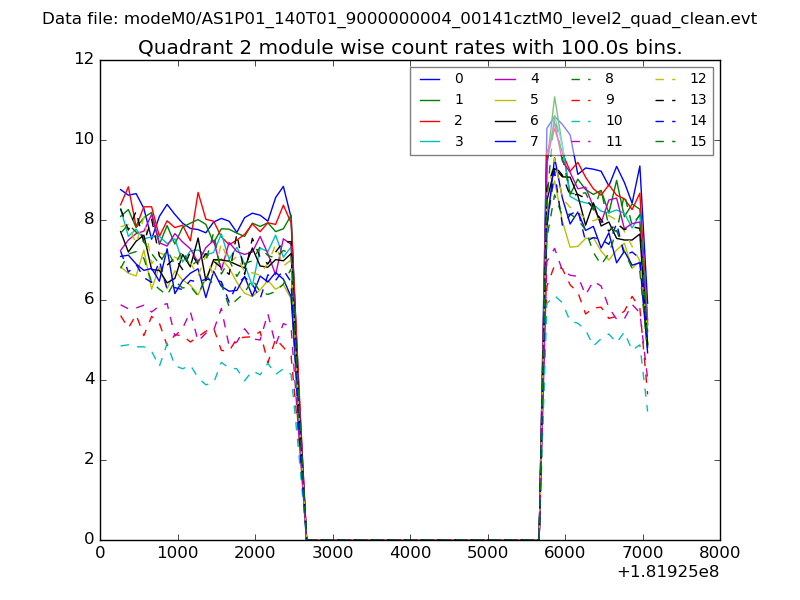
| Module-wise count rates for Quadrant B Data is divided into 100 sec bins |
 |
 |
| Module-wise count rates for Quadrant C Data is divided into 100 sec bins |
 |
 |
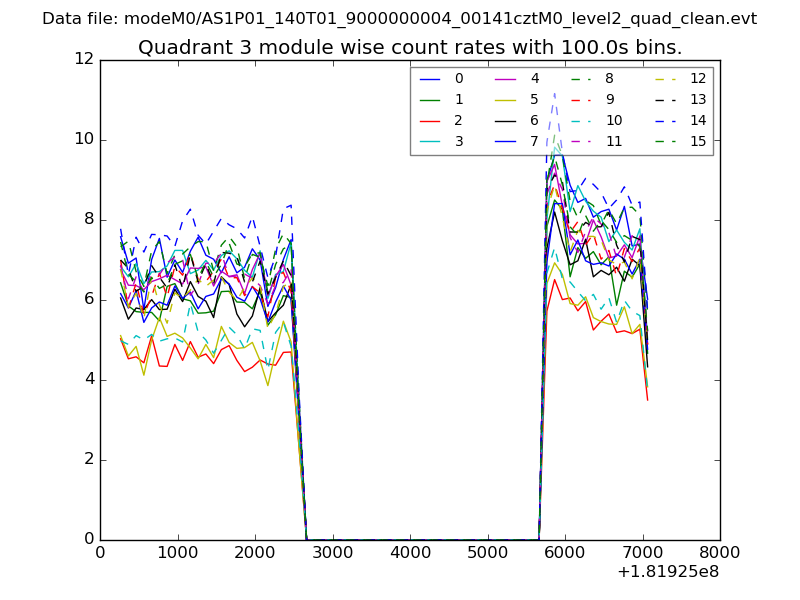
| Module-wise count rates for Quadrant D Data is divided into 100 sec bins |
 |
 |
| Parameter | Plot |
|---|---|
| CZT HV Monitor | 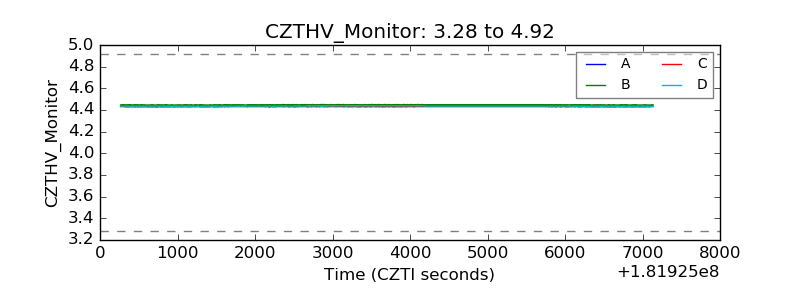 |
| D_VDD | 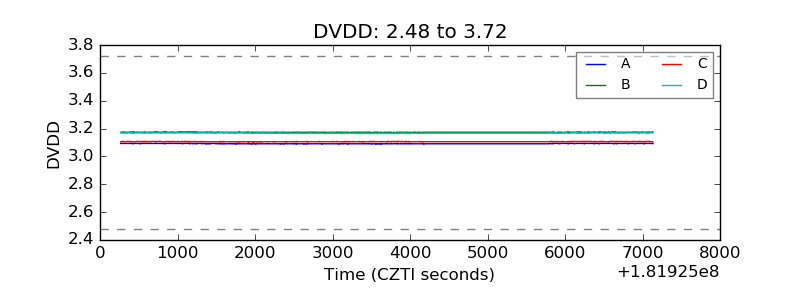 |
| Temperature 1 | 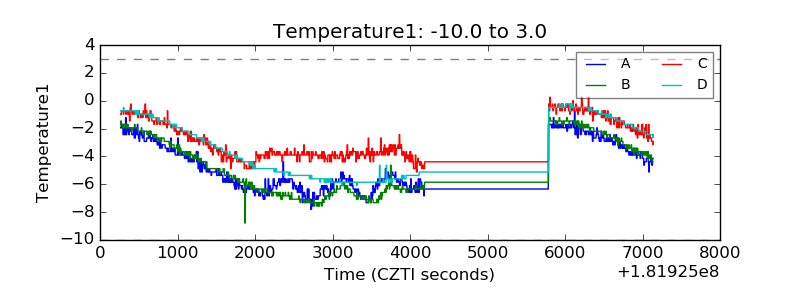 |
| Veto HV Monitor |  |
| Veto LLD | 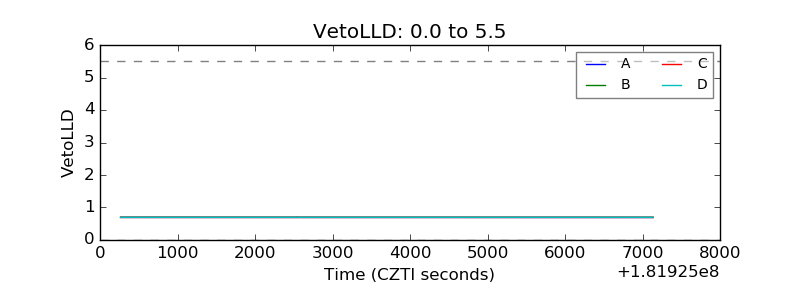 |
| Alpha Counter | 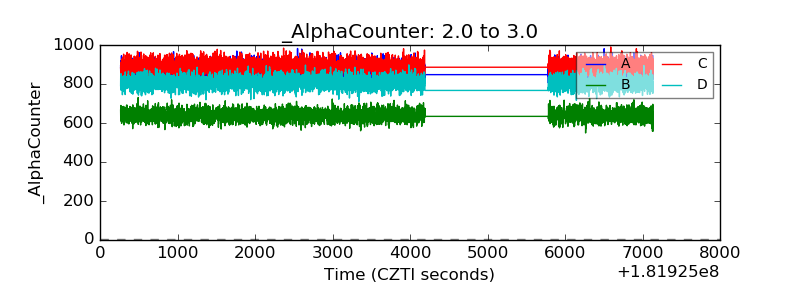 |
| _CPM_Rate | 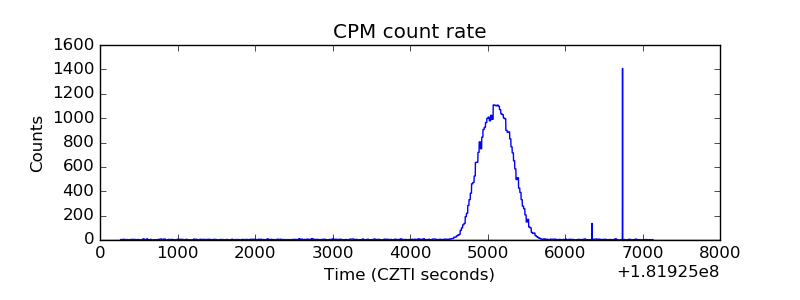 |
| CZT Counter | 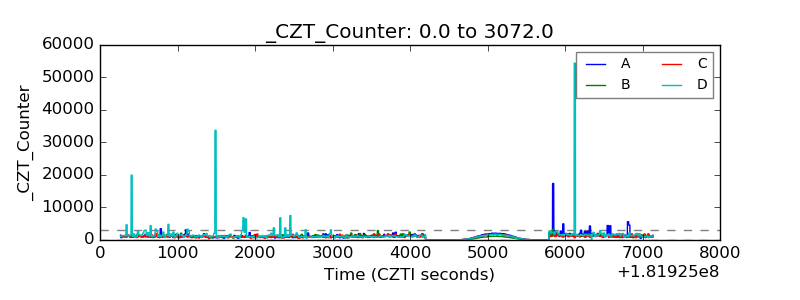 |
| +2.5 Volts monitor |  |
| +5 Volts monitor |  |
| _ROLL_ROT | 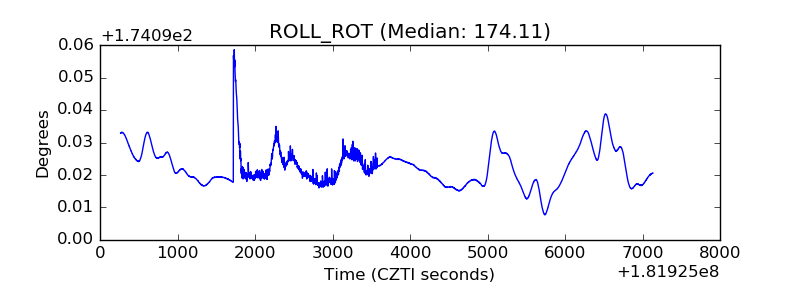 |
| _Roll_DEC | 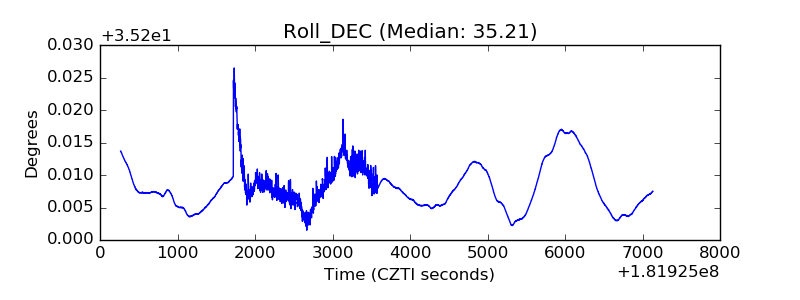 |
| _Roll_RA | 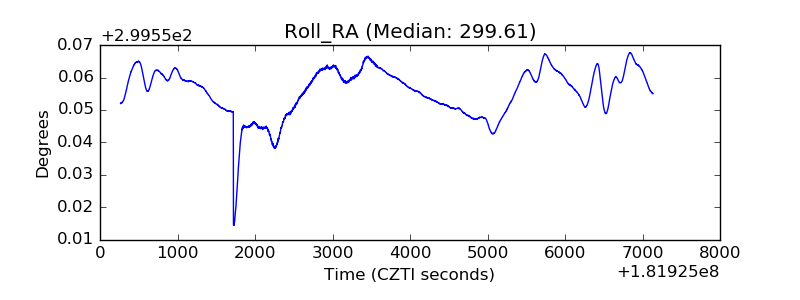 |
| Veto Counter | 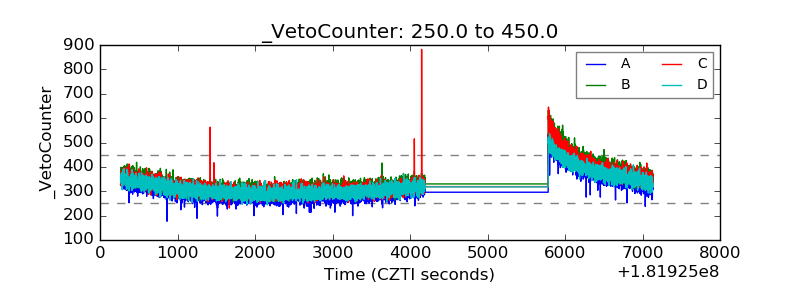 |