| Param | Original file | Final file |
|---|---|---|
| Filename | modeM0/AS1P01_140T01_9000000004_00143cztM0_level2.evt | modeM0/AS1P01_140T01_9000000004_00143cztM0_level2_quad_clean.evt |
| Size (bytes) | 411,914,880 | 30,934,080 |
| Size | 392.8 MB | 29.5 MB |
| Events in quadrant A | 3,012,912 | 193,803 |
| Events in quadrant B | 3,054,256 | 196,214 |
| Events in quadrant C | 2,828,334 | 192,198 |
| Events in quadrant D | 3,417,281 | 180,248 |
| Mode SS | |||
|---|---|---|---|
| Quadrant | BADHDUFLAG | Total packets | Discarded packets |
| A | 0 | 67 | 13 |
| B | 0 | 69 | 19 |
| C | 0 | 78 | 26 |
| D | 0 | 70 | 18 |
| Mode M9 | |||
|---|---|---|---|
| Quadrant | BADHDUFLAG | Total packets | Discarded packets |
| A | 0 | 19 | 4 |
| B | 0 | 18 | 3 |
| C | 0 | 16 | 1 |
| D | 0 | 20 | 5 |
| Mode M0 | |||
|---|---|---|---|
| Quadrant | BADHDUFLAG | Total packets | Discarded packets |
| A | 0 | 14135 | 3509 |
| B | 0 | 14060 | 3271 |
| C | 0 | 13134 | 3015 |
| D | 0 | 15432 | 3546 |
| Quadrant | Total seconds | Saturated seconds | Saturation percentage |
|---|---|---|---|
| A | 2412 | 3 | 0.124378% |
| B | 2411 | 31 | 1.285774% |
| C | 2406 | 3 | 0.124688% |
| D | 2402 | 98 | 4.079933% |
Noise dominated data is calculated using 1-second bins in cleaned event files. If a bin has >2000 counts, and if more than 50% of those come from <1% of pixels, then it is considered to be noise-dominated and hence unusable.
| Quadrant | # 1 sec bins | Bins with >0 counts | Bins with >2000 counts | High rate bins dominated by noise | Noise dominated (total time) | Noise dominated (detector-on time) | Marked lightcurve |
|---|---|---|---|---|---|---|---|
| A | 5388 | 2444 | 63 | 63 | 1.17% | 2.58% | 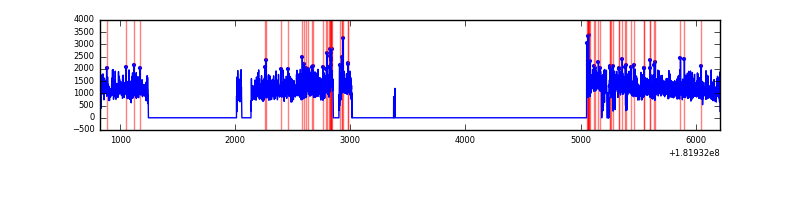 |
| B | 5385 | 2445 | 110 | 110 | 2.04% | 4.50% | 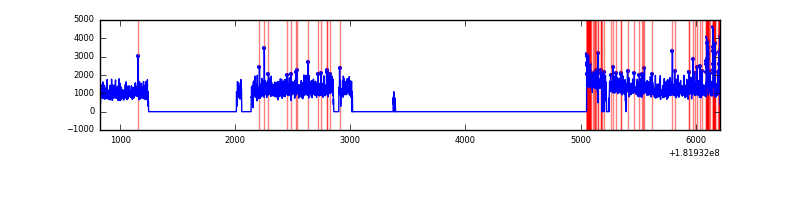 |
| C | 5387 | 2438 | 39 | 39 | 0.72% | 1.60% | 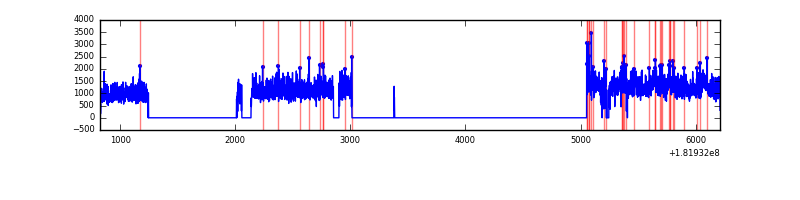 |
| D | 5387 | 2439 | 327 | 327 | 6.07% | 13.41% | 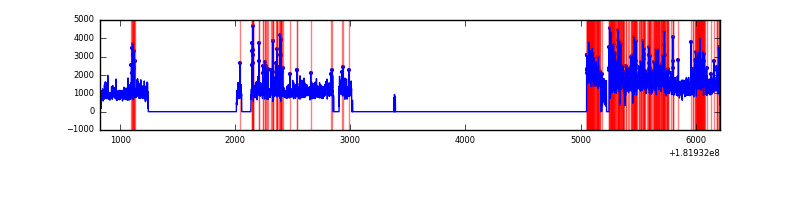 |
Top three noisy pixels from each quadrant. If the there are fewer than three noisy pixels in the level2.evt file, extra rows are filled as -1
| Pixel properties | Quadrant properties | ||||||
|---|---|---|---|---|---|---|---|
| Quadrant | DetID | PixID | Counts | Sigma | Mean | Median | Sigma |
| A | 15 | 22 | 89709 | 720.7 | 737 | 718 | 123.5 |
| A | 13 | 145 | 29575 | 233.7 | 737 | 718 | 123.5 |
| A | 13 | 224 | 9243 | 69.04 | 737 | 718 | 123.5 |
| B | 10 | 48 | 102474 | 622.09 | 738 | 734 | 163.5 |
| B | 8 | 236 | 45667 | 274.74 | 738 | 734 | 163.5 |
| B | 2 | 2 | 38908 | 233.41 | 738 | 734 | 163.5 |
| C | 3 | 32 | 83202 | 435.51 | 682 | 708 | 189.4 |
| C | 10 | 69 | 48009 | 249.71 | 682 | 708 | 189.4 |
| C | 10 | 56 | 3933 | 17.03 | 682 | 708 | 189.4 |
| D | 10 | 182 | 73981 | 432.04 | 718 | 707 | 169.6 |
| D | 14 | 53 | 49400 | 287.11 | 718 | 707 | 169.6 |
| D | 12 | 141 | 37751 | 218.42 | 718 | 707 | 169.6 |
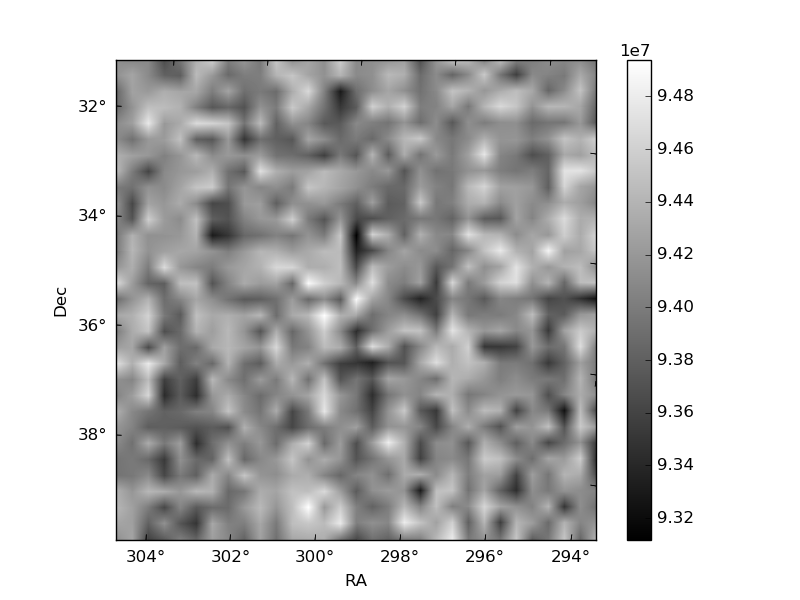
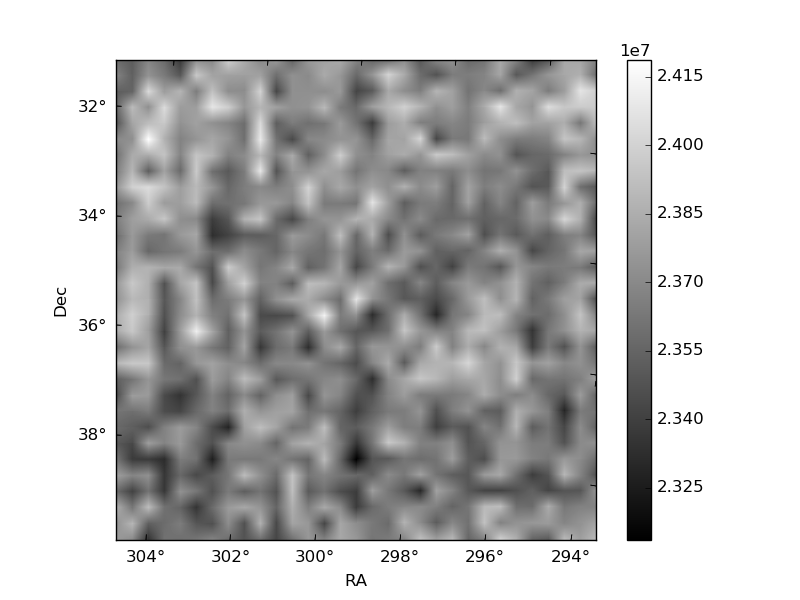
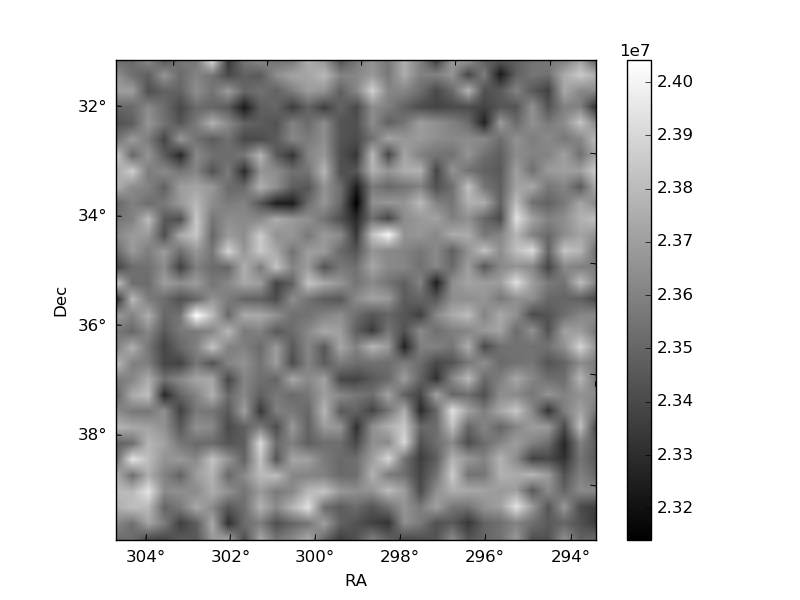
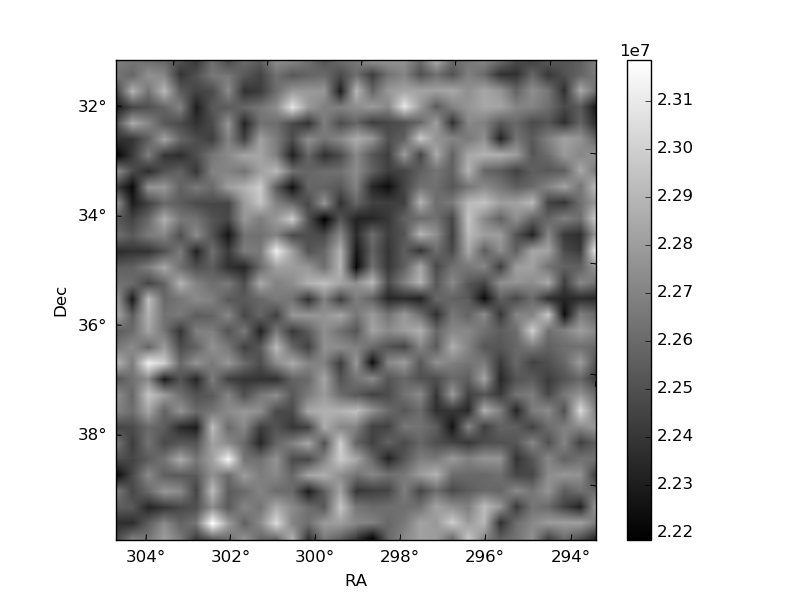
Histogram calculated using DETX and DETY for each event in the final _common_clean file
| Quadrant A | 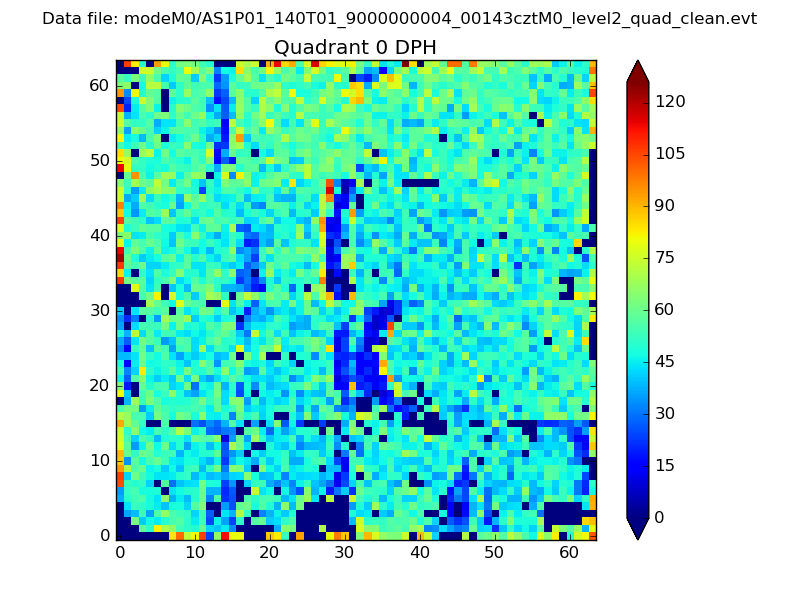 |
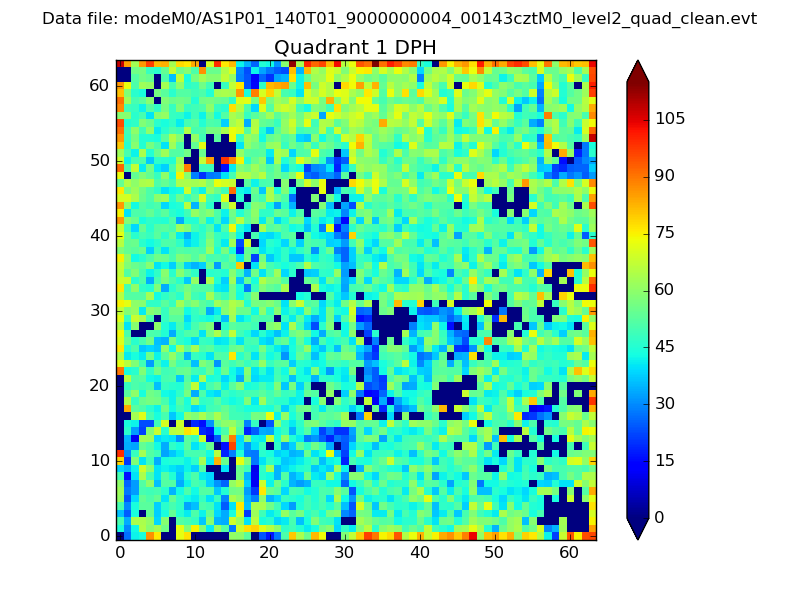 |
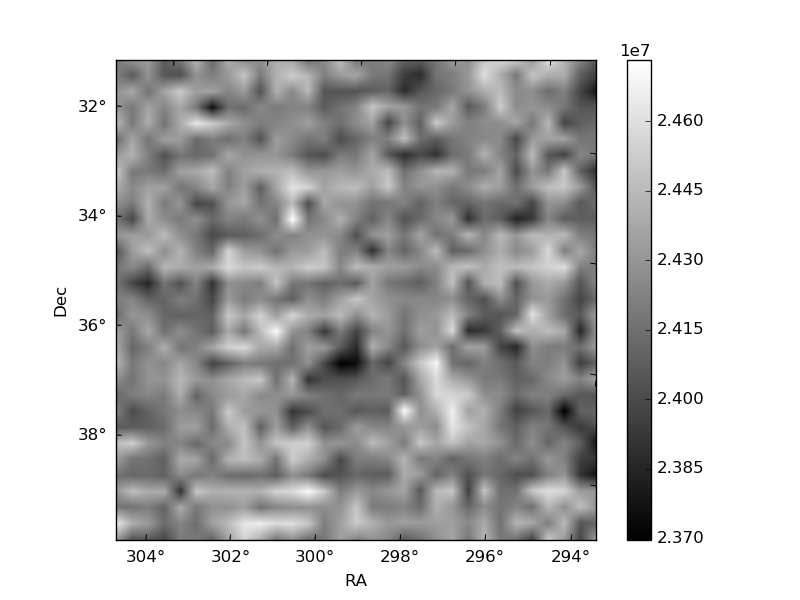
Quadrant B |
|---|---|---|---|
| Quadrant D | 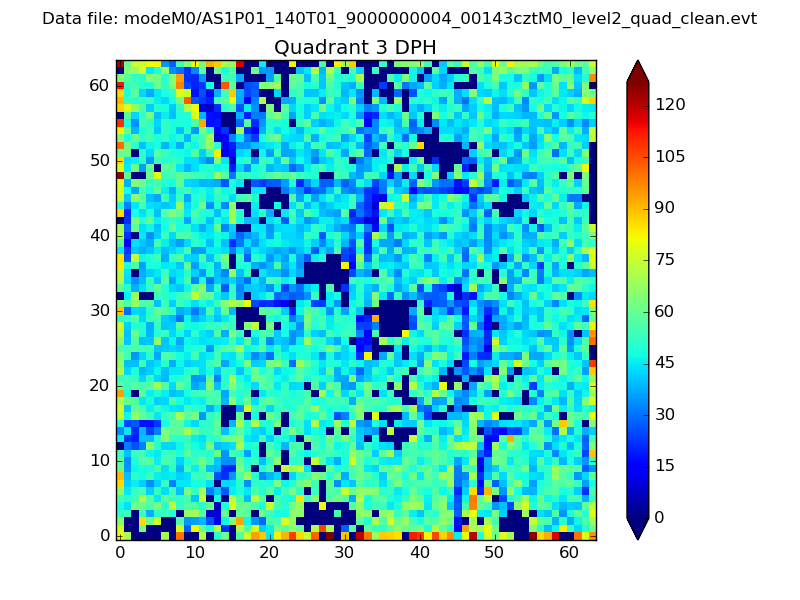 |
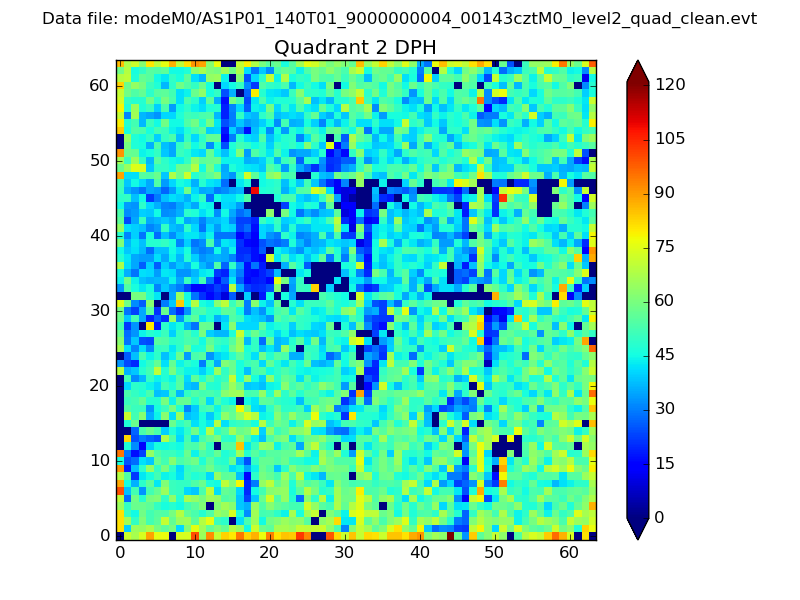 |
Quadrant C |
| Plot type | Count rate plots | Images |
|---|---|---|
| Comparison with Poisson distribution Blue bars denote a histogram of data divided into 1 sec bins. Red curve is a Poisson curve with rate = median count rate of data. |
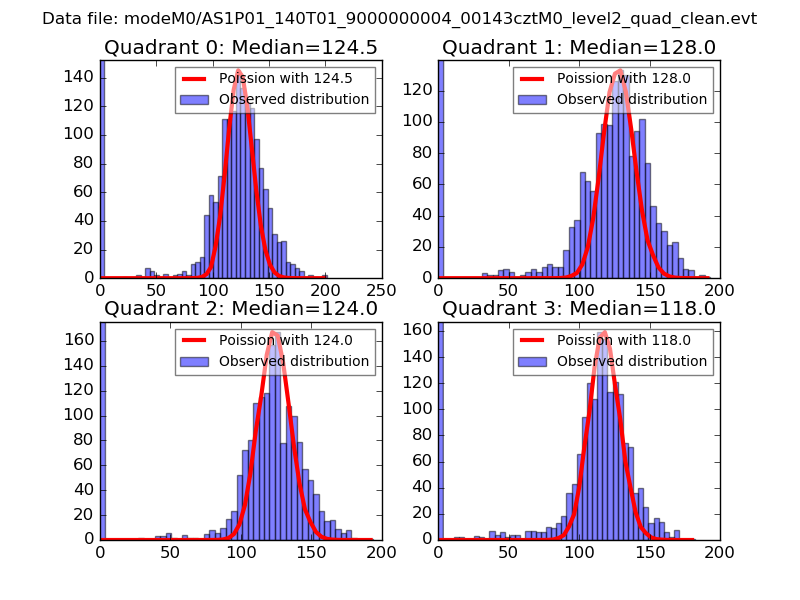 |
 |
| Quadrant-wise count rates Data is divided into 100 sec bins |
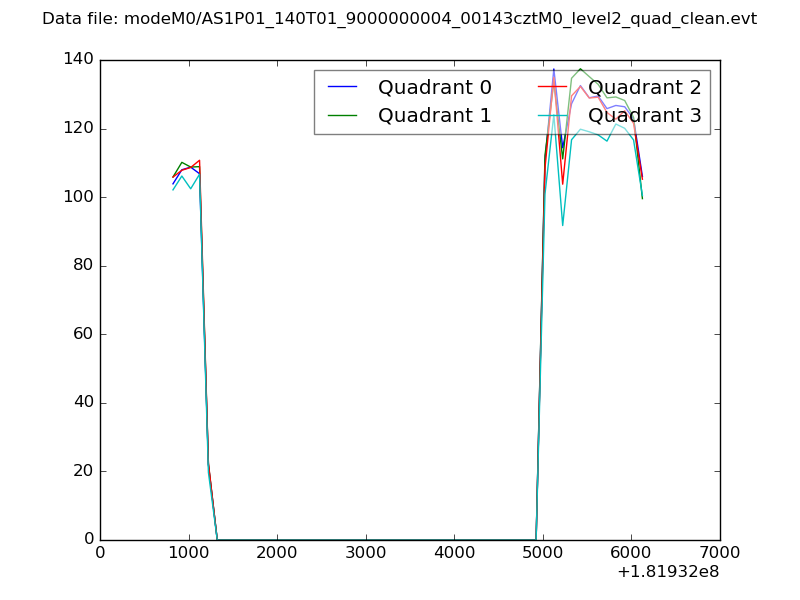 |
|
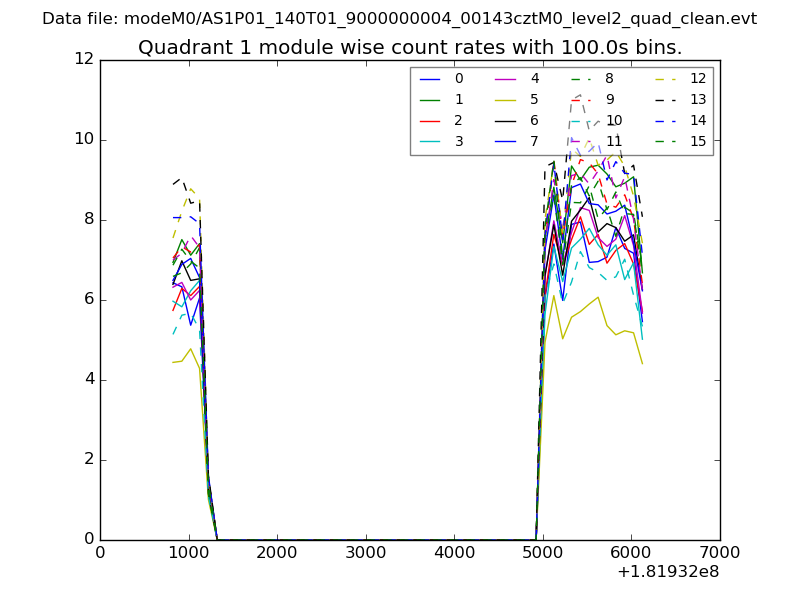
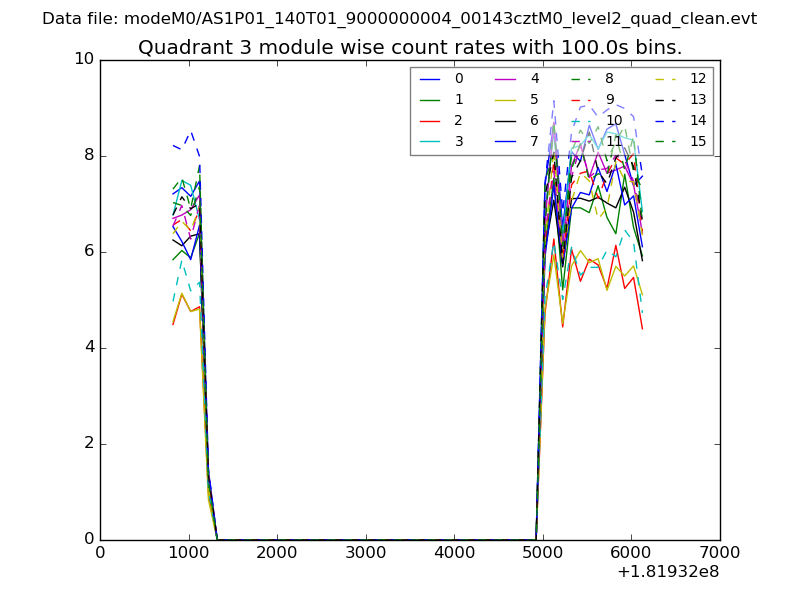
| Module-wise count rates for Quadrant A Data is divided into 100 sec bins |
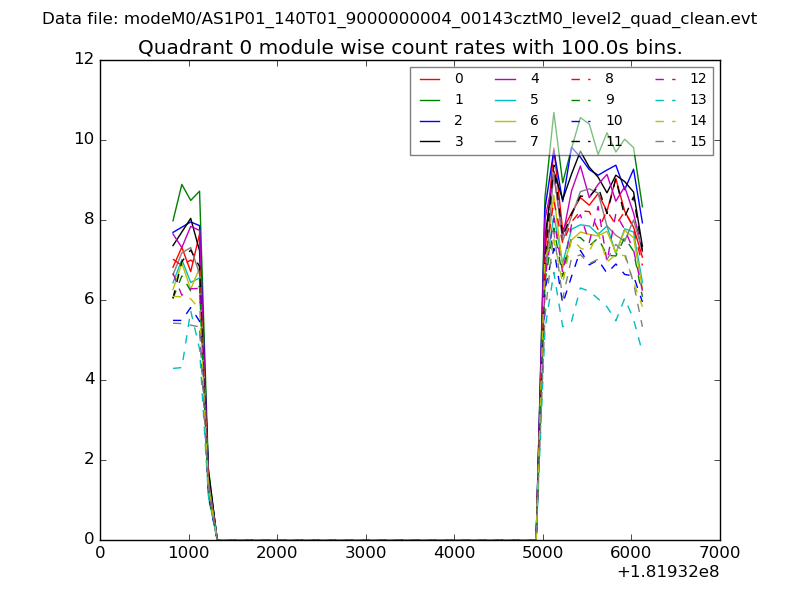 |
 |
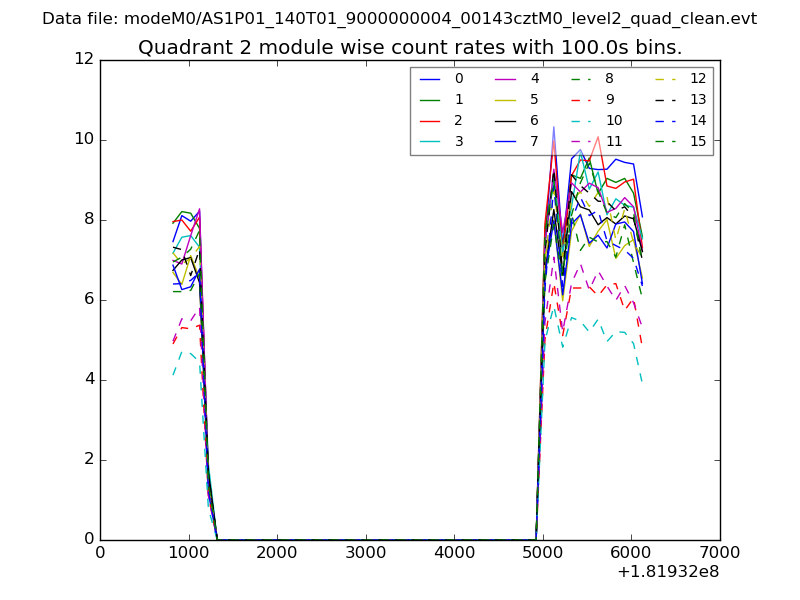
| Module-wise count rates for Quadrant B Data is divided into 100 sec bins |
 |
 |
| Module-wise count rates for Quadrant C Data is divided into 100 sec bins |
 |
 |
| Module-wise count rates for Quadrant D Data is divided into 100 sec bins |
 |
 |
| Parameter | Plot |
|---|---|
| CZT HV Monitor | 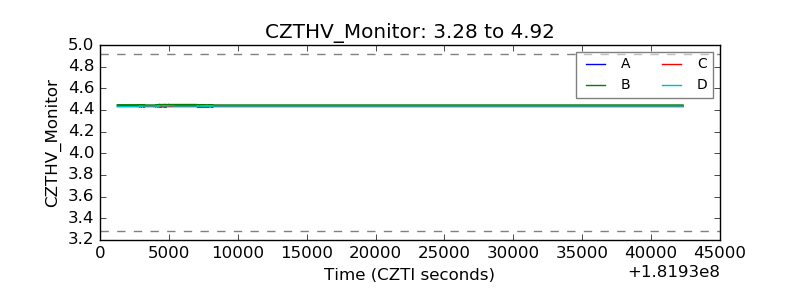 |
| D_VDD | 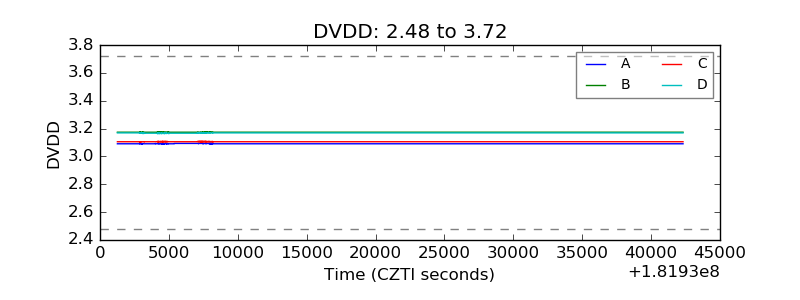 |
| Temperature 1 | 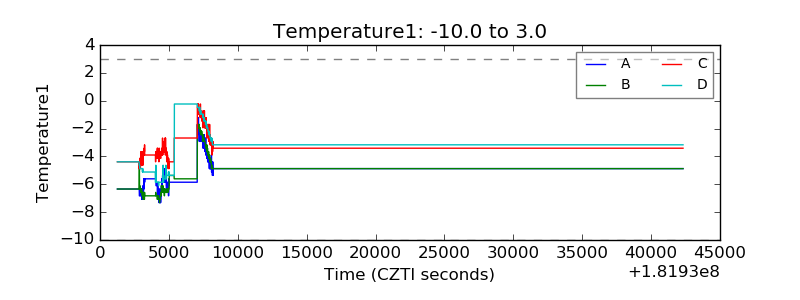 |
| Veto HV Monitor | 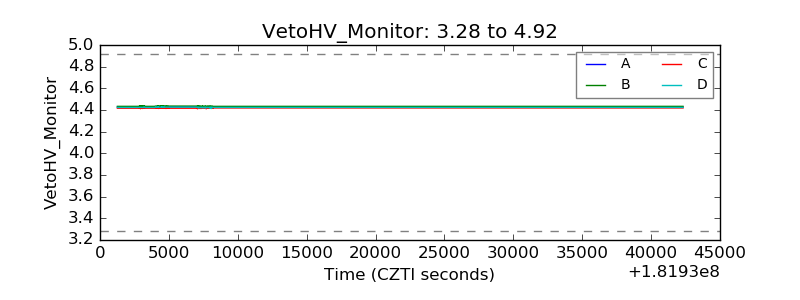 |
| Veto LLD | 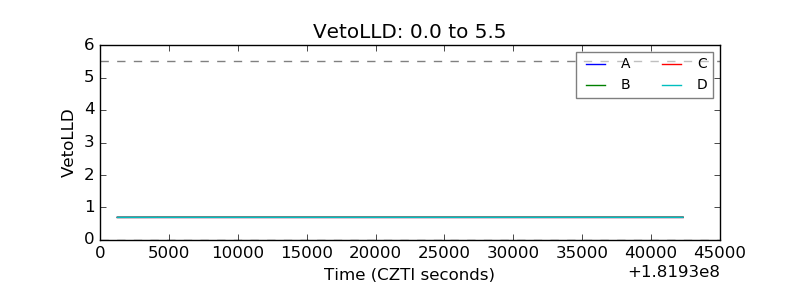 |
| Alpha Counter | 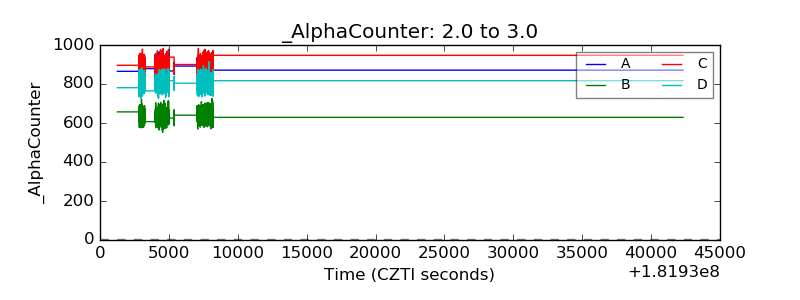 |
| _CPM_Rate |  |
| CZT Counter | 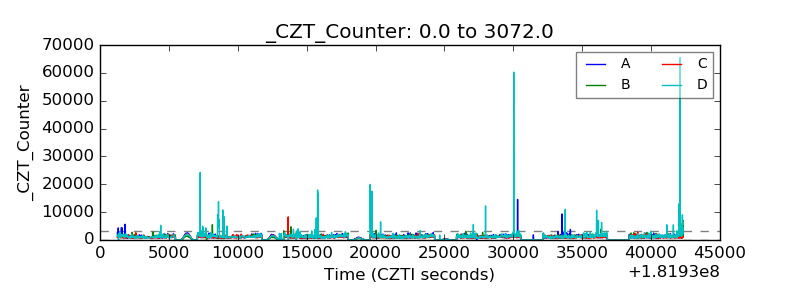 |
| +2.5 Volts monitor |  |
| +5 Volts monitor |  |
| _ROLL_ROT | 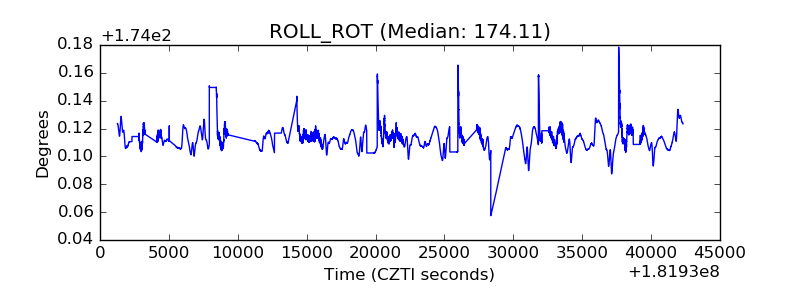 |
| _Roll_DEC |  |
| _Roll_RA | 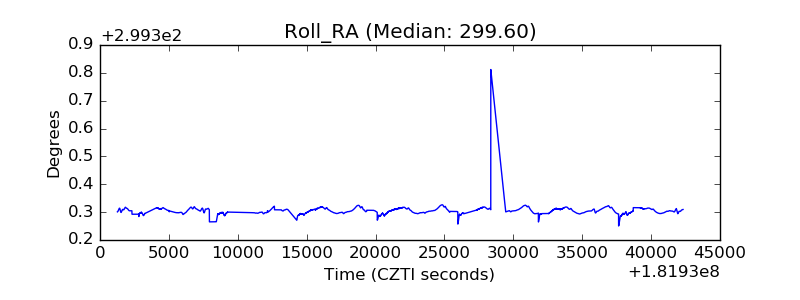 |
| Veto Counter | 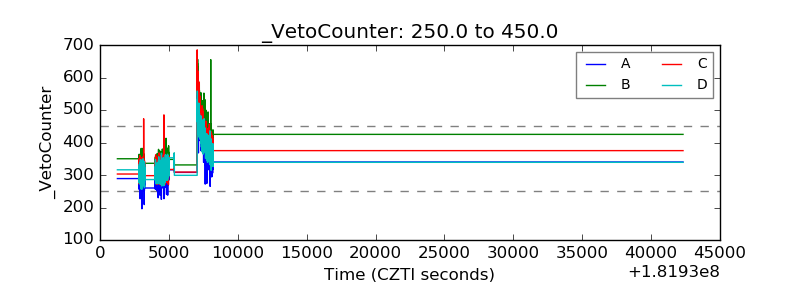 |