| Param | Original file | Final file |
|---|---|---|
| Filename | modeM0/AS1P01_140T01_9000000004_00147cztM0_level2.evt | modeM0/AS1P01_140T01_9000000004_00147cztM0_level2_quad_clean.evt |
| Size (bytes) | 578,430,720 | 38,390,400 |
| Size | 551.6 MB | 36.6 MB |
| Events in quadrant A | 4,284,837 | 229,316 |
| Events in quadrant B | 4,384,050 | 233,994 |
| Events in quadrant C | 3,899,599 | 228,129 |
| Events in quadrant D | 4,709,801 | 216,691 |
| Mode SS | |||
|---|---|---|---|
| Quadrant | BADHDUFLAG | Total packets | Discarded packets |
| A | 0 | 80 | 6 |
| B | 0 | 81 | 9 |
| C | 0 | 81 | 7 |
| D | 0 | 80 | 6 |
| Mode M9 | |||
|---|---|---|---|
| Quadrant | BADHDUFLAG | Total packets | Discarded packets |
| A | 0 | 16 | 0 |
| B | 0 | 16 | 0 |
| C | 0 | 16 | 0 |
| D | 0 | 16 | 0 |
| Mode M0 | |||
|---|---|---|---|
| Quadrant | BADHDUFLAG | Total packets | Discarded packets |
| A | 0 | 16622 | 1330 |
| B | 0 | 17090 | 1558 |
| C | 0 | 15434 | 1299 |
| D | 0 | 17989 | 1421 |
| Quadrant | Total seconds | Saturated seconds | Saturation percentage |
|---|---|---|---|
| A | 3593 | 14 | 0.389647% |
| B | 3580 | 5 | 0.139665% |
| C | 3586 | 2 | 0.055772% |
| D | 3592 | 110 | 3.062361% |
Noise dominated data is calculated using 1-second bins in cleaned event files. If a bin has >2000 counts, and if more than 50% of those come from <1% of pixels, then it is considered to be noise-dominated and hence unusable.
| Quadrant | # 1 sec bins | Bins with >0 counts | Bins with >2000 counts | High rate bins dominated by noise | Noise dominated (total time) | Noise dominated (detector-on time) | Marked lightcurve |
|---|---|---|---|---|---|---|---|
| A | 7372 | 3626 | 98 | 98 | 1.33% | 2.70% | 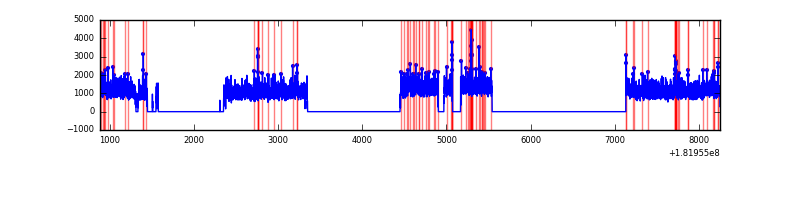 |
| B | 7372 | 3607 | 97 | 97 | 1.32% | 2.69% | 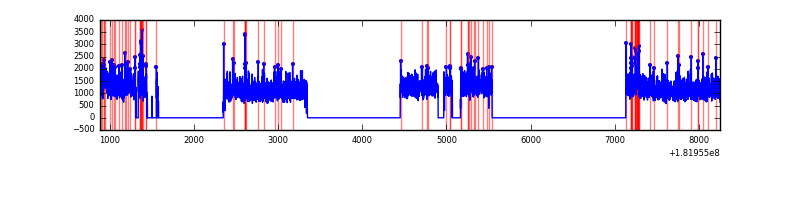 |
| C | 7372 | 3617 | 27 | 27 | 0.37% | 0.75% | 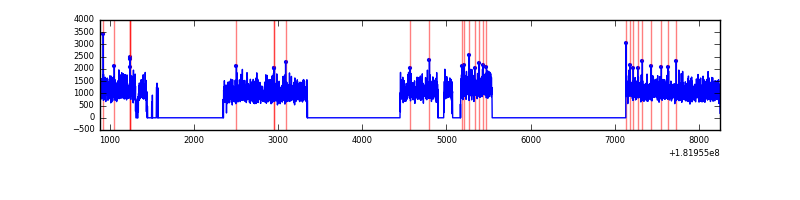 |
| D | 7372 | 3619 | 287 | 287 | 3.89% | 7.93% | 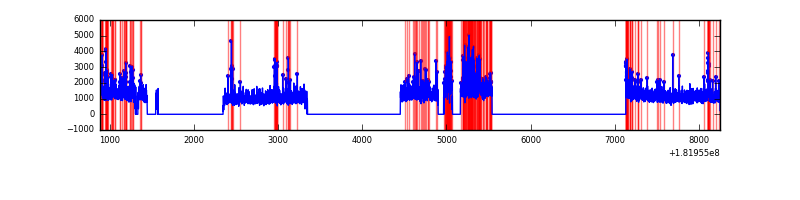 |
Top three noisy pixels from each quadrant. If the there are fewer than three noisy pixels in the level2.evt file, extra rows are filled as -1
| Pixel properties | Quadrant properties | ||||||
|---|---|---|---|---|---|---|---|
| Quadrant | DetID | PixID | Counts | Sigma | Mean | Median | Sigma |
| A | 15 | 233 | 43170 | 241.27 | 1067 | 1043 | 174.6 |
| A | 0 | 86 | 27789 | 153.18 | 1067 | 1043 | 174.6 |
| A | 13 | 146 | 20383 | 110.76 | 1067 | 1043 | 174.6 |
| B | 10 | 199 | 98179 | 403.51 | 1071 | 1074 | 240.6 |
| B | 8 | 236 | 44618 | 180.94 | 1071 | 1074 | 240.6 |
| B | 5 | 216 | 43525 | 176.4 | 1071 | 1074 | 240.6 |
| C | 8 | 229 | 22541 | 78.18 | 979 | 1015 | 275.3 |
| C | 10 | 17 | 11895 | 39.52 | 979 | 1015 | 275.3 |
| C | 10 | 21 | 4070 | 11.1 | 979 | 1015 | 275.3 |
| D | 13 | 222 | 131230 | 527.56 | 1032 | 1015 | 246.8 |
| D | 7 | 53 | 73768 | 294.75 | 1032 | 1015 | 246.8 |
| D | 12 | 141 | 47592 | 188.7 | 1032 | 1015 | 246.8 |
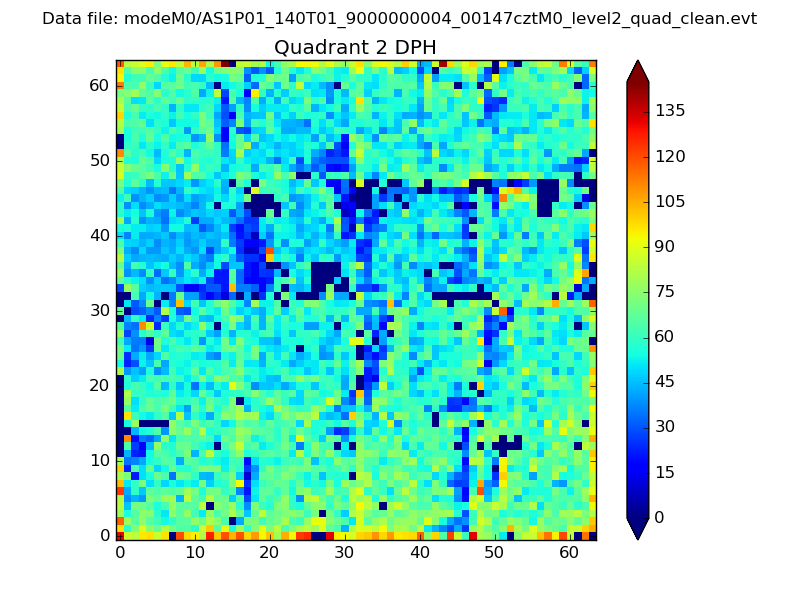
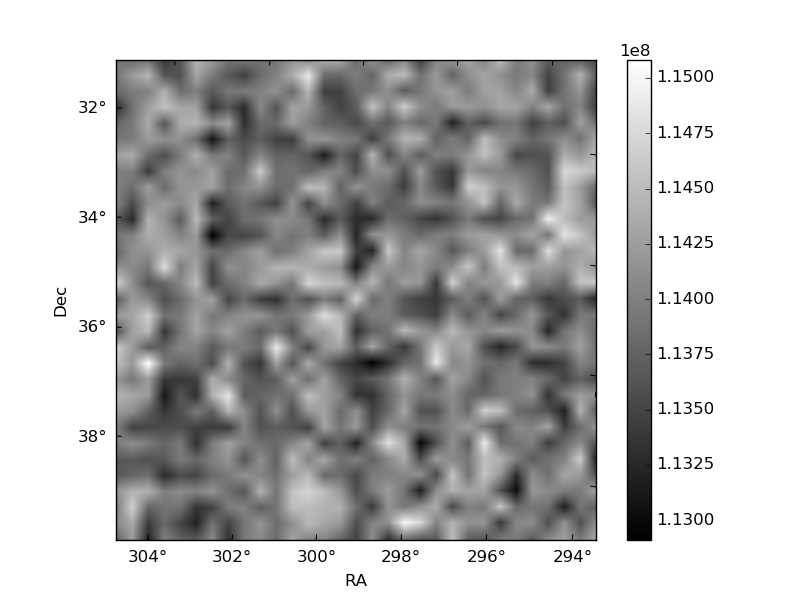
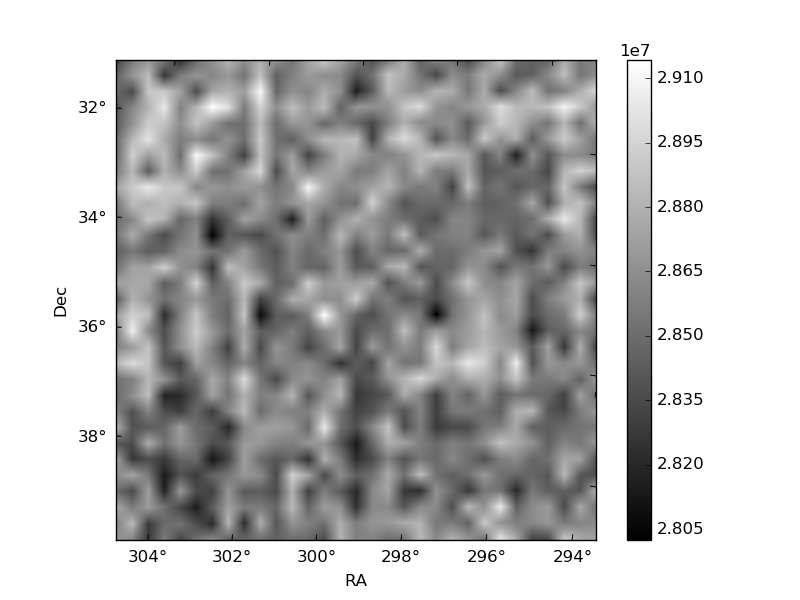
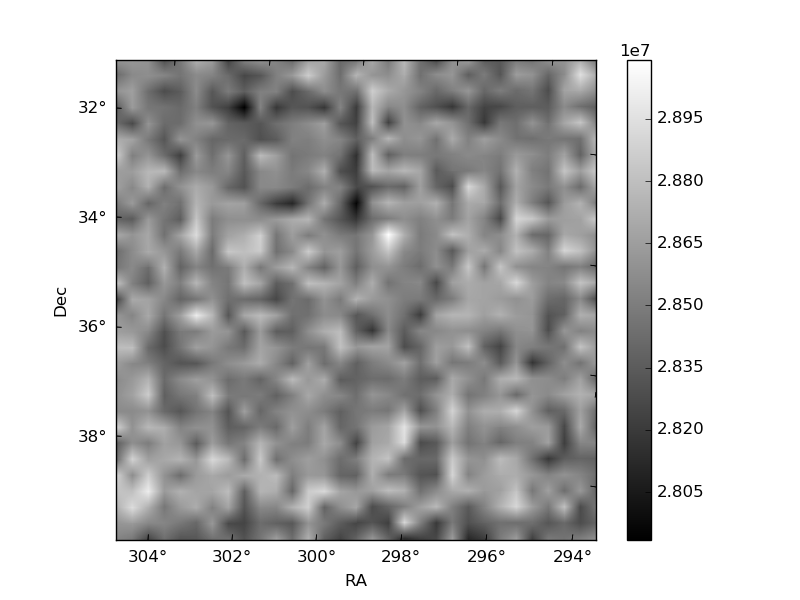
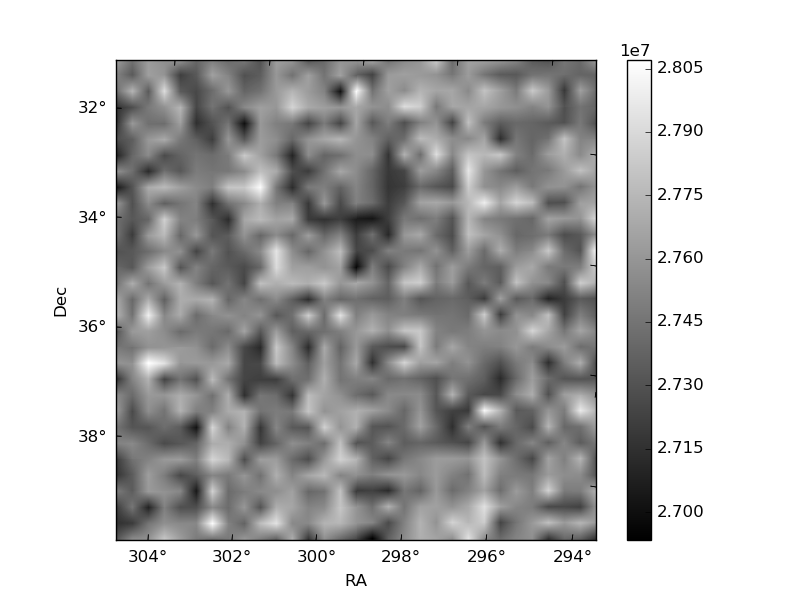
Histogram calculated using DETX and DETY for each event in the final _common_clean file
| Quadrant A | 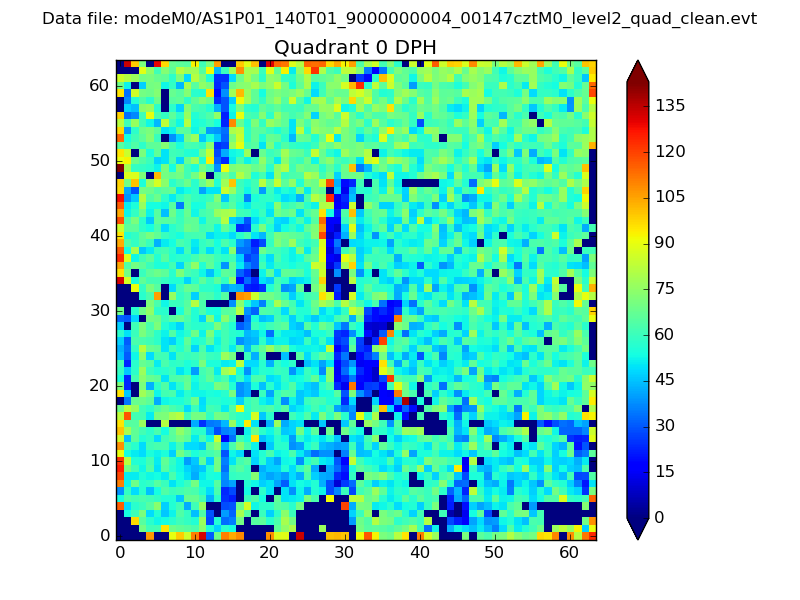 |
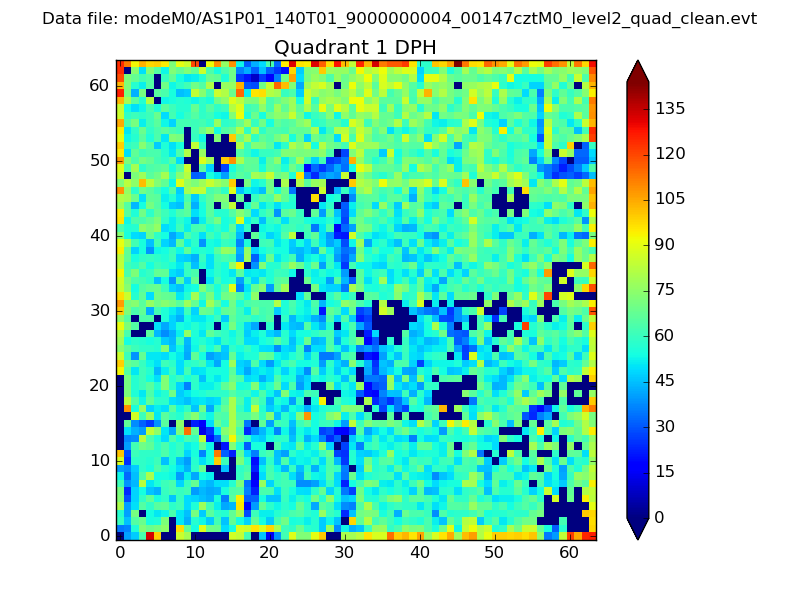 |
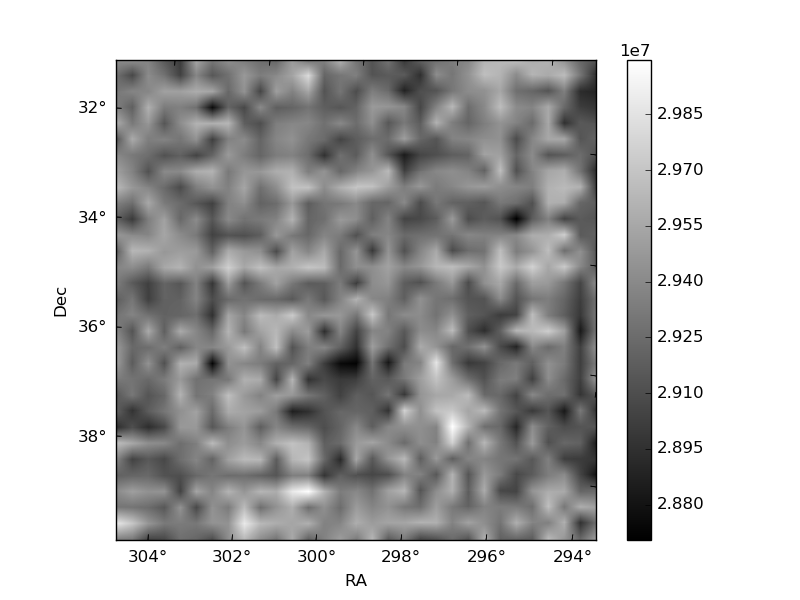
Quadrant B |
|---|---|---|---|
| Quadrant D | 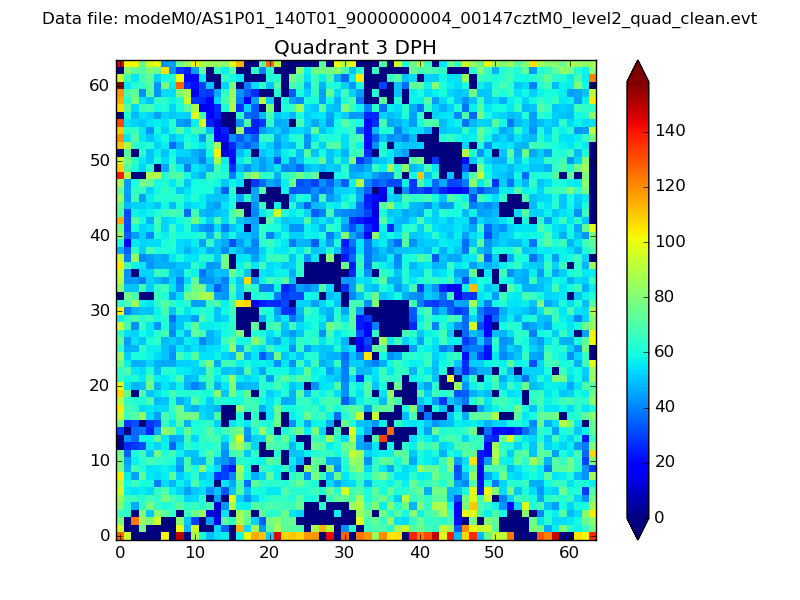 |
 |
Quadrant C |
| Plot type | Count rate plots | Images |
|---|---|---|
| Comparison with Poisson distribution Blue bars denote a histogram of data divided into 1 sec bins. Red curve is a Poisson curve with rate = median count rate of data. |
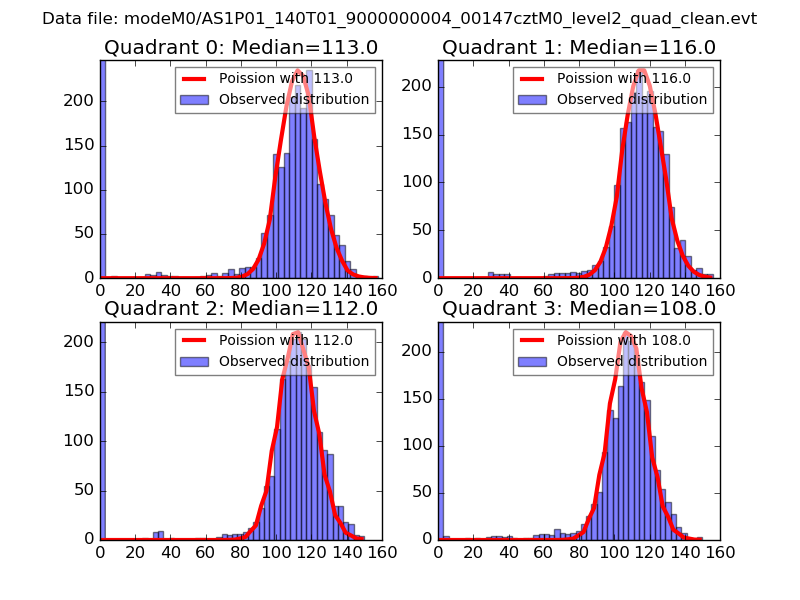 |
 |
| Quadrant-wise count rates Data is divided into 100 sec bins |
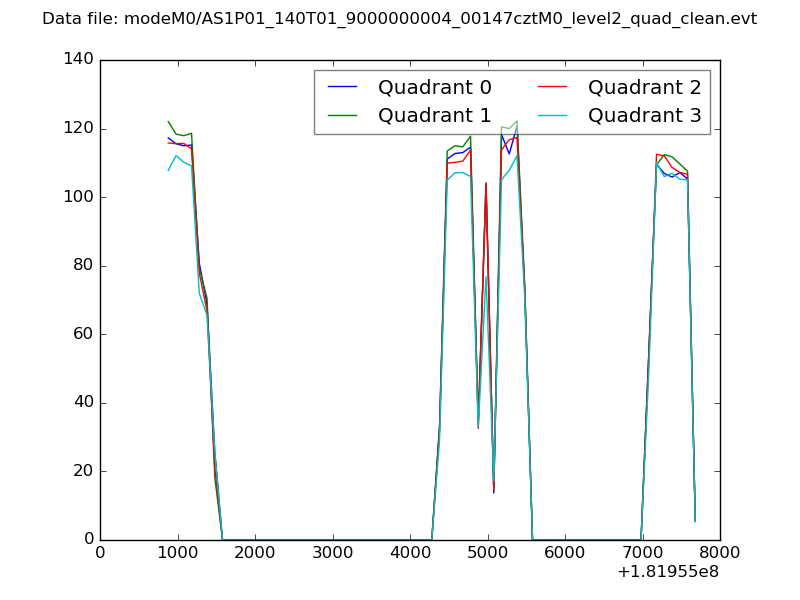 |
|
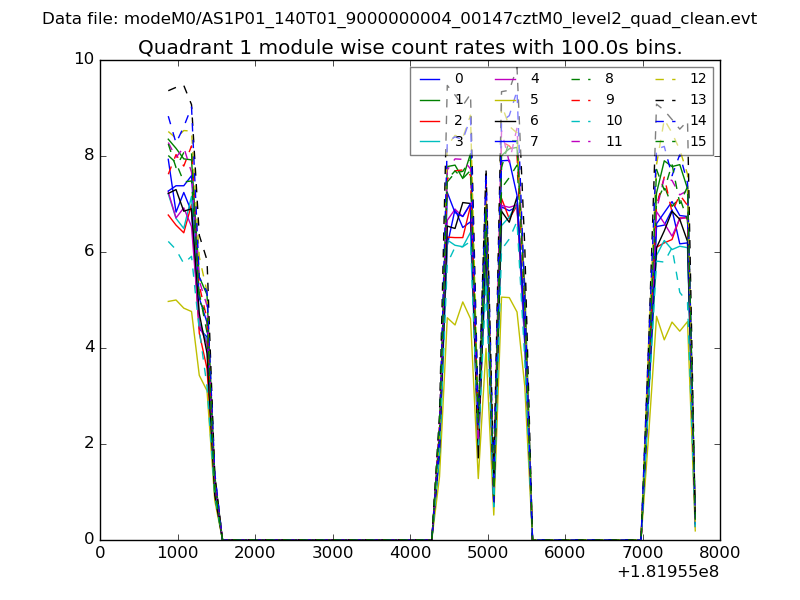
| Module-wise count rates for Quadrant A Data is divided into 100 sec bins |
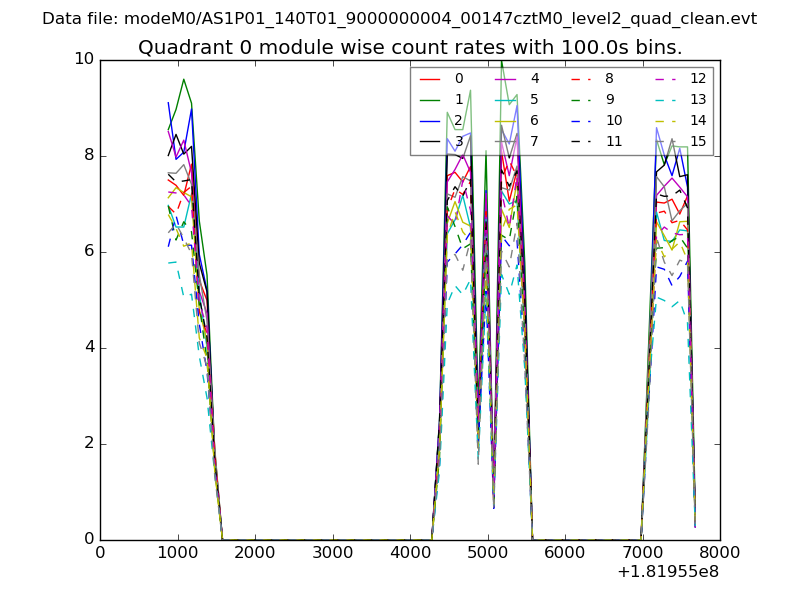 |
 |
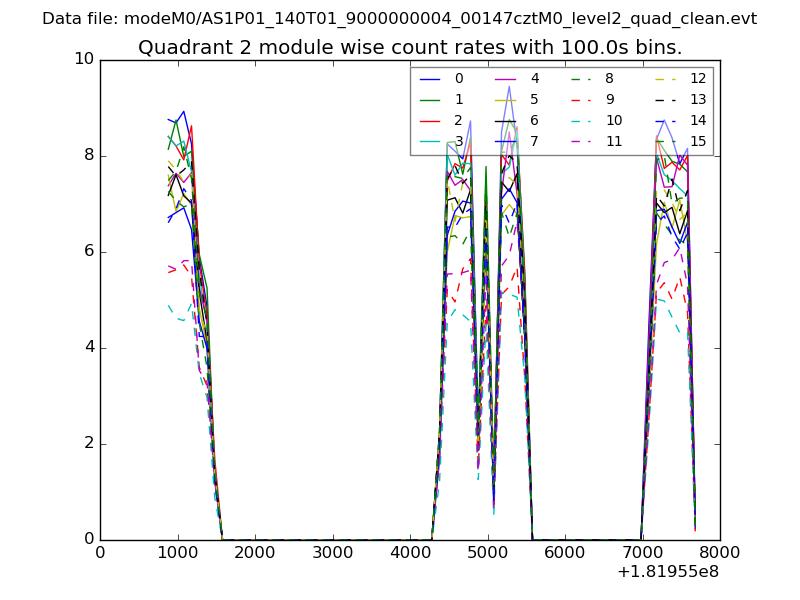
| Module-wise count rates for Quadrant B Data is divided into 100 sec bins |
 |
 |
| Module-wise count rates for Quadrant C Data is divided into 100 sec bins |
 |
 |
| Module-wise count rates for Quadrant D Data is divided into 100 sec bins |
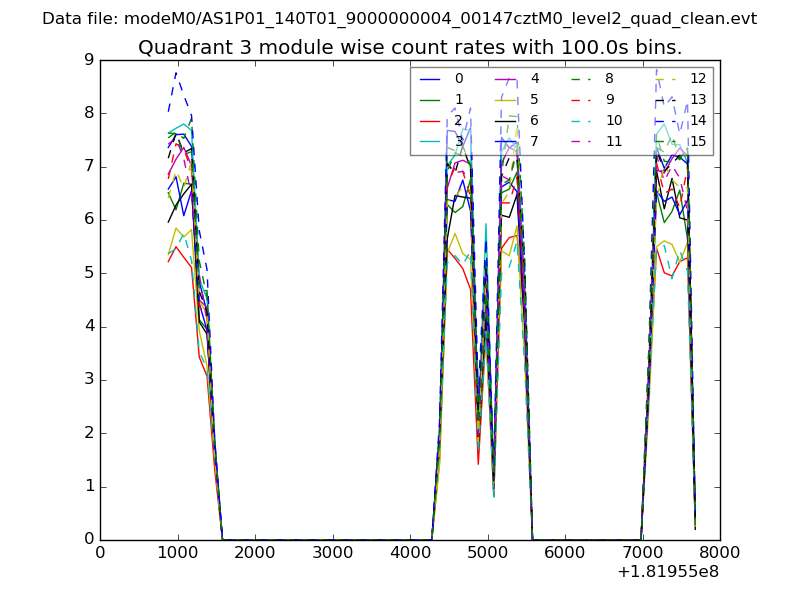 |
 |
| Parameter | Plot |
|---|---|
| CZT HV Monitor | 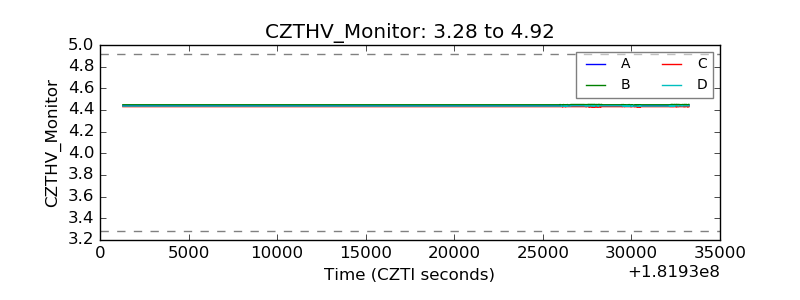 |
| D_VDD | 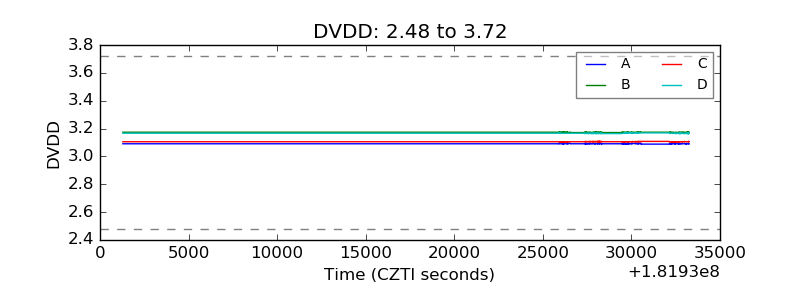 |
| Temperature 1 | 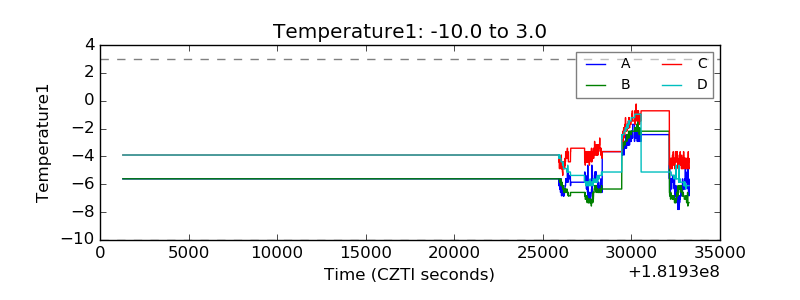 |
| Veto HV Monitor | 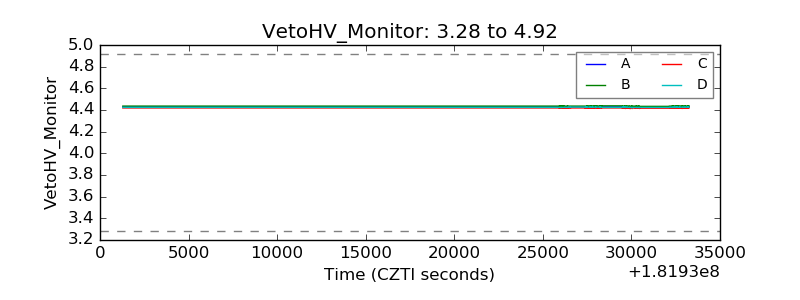 |
| Veto LLD | 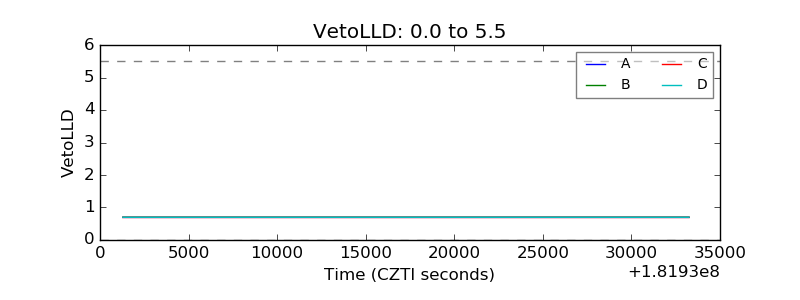 |
| Alpha Counter | 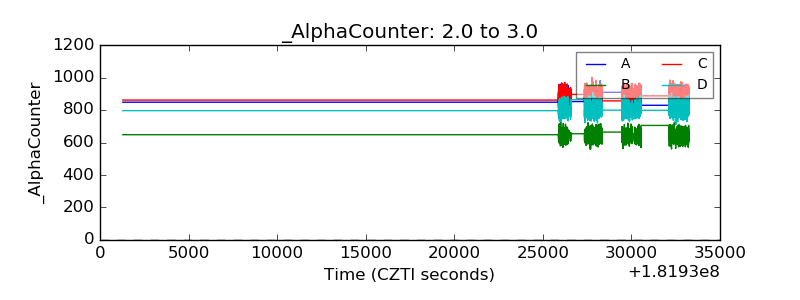 |
| _CPM_Rate | 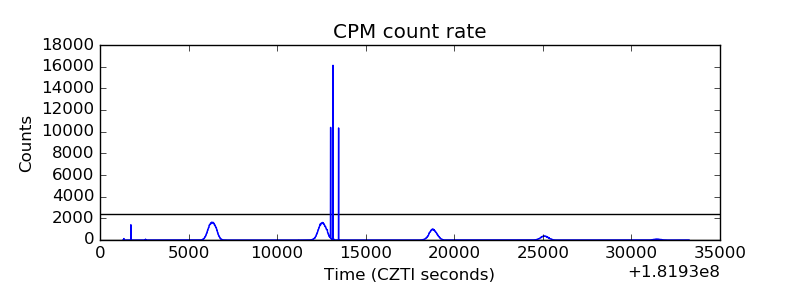 |
| CZT Counter | 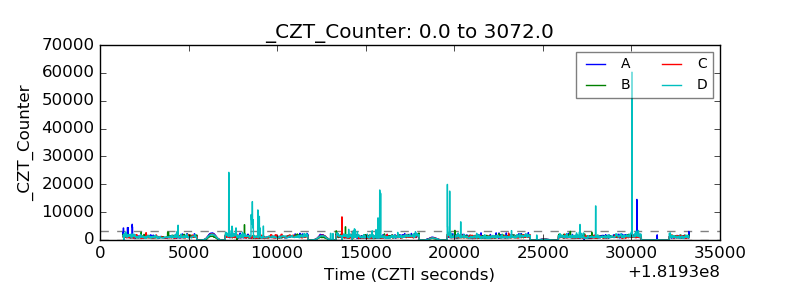 |
| +2.5 Volts monitor | 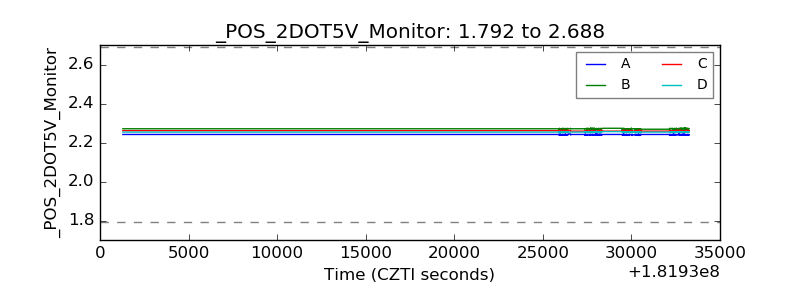 |
| +5 Volts monitor | 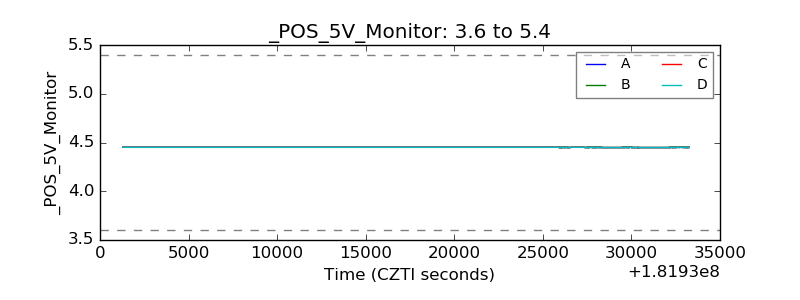 |
| _ROLL_ROT | 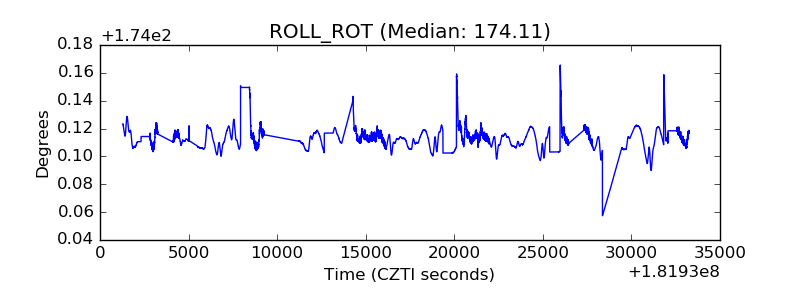 |
| _Roll_DEC | 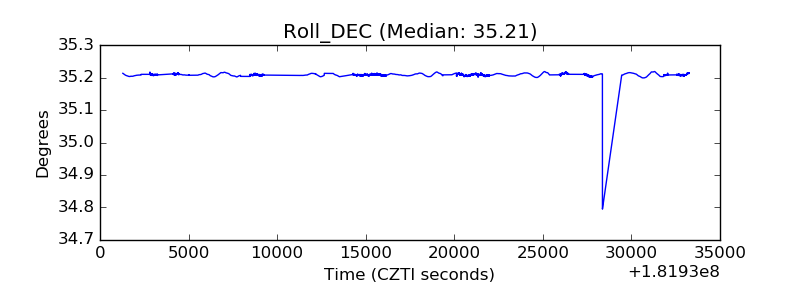 |
| _Roll_RA | 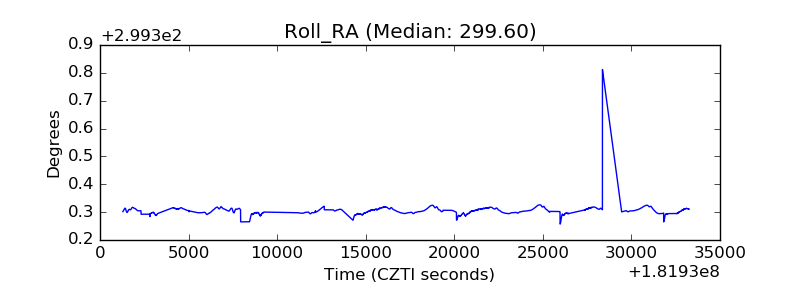 |
| Veto Counter |  |