| Param | Original file | Final file |
|---|---|---|
| Filename | modeM0/AS1P01_140T01_9000000004_00148cztM0_level2.evt | modeM0/AS1P01_140T01_9000000004_00148cztM0_level2_quad_clean.evt |
| Size (bytes) | 944,455,680 | 45,941,760 |
| Size | 900.7 MB | 43.8 MB |
| Events in quadrant A | 7,272,157 | 250,025 |
| Events in quadrant B | 7,134,192 | 254,486 |
| Events in quadrant C | 6,240,620 | 248,923 |
| Events in quadrant D | 7,576,229 | 236,828 |
| Mode SS | |||
|---|---|---|---|
| Quadrant | BADHDUFLAG | Total packets | Discarded packets |
| A | 0 | 116 | 0 |
| B | 0 | 116 | 0 |
| C | 0 | 116 | 0 |
| D | 0 | 116 | 0 |
| Mode M9 | |||
|---|---|---|---|
| Quadrant | BADHDUFLAG | Total packets | Discarded packets |
| A | 0 | 16 | 0 |
| B | 0 | 16 | 0 |
| C | 0 | 16 | 0 |
| D | 0 | 16 | 0 |
| Mode M0 | |||
|---|---|---|---|
| Quadrant | BADHDUFLAG | Total packets | Discarded packets |
| A | 0 | 25687 | 2 |
| B | 0 | 25310 | 1 |
| C | 0 | 22609 | 1 |
| D | 0 | 26556 | 1 |
| Quadrant | Total seconds | Saturated seconds | Saturation percentage |
|---|---|---|---|
| A | 5727 | 30 | 0.523834% |
| B | 5727 | 23 | 0.401606% |
| C | 5727 | 1 | 0.017461% |
| D | 5727 | 130 | 2.269949% |
Noise dominated data is calculated using 1-second bins in cleaned event files. If a bin has >2000 counts, and if more than 50% of those come from <1% of pixels, then it is considered to be noise-dominated and hence unusable.
| Quadrant | # 1 sec bins | Bins with >0 counts | Bins with >2000 counts | High rate bins dominated by noise | Noise dominated (total time) | Noise dominated (detector-on time) | Marked lightcurve |
|---|---|---|---|---|---|---|---|
| A | 7319 | 5729 | 257 | 257 | 3.51% | 4.49% | 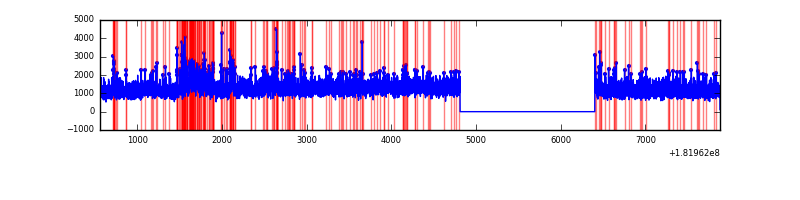 |
| B | 7319 | 5729 | 197 | 197 | 2.69% | 3.44% | 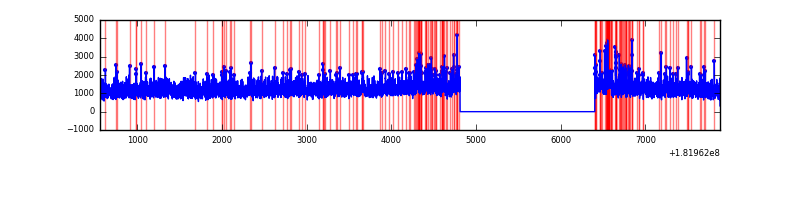 |
| C | 7319 | 5729 | 39 | 39 | 0.53% | 0.68% | 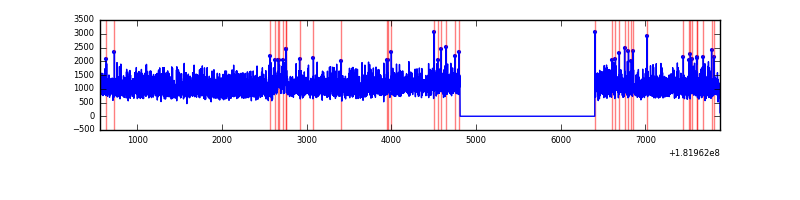 |
| D | 7319 | 5729 | 468 | 468 | 6.39% | 8.17% | 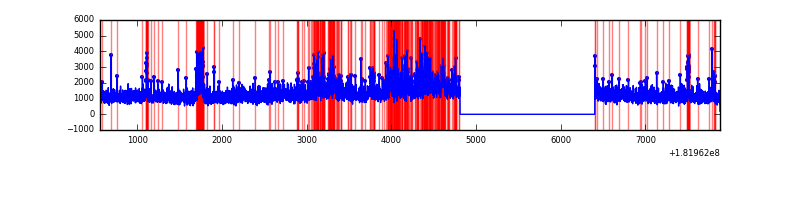 |
Top three noisy pixels from each quadrant. If the there are fewer than three noisy pixels in the level2.evt file, extra rows are filled as -1
| Pixel properties | Quadrant properties | ||||||
|---|---|---|---|---|---|---|---|
| Quadrant | DetID | PixID | Counts | Sigma | Mean | Median | Sigma |
| A | 0 | 86 | 228821 | 798.23 | 1751 | 1708 | 284.5 |
| A | 13 | 17 | 139565 | 484.52 | 1751 | 1708 | 284.5 |
| A | 13 | 146 | 46770 | 158.38 | 1751 | 1708 | 284.5 |
| B | 10 | 199 | 208385 | 528.2 | 1733 | 1736 | 391.2 |
| B | 8 | 236 | 139298 | 351.61 | 1733 | 1736 | 391.2 |
| B | 5 | 216 | 41387 | 101.35 | 1733 | 1736 | 391.2 |
| C | 14 | 252 | 44182 | 97.31 | 1559 | 1617 | 437.4 |
| C | 10 | 17 | 39869 | 87.45 | 1559 | 1617 | 437.4 |
| C | 0 | 188 | 13895 | 28.07 | 1559 | 1617 | 437.4 |
| D | 7 | 53 | 283217 | 743.62 | 1655 | 1635 | 378.7 |
| D | 14 | 53 | 138972 | 362.69 | 1655 | 1635 | 378.7 |
| D | 0 | 243 | 132562 | 345.76 | 1655 | 1635 | 378.7 |
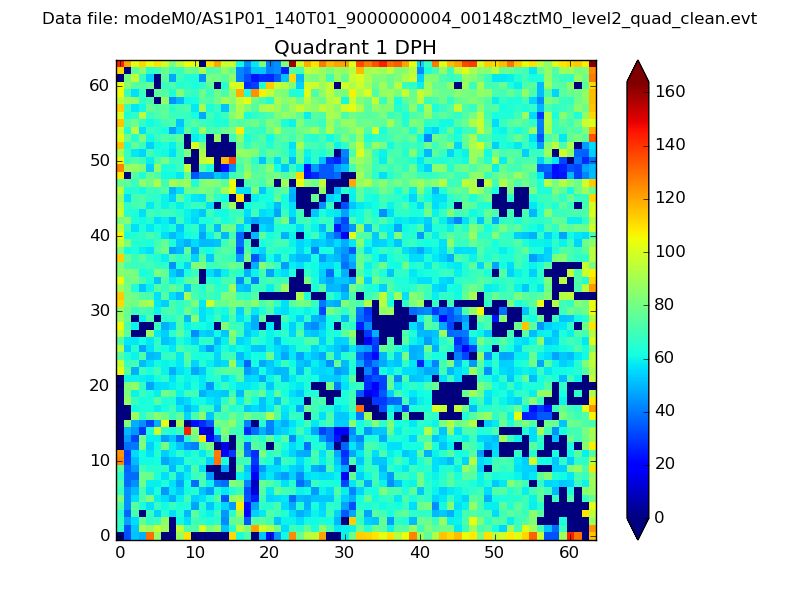
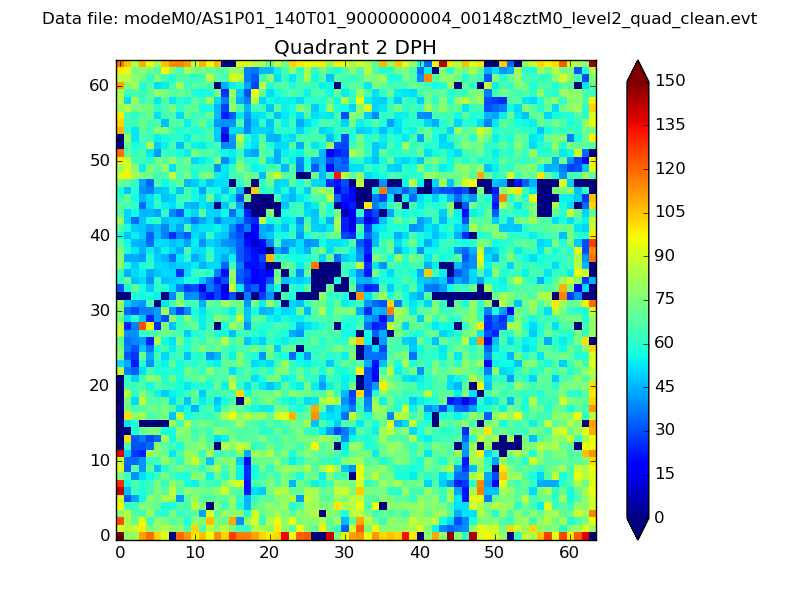
Histogram calculated using DETX and DETY for each event in the final _common_clean file
| Quadrant A |  |
 |
Quadrant B |
|---|---|---|---|
| Quadrant D | 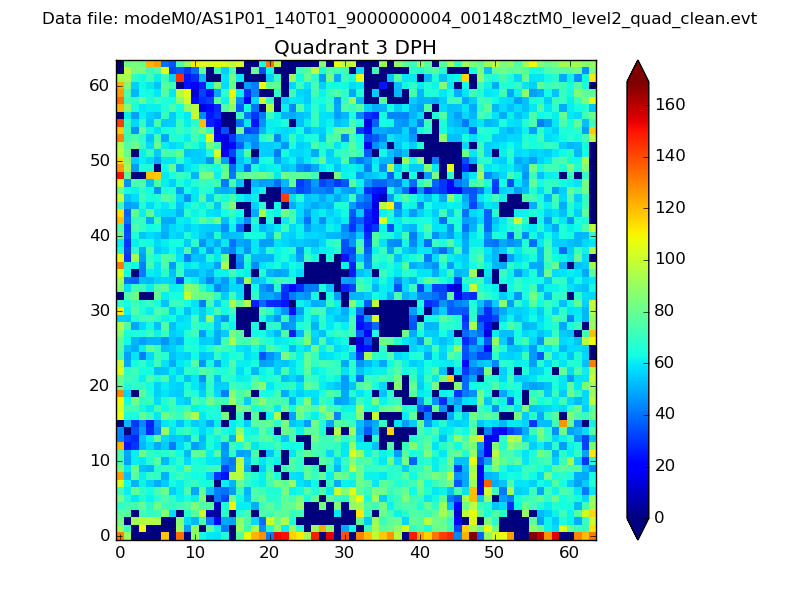 |
 |
Quadrant C |
| Plot type | Count rate plots | Images |
|---|---|---|
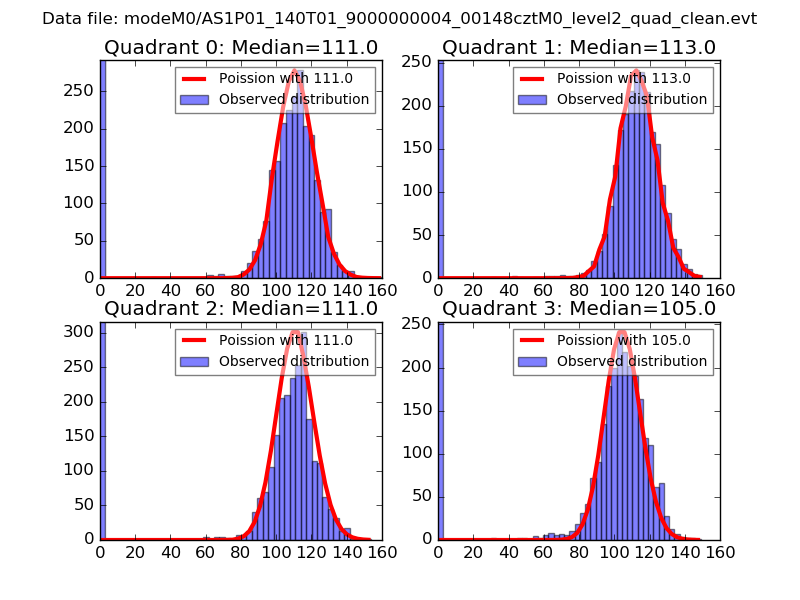
| Comparison with Poisson distribution Blue bars denote a histogram of data divided into 1 sec bins. Red curve is a Poisson curve with rate = median count rate of data. |
 |
 |
| Quadrant-wise count rates Data is divided into 100 sec bins |
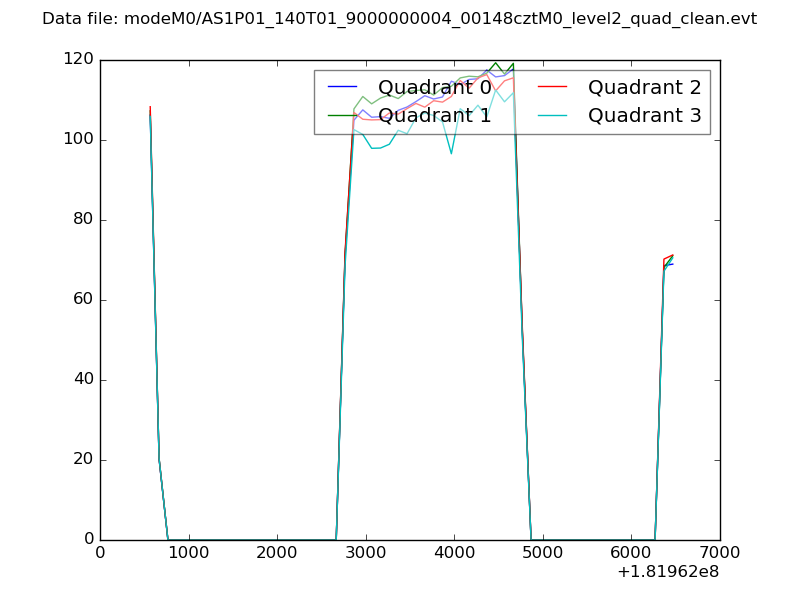 |
|
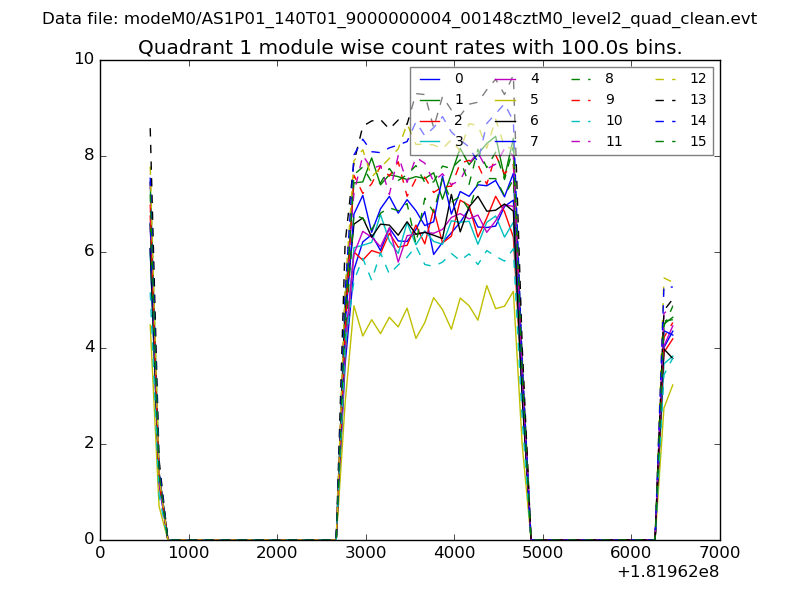
| Module-wise count rates for Quadrant A Data is divided into 100 sec bins |
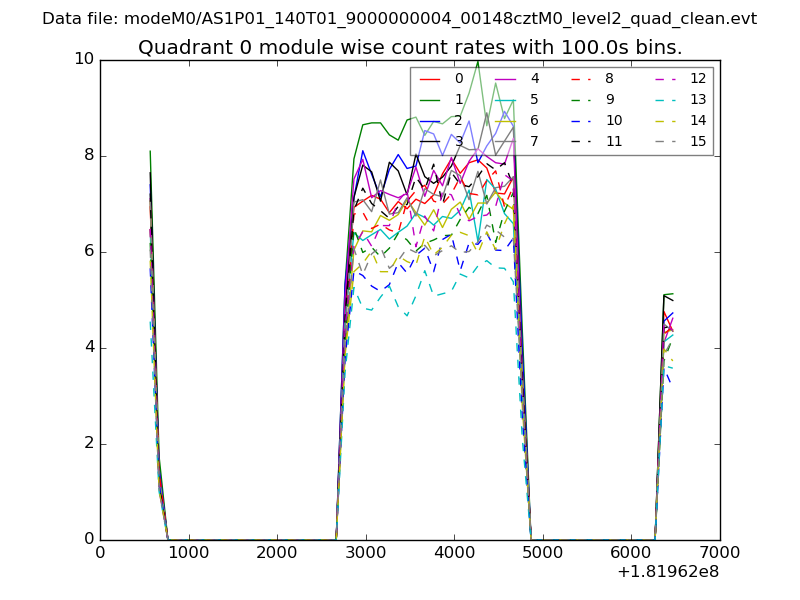 |
 |
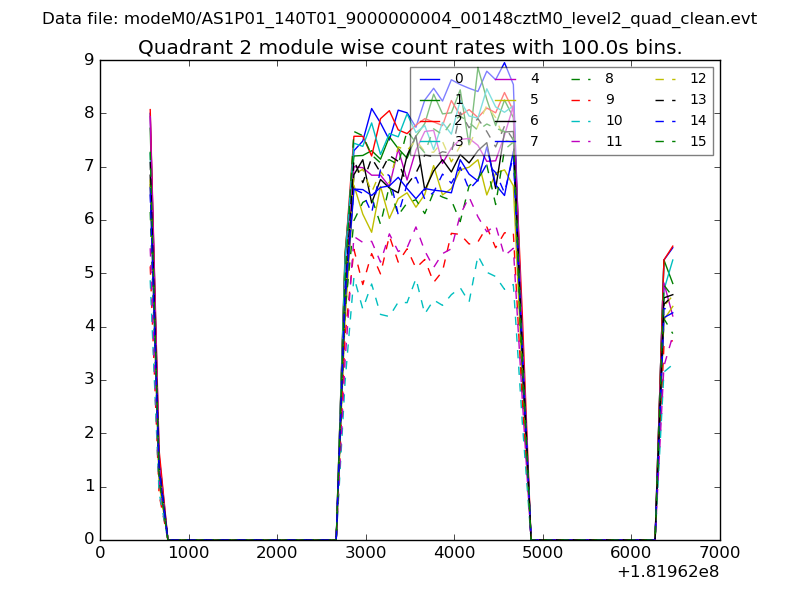
| Module-wise count rates for Quadrant B Data is divided into 100 sec bins |
 |
 |
| Module-wise count rates for Quadrant C Data is divided into 100 sec bins |
 |
 |
| Module-wise count rates for Quadrant D Data is divided into 100 sec bins |
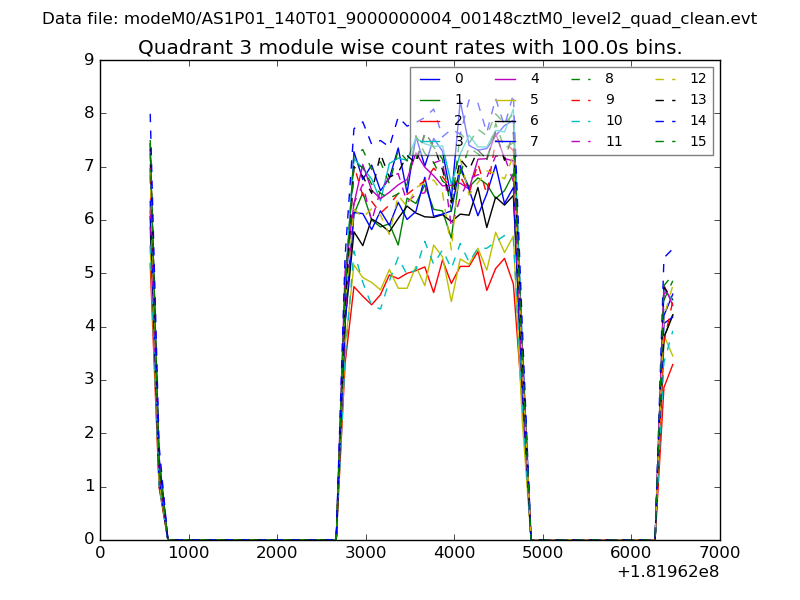 |
 |
| Parameter | Plot |
|---|---|
| CZT HV Monitor | 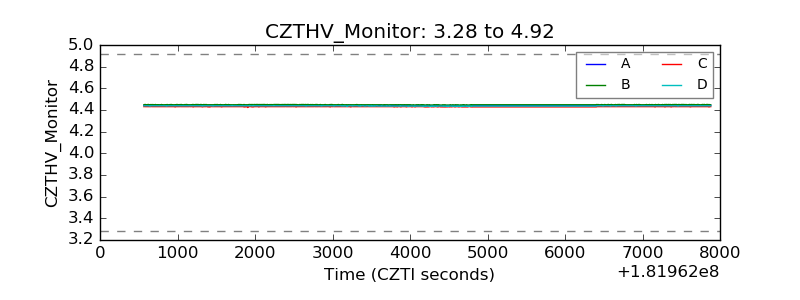 |
| D_VDD | 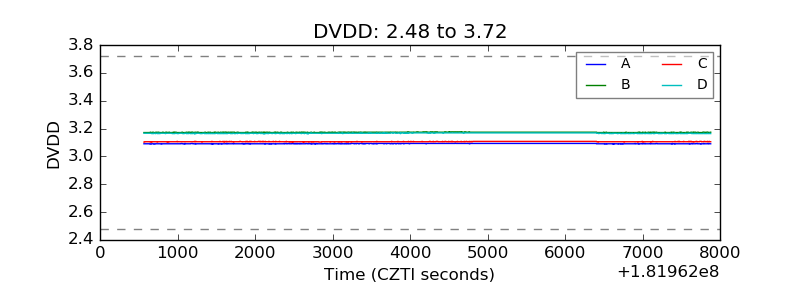 |
| Temperature 1 | 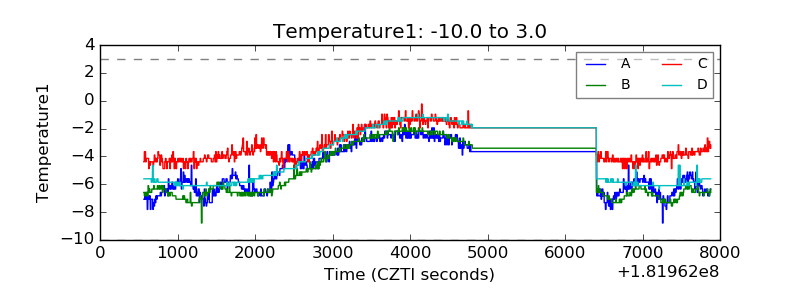 |
| Veto HV Monitor | 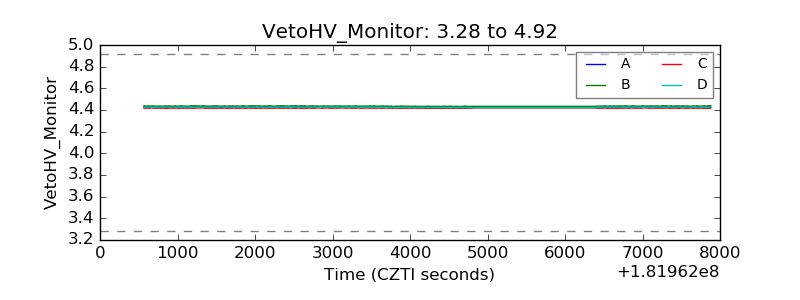 |
| Veto LLD | 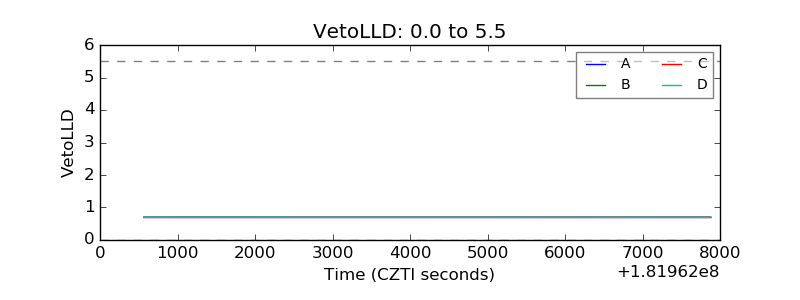 |
| Alpha Counter | 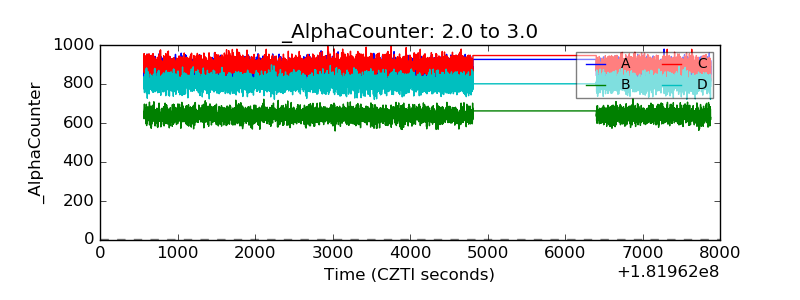 |
| _CPM_Rate | 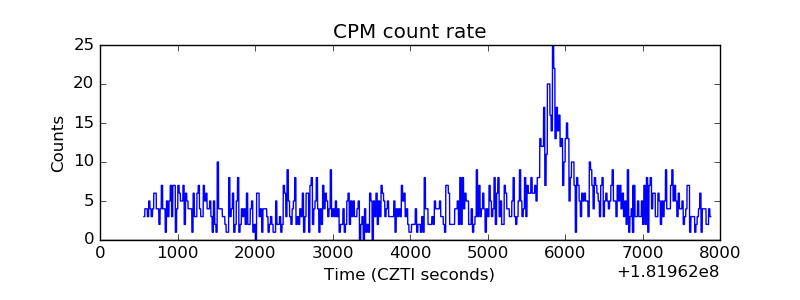 |
| CZT Counter | 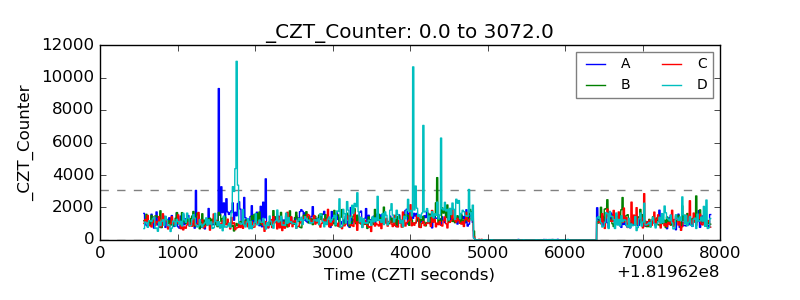 |
| +2.5 Volts monitor | 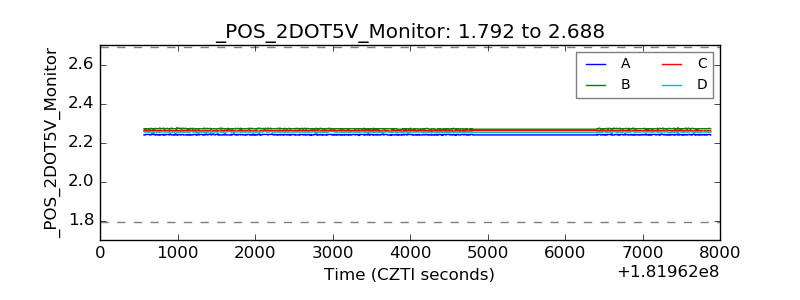 |
| +5 Volts monitor |  |
| _ROLL_ROT | 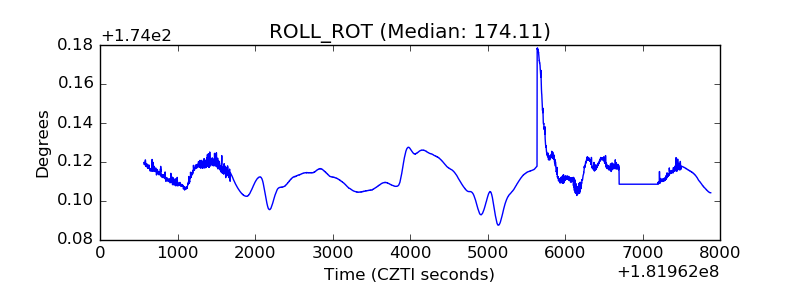 |
| _Roll_DEC | 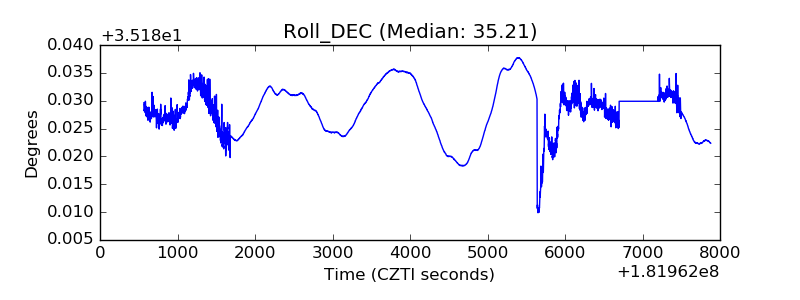 |
| _Roll_RA | 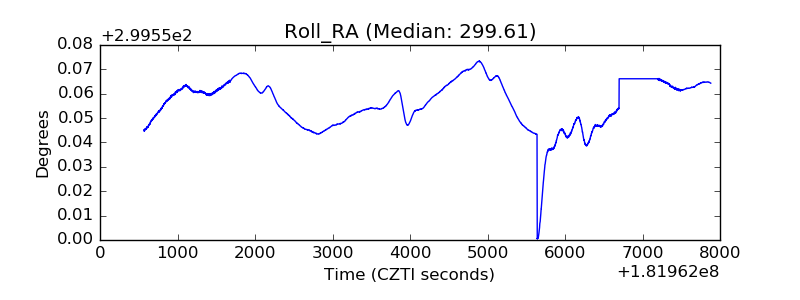 |
| Veto Counter | 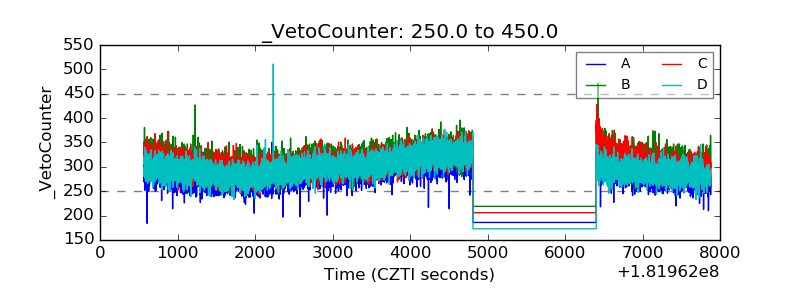 |