| Param | Original file | Final file |
|---|---|---|
| Filename | modeM0/AS1P01_140T01_9000000004_00150cztM0_level2.evt | modeM0/AS1P01_140T01_9000000004_00150cztM0_level2_quad_clean.evt |
| Size (bytes) | 671,993,280 | 43,130,880 |
| Size | 640.9 MB | 41.1 MB |
| Events in quadrant A | 4,904,628 | 265,754 |
| Events in quadrant B | 4,850,932 | 271,913 |
| Events in quadrant C | 4,260,155 | 263,104 |
| Events in quadrant D | 6,076,973 | 230,190 |
| Mode SS | |||
|---|---|---|---|
| Quadrant | BADHDUFLAG | Total packets | Discarded packets |
| A | 0 | 80 | 0 |
| B | 0 | 80 | 0 |
| C | 0 | 80 | 0 |
| D | 0 | 80 | 0 |
| Mode M9 | |||
|---|---|---|---|
| Quadrant | BADHDUFLAG | Total packets | Discarded packets |
| A | 0 | 5 | 0 |
| B | 0 | 5 | 0 |
| C | 0 | 5 | 0 |
| D | 0 | 5 | 0 |
| Mode M0 | |||
|---|---|---|---|
| Quadrant | BADHDUFLAG | Total packets | Discarded packets |
| A | 0 | 17294 | 0 |
| B | 0 | 17161 | 0 |
| C | 0 | 15440 | 0 |
| D | 0 | 20835 | 0 |
| Quadrant | Total seconds | Saturated seconds | Saturation percentage |
|---|---|---|---|
| A | 3885 | 7 | 0.180180% |
| B | 3885 | 23 | 0.592021% |
| C | 3885 | 5 | 0.128700% |
| D | 3885 | 430 | 11.068211% |
Noise dominated data is calculated using 1-second bins in cleaned event files. If a bin has >2000 counts, and if more than 50% of those come from <1% of pixels, then it is considered to be noise-dominated and hence unusable.
| Quadrant | # 1 sec bins | Bins with >0 counts | Bins with >2000 counts | High rate bins dominated by noise | Noise dominated (total time) | Noise dominated (detector-on time) | Marked lightcurve |
|---|---|---|---|---|---|---|---|
| A | 3886 | 3886 | 127 | 127 | 3.27% | 3.27% | 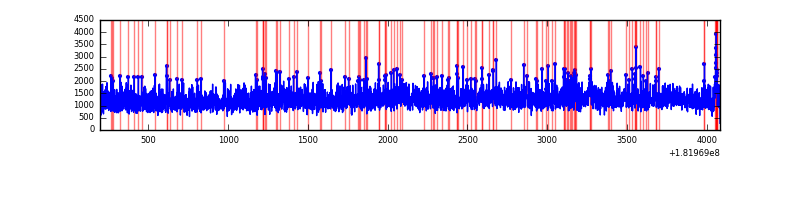 |
| B | 3886 | 3886 | 103 | 103 | 2.65% | 2.65% | 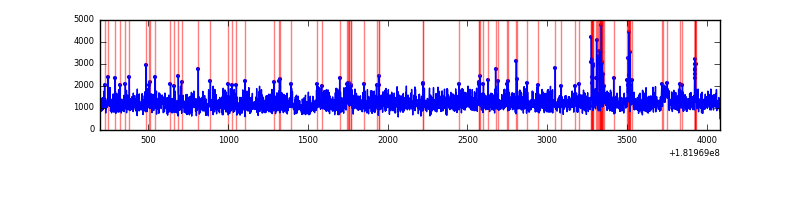 |
| C | 3886 | 3886 | 45 | 45 | 1.16% | 1.16% | 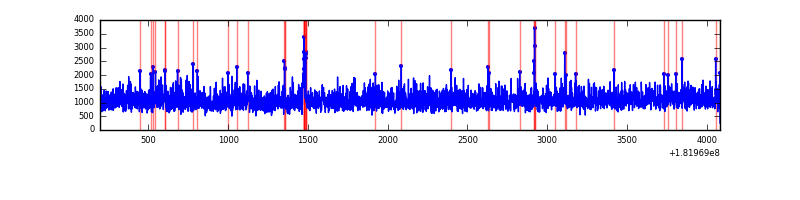 |
| D | 3886 | 3886 | 714 | 714 | 18.37% | 18.37% | 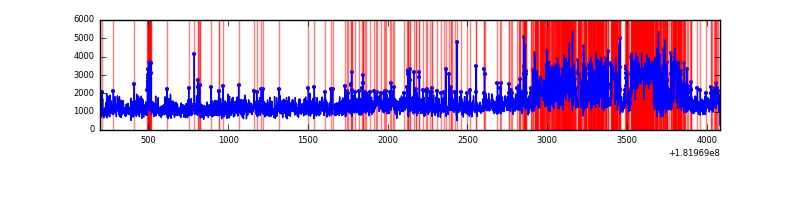 |
Top three noisy pixels from each quadrant. If the there are fewer than three noisy pixels in the level2.evt file, extra rows are filled as -1
| Pixel properties | Quadrant properties | ||||||
|---|---|---|---|---|---|---|---|
| Quadrant | DetID | PixID | Counts | Sigma | Mean | Median | Sigma |
| A | 14 | 10 | 47143 | 226.55 | 1224 | 1192 | 202.8 |
| A | 13 | 146 | 43621 | 209.18 | 1224 | 1192 | 202.8 |
| A | 15 | 233 | 16957 | 77.72 | 1224 | 1192 | 202.8 |
| B | 0 | 255 | 79110 | 293.04 | 1176 | 1178 | 265.9 |
| B | 10 | 199 | 75958 | 281.19 | 1176 | 1178 | 265.9 |
| B | 8 | 236 | 40663 | 148.47 | 1176 | 1178 | 265.9 |
| C | 9 | 54 | 57528 | 188.11 | 1059 | 1095 | 300.0 |
| C | 10 | 17 | 11078 | 33.28 | 1059 | 1095 | 300.0 |
| C | 9 | 231 | 7434 | 21.13 | 1059 | 1095 | 300.0 |
| D | 0 | 243 | 290114 | 987.58 | 1127 | 1105 | 292.6 |
| D | 10 | 101 | 228173 | 775.92 | 1127 | 1105 | 292.6 |
| D | 2 | 70 | 122299 | 414.14 | 1127 | 1105 | 292.6 |
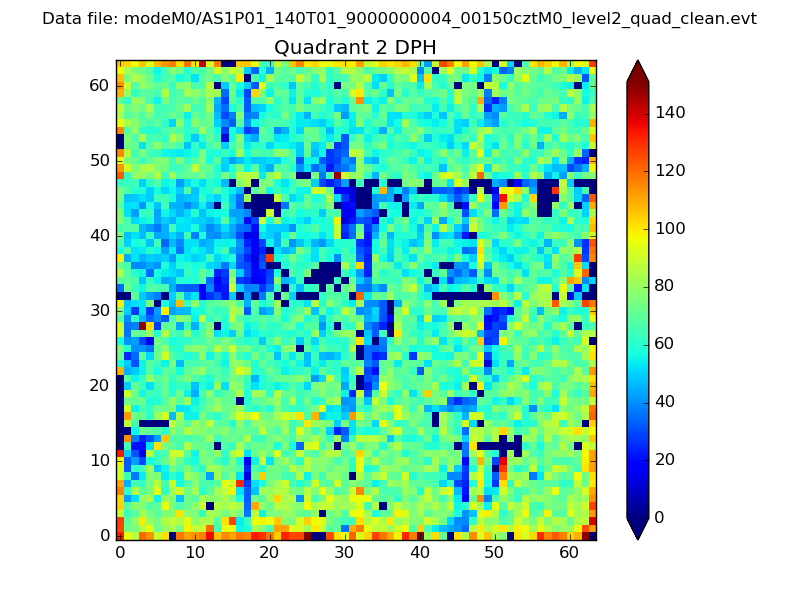
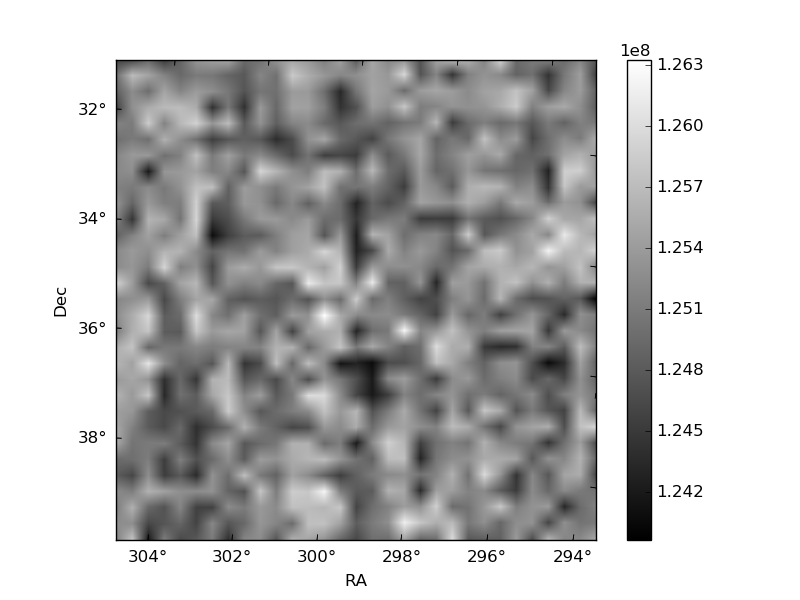
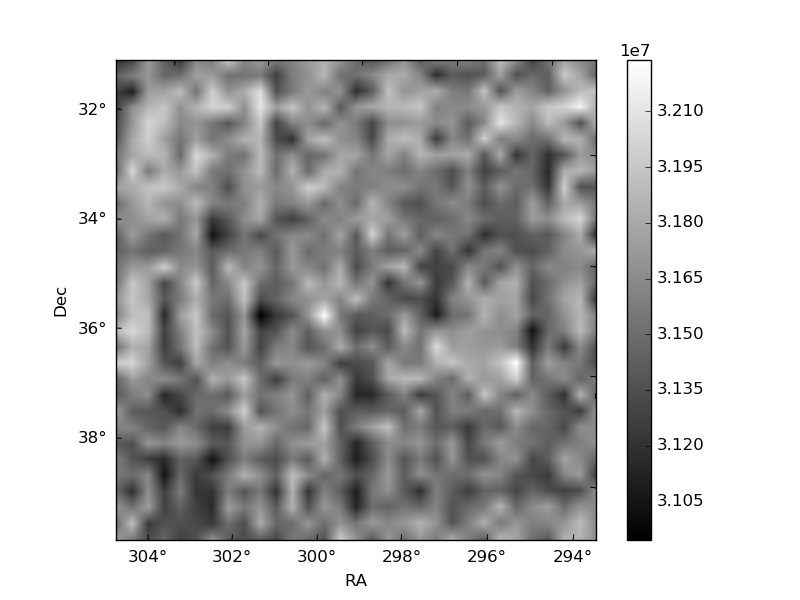
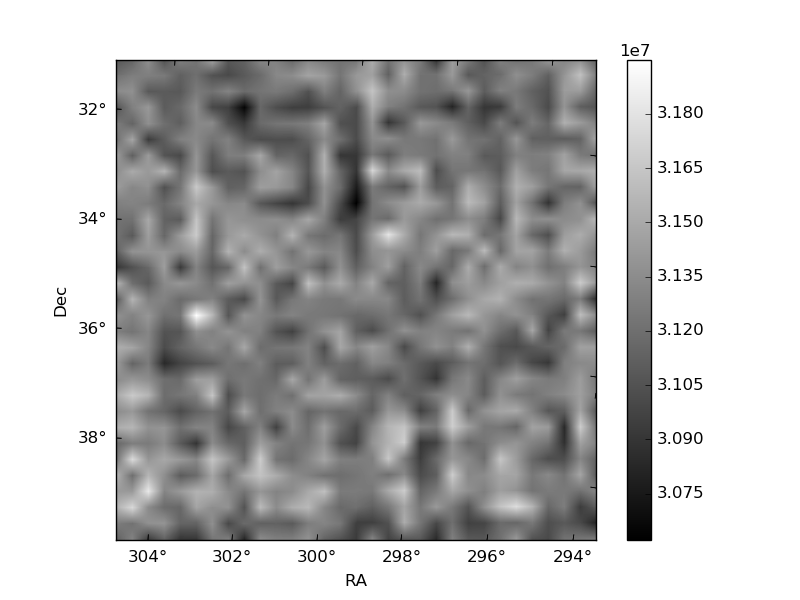
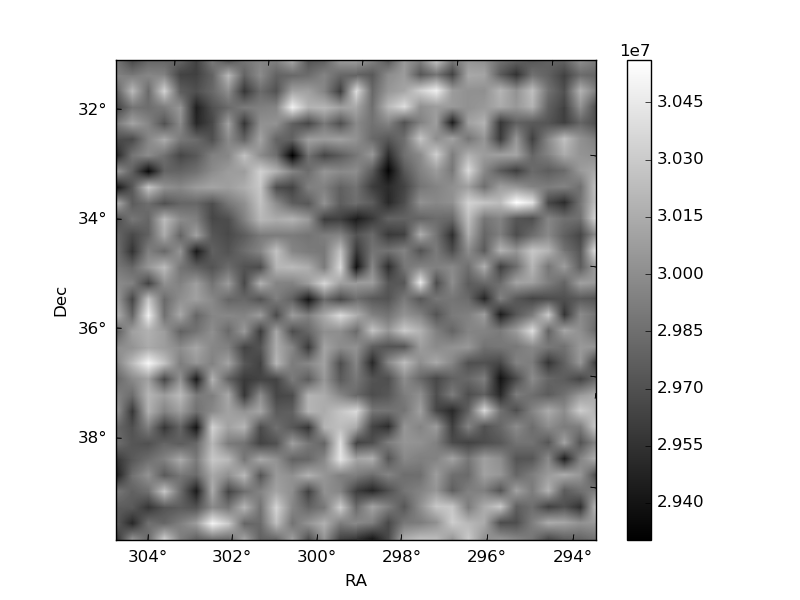
Histogram calculated using DETX and DETY for each event in the final _common_clean file
| Quadrant A | 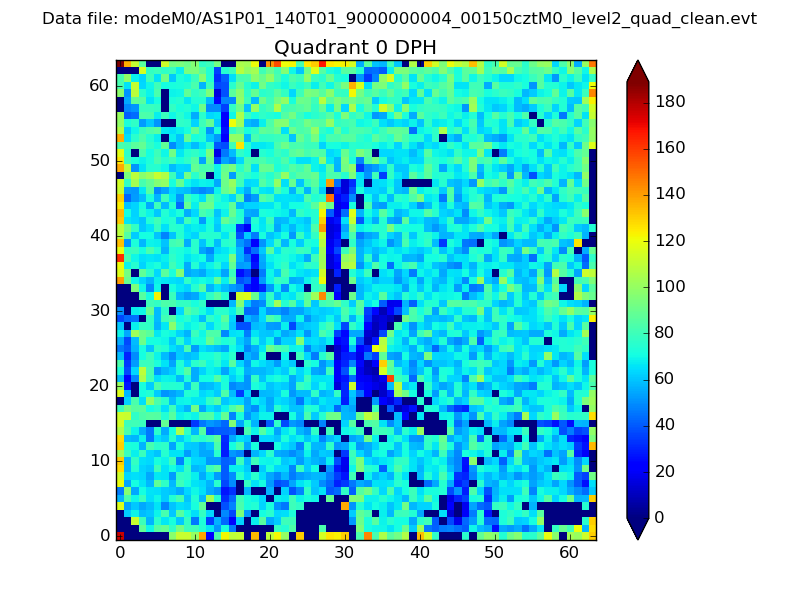 |
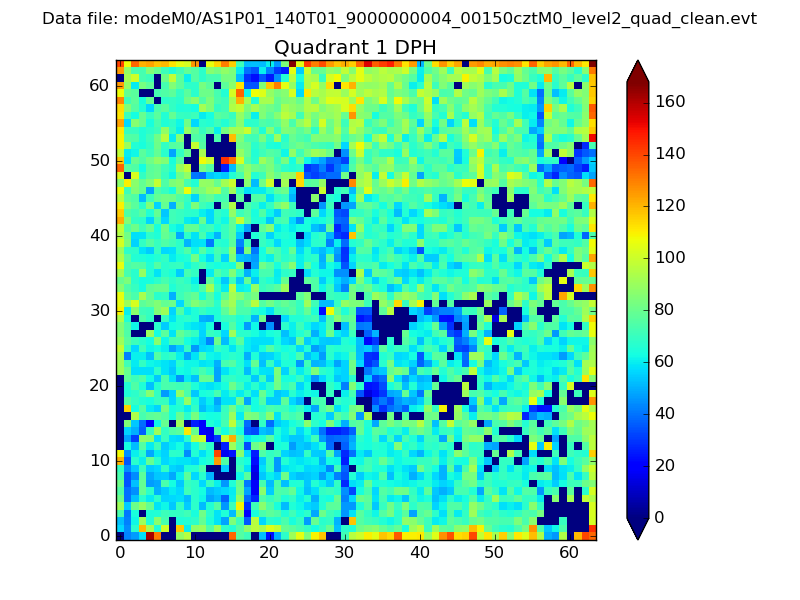 |
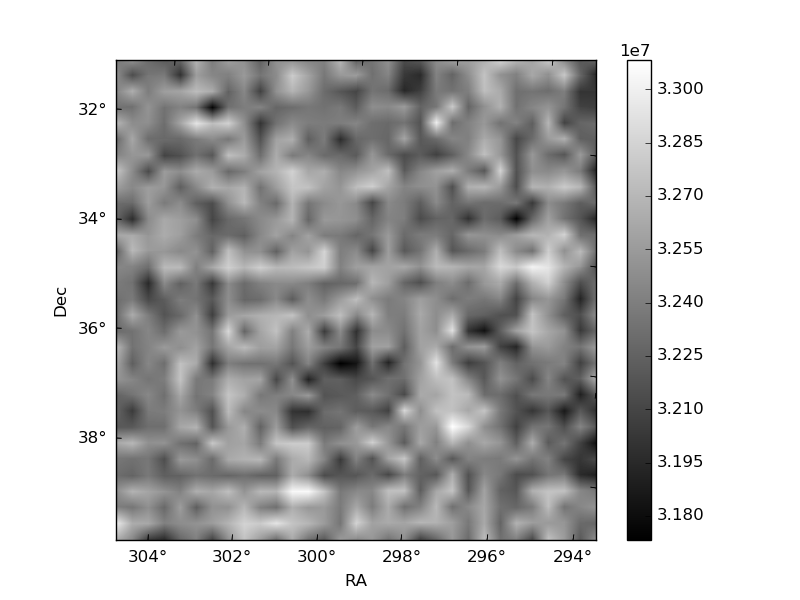
Quadrant B |
|---|---|---|---|
| Quadrant D | 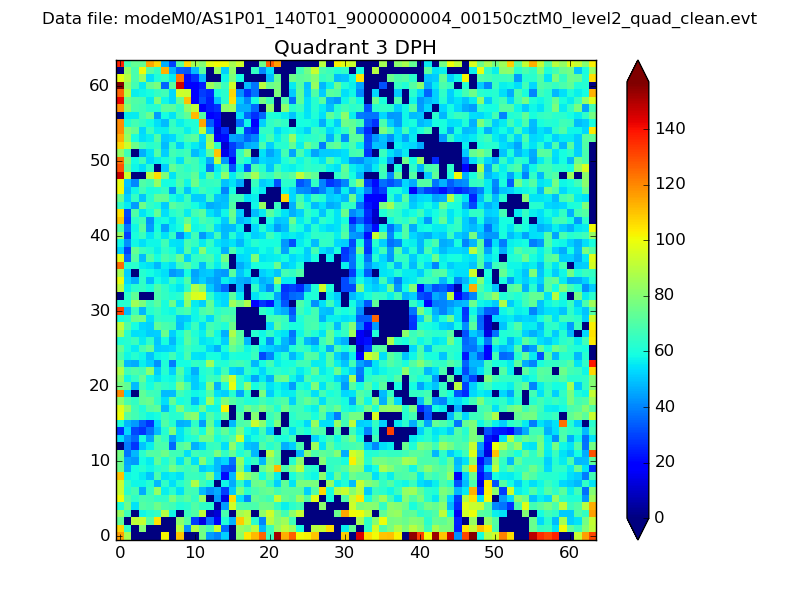 |
 |
Quadrant C |
| Plot type | Count rate plots | Images |
|---|---|---|
| Comparison with Poisson distribution Blue bars denote a histogram of data divided into 1 sec bins. Red curve is a Poisson curve with rate = median count rate of data. |
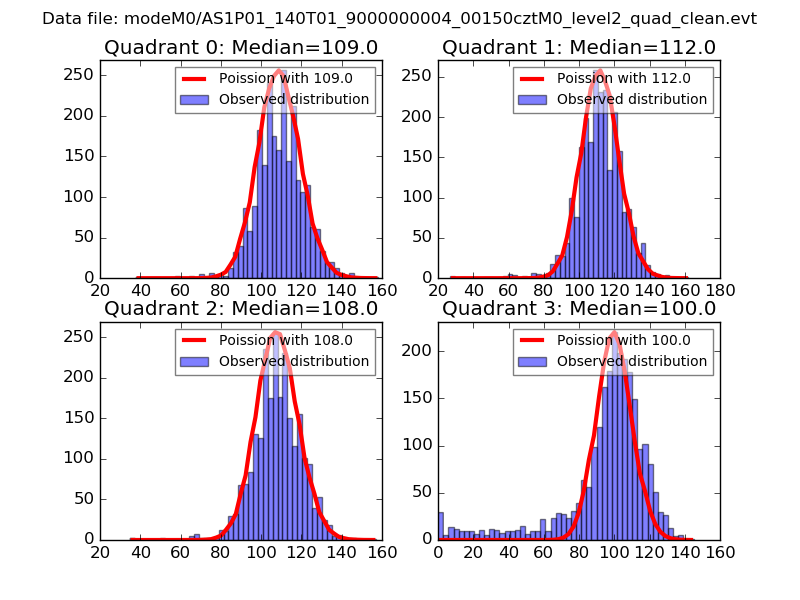 |
 |
| Quadrant-wise count rates Data is divided into 100 sec bins |
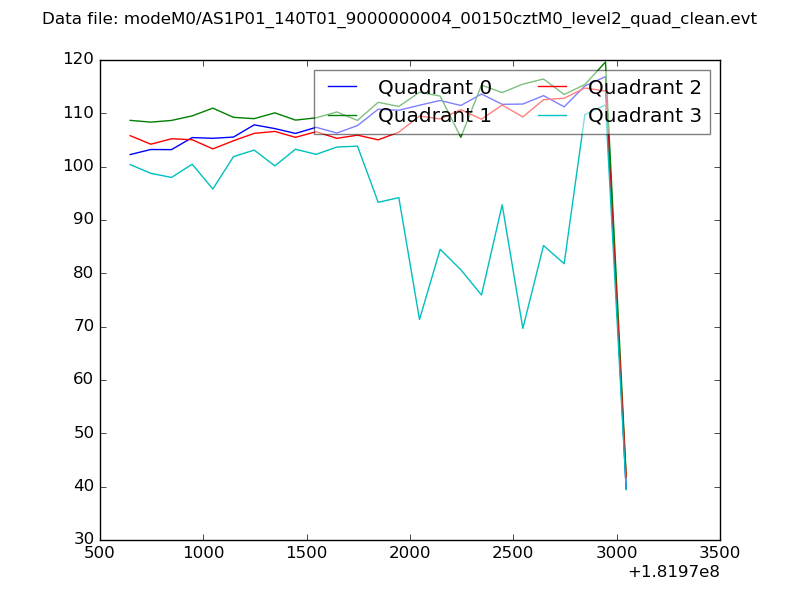 |
|
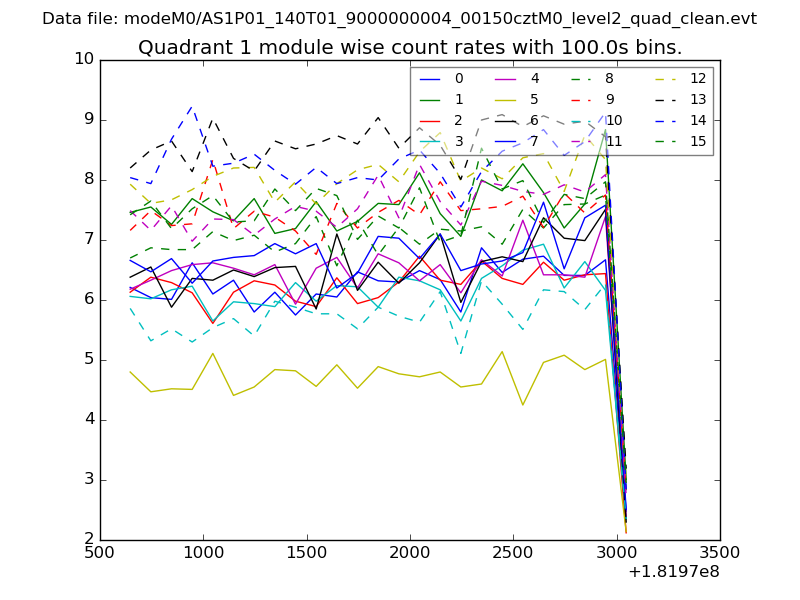
| Module-wise count rates for Quadrant A Data is divided into 100 sec bins |
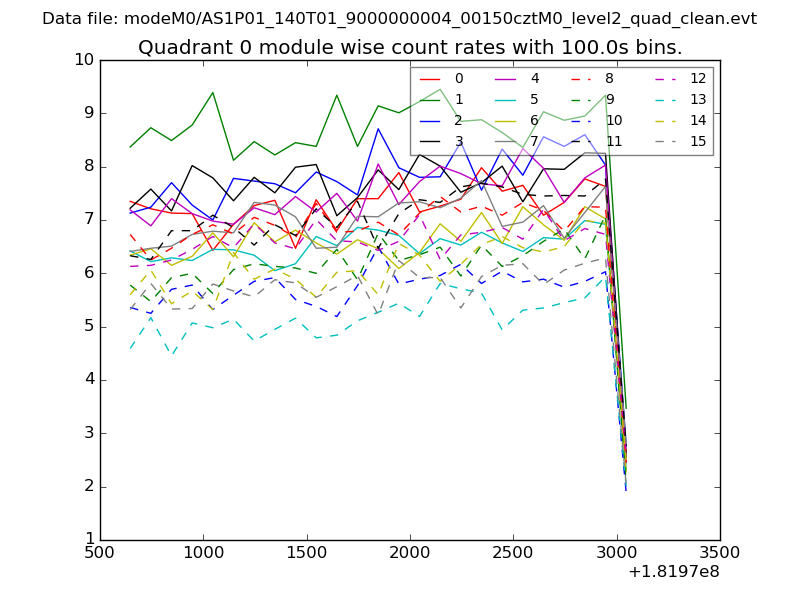 |
 |
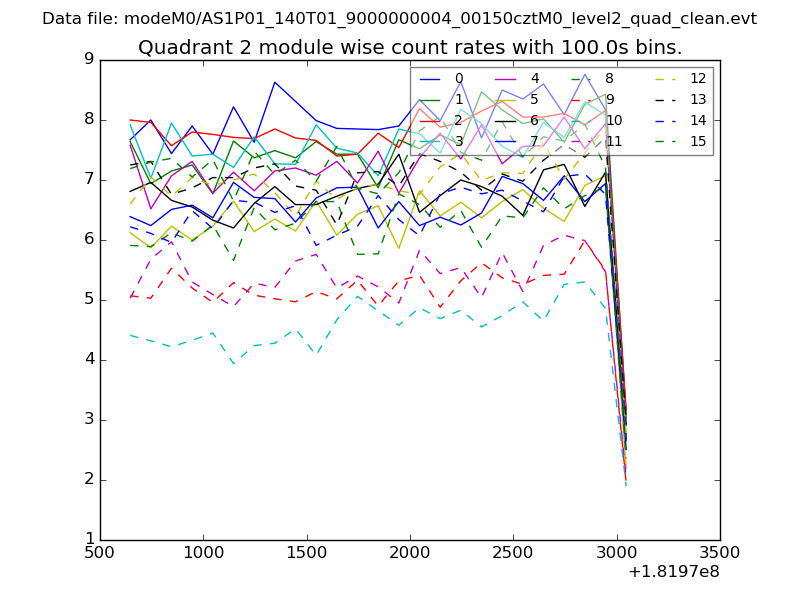
| Module-wise count rates for Quadrant B Data is divided into 100 sec bins |
 |
 |
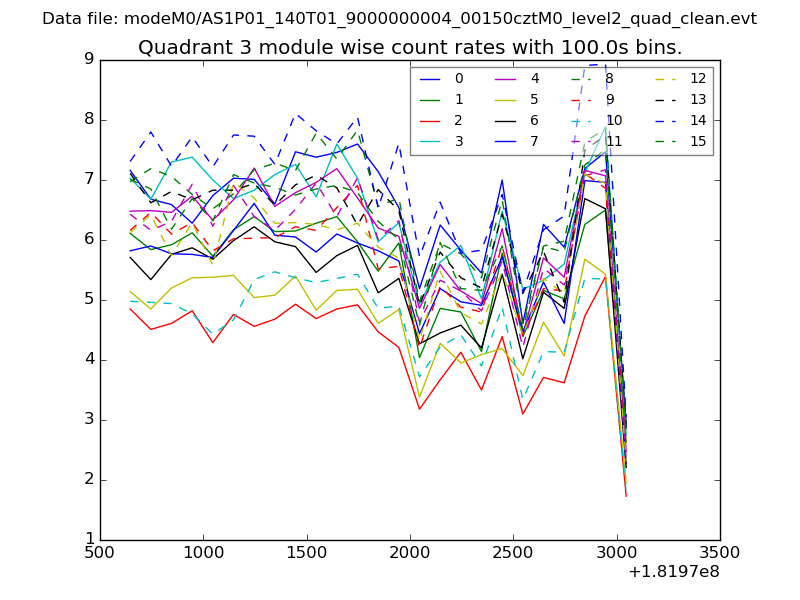
| Module-wise count rates for Quadrant C Data is divided into 100 sec bins |
 |
 |
| Module-wise count rates for Quadrant D Data is divided into 100 sec bins |
 |
 |
| Parameter | Plot |
|---|---|
| CZT HV Monitor | 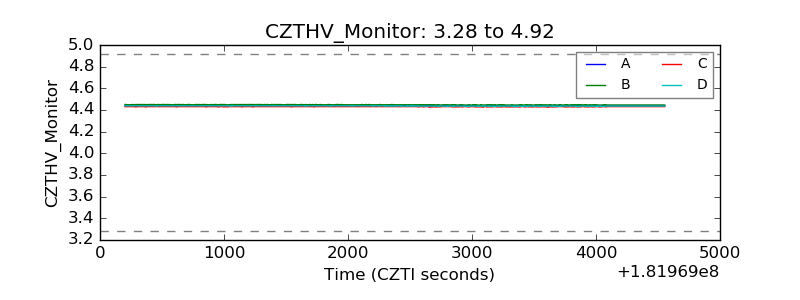 |
| D_VDD | 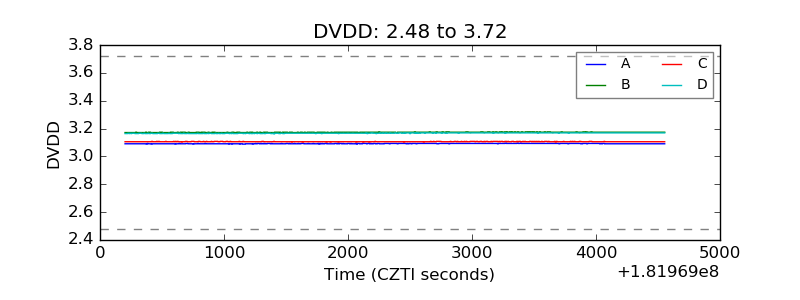 |
| Temperature 1 | 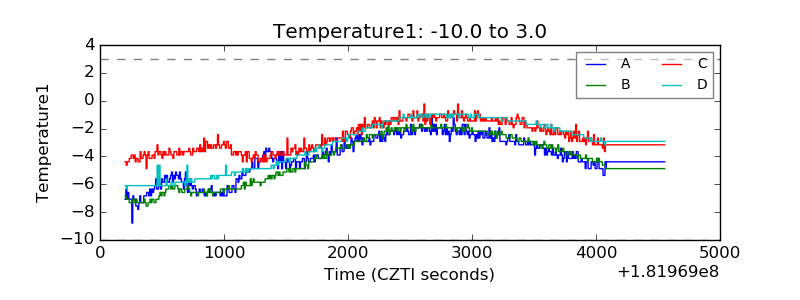 |
| Veto HV Monitor | 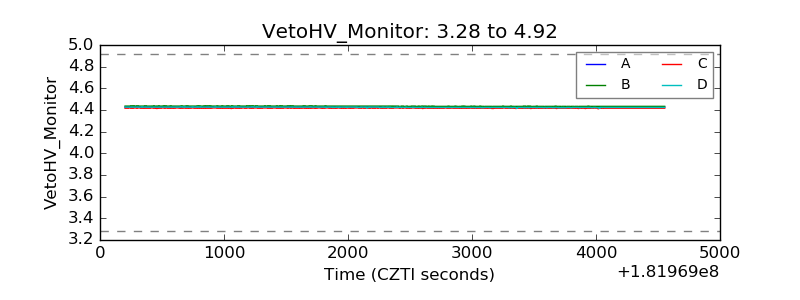 |
| Veto LLD | 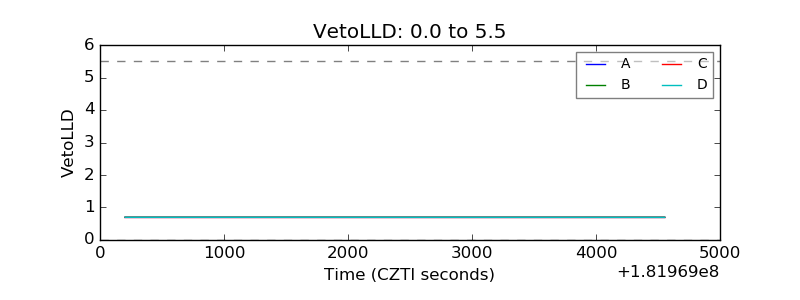 |
| Alpha Counter | 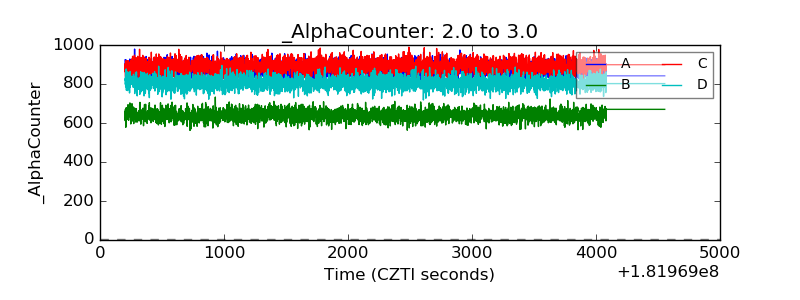 |
| _CPM_Rate |  |
| CZT Counter | 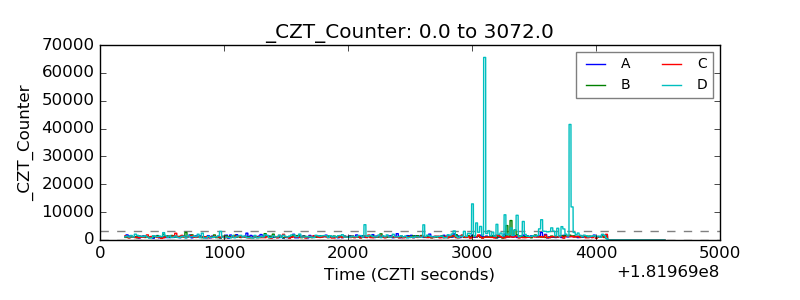 |
| +2.5 Volts monitor |  |
| +5 Volts monitor |  |
| _ROLL_ROT | 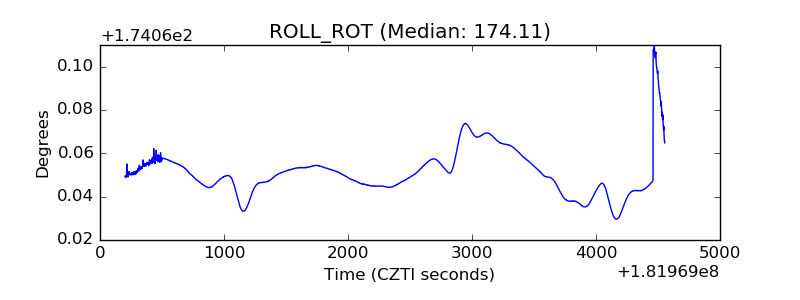 |
| _Roll_DEC | 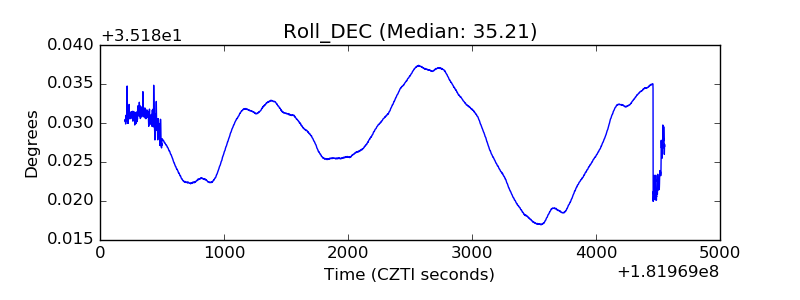 |
| _Roll_RA | 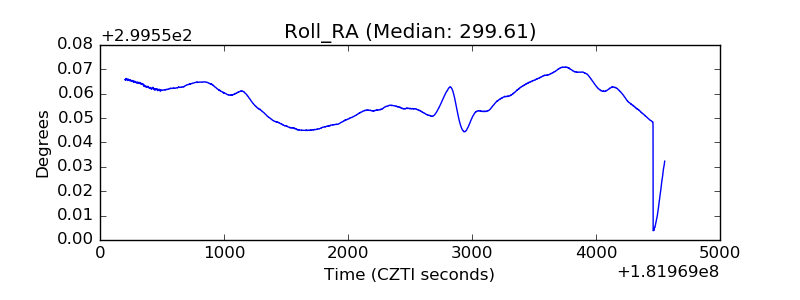 |
| Veto Counter | 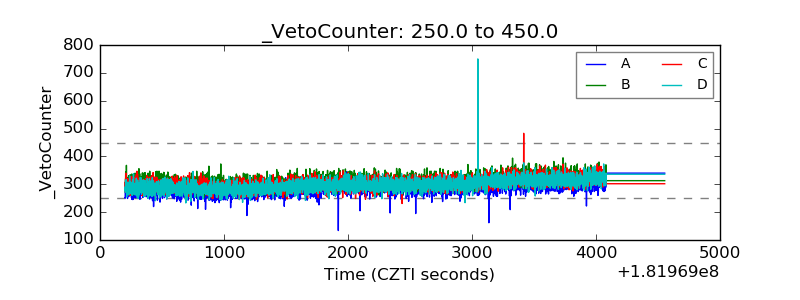 |