| Param | Original file | Final file |
|---|---|---|
| Filename | modeM0/AS1P01_120T01_9000000006cztM0_level2.fits | modeM0/AS1P01_120T01_9000000006cztM0_level2_quad_clean.evt |
| Size (bytes) | 450,524,160 | 212,060,160 |
| Size | 429.7 MB | 202.2 MB |
| Events in quadrant A | 2,542,490 | 633,969 |
| Events in quadrant B | 2,544,870 | 681,841 |
| Events in quadrant C | 2,588,712 | 660,781 |
| Events in quadrant D | 2,094,496 | 569,552 |
| Mode SS | |||
|---|---|---|---|
| Quadrant | BADHDUFLAG | Total packets | Discarded packets |
| A | 0 | 1170 | 0 |
| B | 0 | 1168 | 0 |
| C | 0 | 1166 | 0 |
| D | 0 | 1168 | 0 |
| Mode M9 | |||
|---|---|---|---|
| Quadrant | BADHDUFLAG | Total packets | Discarded packets |
| A | 0 | 197 | 0 |
| B | 0 | 197 | 0 |
| C | 0 | 195 | 0 |
| D | 0 | 196 | 0 |
| Mode M0 | |||
|---|---|---|---|
| Quadrant | BADHDUFLAG | Total packets | Discarded packets |
| A | 0 | 256955 | 0 |
| B | 0 | 257445 | 0 |
| C | 0 | 233344 | 0 |
| D | 0 | 260722 | 0 |
| Quadrant | Total seconds | Saturated seconds | Saturation percentage |
|---|---|---|---|
| A | 56491 | 683 | 1.209042% |
| B | 56468 | 540 | 0.956294% |
| C | 56622 | 94 | 0.166013% |
| D | 55972 | 1633 | 2.917530% |
Noise dominated data is calculated using 1-second bins in cleaned event files. If a bin has >2000 counts, and if more than 50% of those come from <1% of pixels, then it is considered to be noise-dominated and hence unusable.
| Quadrant | # 1 sec bins | Bins with >0 counts | Bins with >2000 counts | High rate bins dominated by noise | Noise dominated (total time) | Noise dominated (detector-on time) | Marked lightcurve |
|---|---|---|---|---|---|---|---|
| A | 105551 | 56794 | 0 | 0 | 0.00% | 0.00% |  |
| B | 105552 | 56772 | 0 | 0 | 0.00% | 0.00% |  |
| C | 105552 | 56939 | 0 | 0 | 0.00% | 0.00% |  |
| D | 105552 | 56212 | 0 | 0 | 0.00% | 0.00% |  |
Top three noisy pixels from each quadrant. If the there are fewer than three noisy pixels in the level2.evt file, extra rows are filled as -1
| Pixel properties | Quadrant properties | ||||||
|---|---|---|---|---|---|---|---|
| Quadrant | DetID | PixID | Counts | Sigma | Mean | Median | Sigma |
| A | 7 | 110 | 2486 | 12.14 | 662 | 618 | 153.9 |
| A | 0 | 29 | 2226 | 10.45 | 662 | 618 | 153.9 |
| A | 0 | 30 | 1760 | 7.42 | 662 | 618 | 153.9 |
| B | 2 | 9 | 2112 | 11.77 | 677 | 642 | 124.9 |
| B | 14 | 254 | 1713 | 8.57 | 677 | 642 | 124.9 |
| B | 5 | 225 | 1589 | 7.58 | 677 | 642 | 124.9 |
| C | 3 | 203 | 2170 | 9.0 | 685 | 632 | 170.8 |
| C | 3 | 202 | 1869 | 7.24 | 685 | 632 | 170.8 |
| C | 3 | 187 | 1839 | 7.06 | 685 | 632 | 170.8 |
| D | 6 | 231 | 1662 | 7.51 | 605 | 554 | 147.5 |
| D | 3 | 14 | 1649 | 7.42 | 605 | 554 | 147.5 |
| D | 6 | 114 | 1580 | 6.96 | 605 | 554 | 147.5 |
Histogram calculated using DETX and DETY for each event in the final _common_clean file
| Quadrant A | 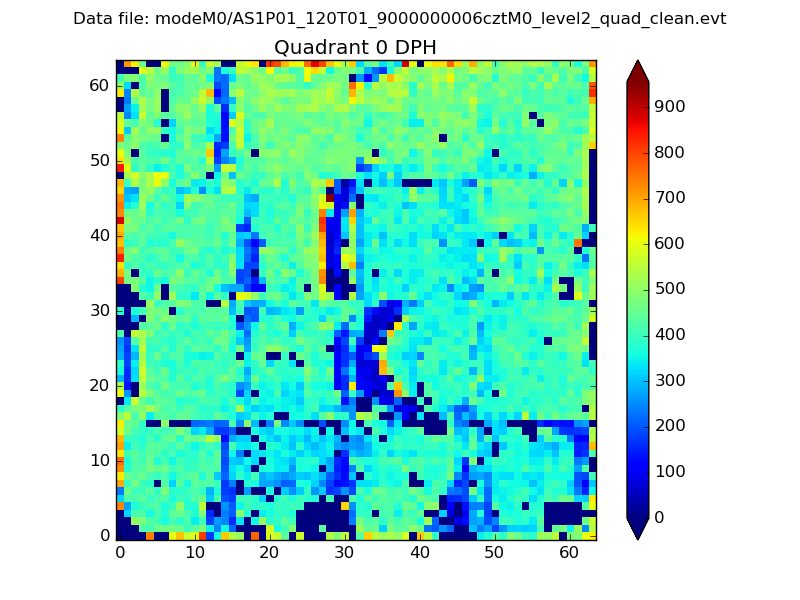 |
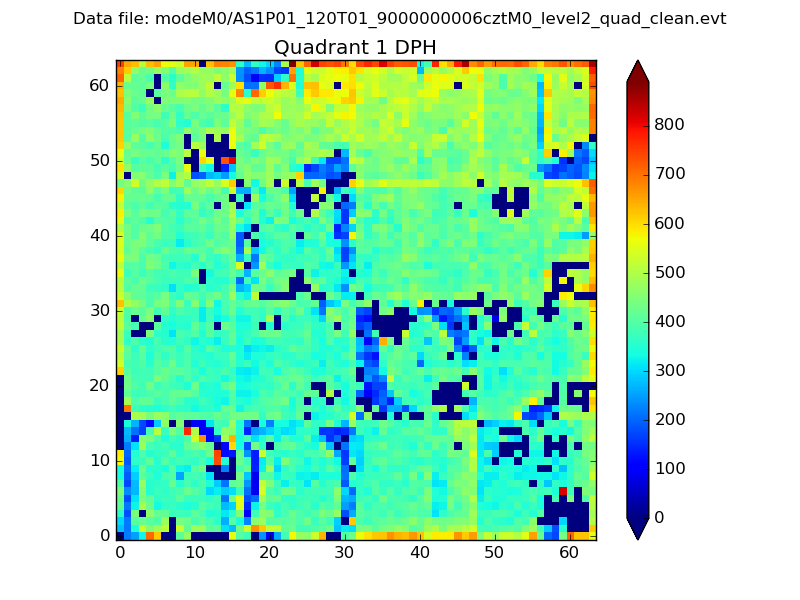 |
Quadrant B |
|---|---|---|---|
| Quadrant D | 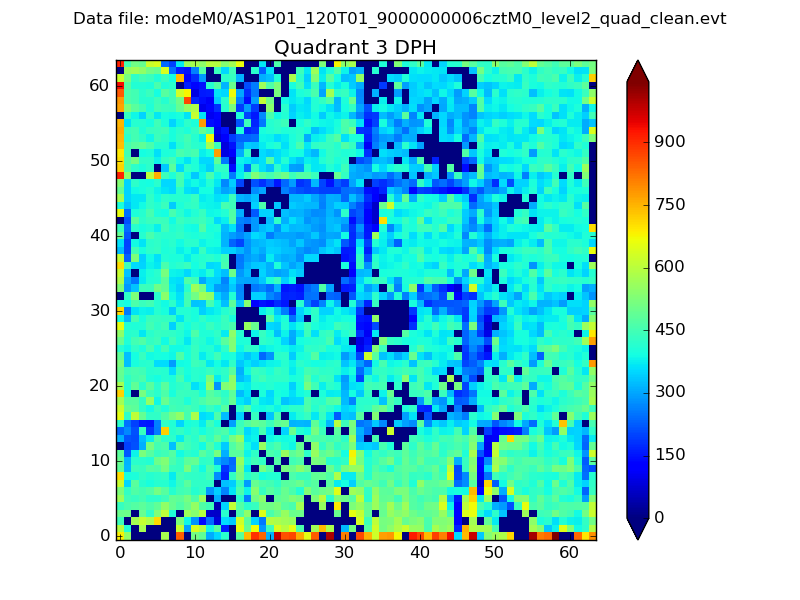 |
 |
Quadrant C |
| Plot type | Count rate plots | Images |
|---|---|---|
| Comparison with Poisson distribution Blue bars denote a histogram of data divided into 1 sec bins. Red curve is a Poisson curve with rate = median count rate of data. |
 |
 |
| Quadrant-wise count rates Data is divided into 100 sec bins |
 |
|
| Module-wise count rates for Quadrant A Data is divided into 100 sec bins |
 |
 |
| Module-wise count rates for Quadrant B Data is divided into 100 sec bins |
 |
 |
| Module-wise count rates for Quadrant C Data is divided into 100 sec bins |
 |
 |
| Module-wise count rates for Quadrant D Data is divided into 100 sec bins |
 |
 |
| Parameter | Plot |
|---|---|
| CZT HV Monitor |  |
| D_VDD |  |
| Temperature 1 |  |
| Veto HV Monitor |  |
| Veto LLD |  |
| Alpha Counter |  |
| _CPM_Rate |  |
| CZT Counter |  |
| +2.5 Volts monitor |  |
| +5 Volts monitor |  |
| _ROLL_ROT |  |
| _Roll_DEC |  |
| _Roll_RA |  |
| Veto Counter |  |