| Param | Original file | Final file |
|---|---|---|
| Filename | modeM0/AS1P01_120T01_9000000006_00150cztM0_level2.evt | modeM0/AS1P01_120T01_9000000006_00150cztM0_level2_quad_clean.evt |
| Size (bytes) | 692,481,600 | 39,559,680 |
| Size | 660.4 MB | 37.7 MB |
| Events in quadrant A | 5,111,353 | 229,237 |
| Events in quadrant B | 5,134,327 | 232,670 |
| Events in quadrant C | 4,738,609 | 229,761 |
| Events in quadrant D | 5,722,658 | 224,328 |
| Mode SS | |||
|---|---|---|---|
| Quadrant | BADHDUFLAG | Total packets | Discarded packets |
| A | 0 | 82 | 0 |
| B | 0 | 82 | 0 |
| C | 0 | 82 | 0 |
| D | 0 | 82 | 0 |
| Mode M9 | |||
|---|---|---|---|
| Quadrant | BADHDUFLAG | Total packets | Discarded packets |
| A | 0 | 16 | 0 |
| B | 0 | 16 | 0 |
| C | 0 | 16 | 0 |
| D | 0 | 16 | 0 |
| Mode M0 | |||
|---|---|---|---|
| Quadrant | BADHDUFLAG | Total packets | Discarded packets |
| A | 0 | 18000 | 2 |
| B | 0 | 18065 | 1 |
| C | 0 | 16897 | 1 |
| D | 0 | 19811 | 1 |
| Quadrant | Total seconds | Saturated seconds | Saturation percentage |
|---|---|---|---|
| A | 3986 | 6 | 0.150527% |
| B | 3986 | 46 | 1.154039% |
| C | 3986 | 4 | 0.100351% |
| D | 3986 | 48 | 1.204215% |
Noise dominated data is calculated using 1-second bins in cleaned event files. If a bin has >2000 counts, and if more than 50% of those come from <1% of pixels, then it is considered to be noise-dominated and hence unusable.
| Quadrant | # 1 sec bins | Bins with >0 counts | Bins with >2000 counts | High rate bins dominated by noise | Noise dominated (total time) | Noise dominated (detector-on time) | Marked lightcurve |
|---|---|---|---|---|---|---|---|
| A | 5577 | 3988 | 135 | 135 | 2.42% | 3.39% | 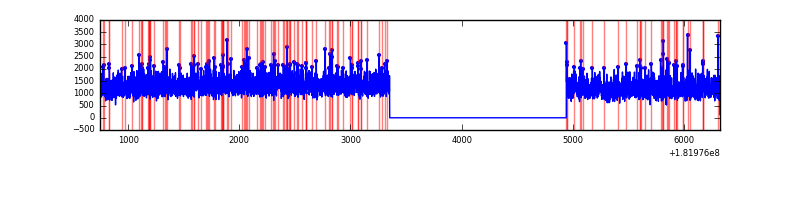 |
| B | 5577 | 3988 | 175 | 175 | 3.14% | 4.39% |  |
| C | 5577 | 3988 | 82 | 82 | 1.47% | 2.06% |  |
| D | 5577 | 3988 | 371 | 371 | 6.65% | 9.30% | 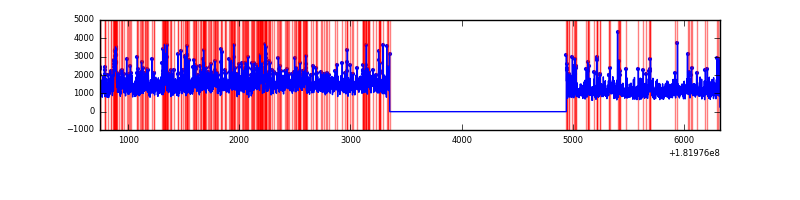 |
Top three noisy pixels from each quadrant. If the there are fewer than three noisy pixels in the level2.evt file, extra rows are filled as -1
| Pixel properties | Quadrant properties | ||||||
|---|---|---|---|---|---|---|---|
| Quadrant | DetID | PixID | Counts | Sigma | Mean | Median | Sigma |
| A | 14 | 10 | 58766 | 277.39 | 1283 | 1255 | 207.3 |
| A | 13 | 146 | 22966 | 104.72 | 1283 | 1255 | 207.3 |
| A | 0 | 166 | 9799 | 41.21 | 1283 | 1255 | 207.3 |
| B | 0 | 170 | 85000 | 299.75 | 1243 | 1246 | 279.4 |
| B | 10 | 48 | 66476 | 233.45 | 1243 | 1246 | 279.4 |
| B | 10 | 199 | 48056 | 167.53 | 1243 | 1246 | 279.4 |
| C | 0 | 188 | 108376 | 333.49 | 1132 | 1170 | 321.5 |
| C | 0 | 218 | 72560 | 222.08 | 1132 | 1170 | 321.5 |
| C | 9 | 128 | 38661 | 116.62 | 1132 | 1170 | 321.5 |
| D | 0 | 243 | 303909 | 1006.26 | 1223 | 1221 | 300.8 |
| D | 2 | 70 | 269240 | 891.01 | 1223 | 1221 | 300.8 |
| D | 13 | 222 | 148658 | 490.14 | 1223 | 1221 | 300.8 |
Histogram calculated using DETX and DETY for each event in the final _common_clean file
| Quadrant A |  |
 |
Quadrant B |
|---|---|---|---|
| Quadrant D |  |
 |
Quadrant C |
| Plot type | Count rate plots | Images |
|---|---|---|
| Comparison with Poisson distribution Blue bars denote a histogram of data divided into 1 sec bins. Red curve is a Poisson curve with rate = median count rate of data. |
 |
 |
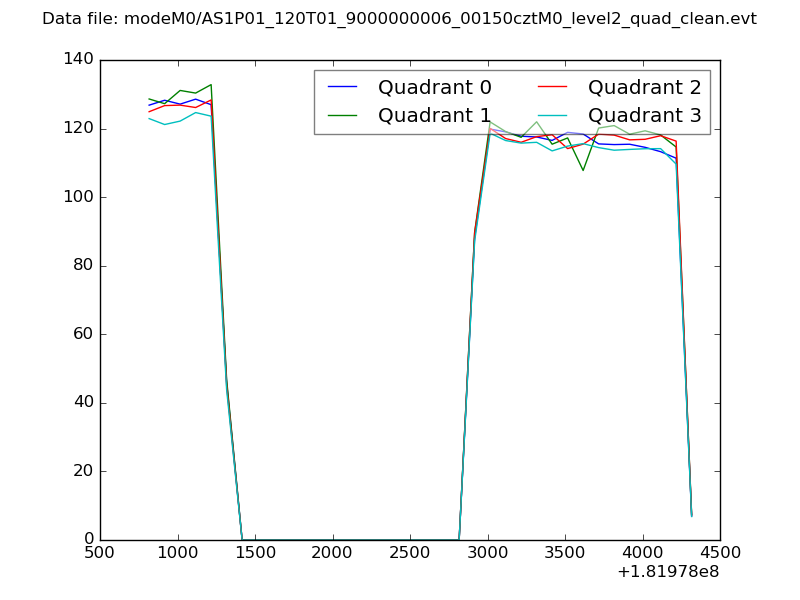
| Quadrant-wise count rates Data is divided into 100 sec bins |
 |
|
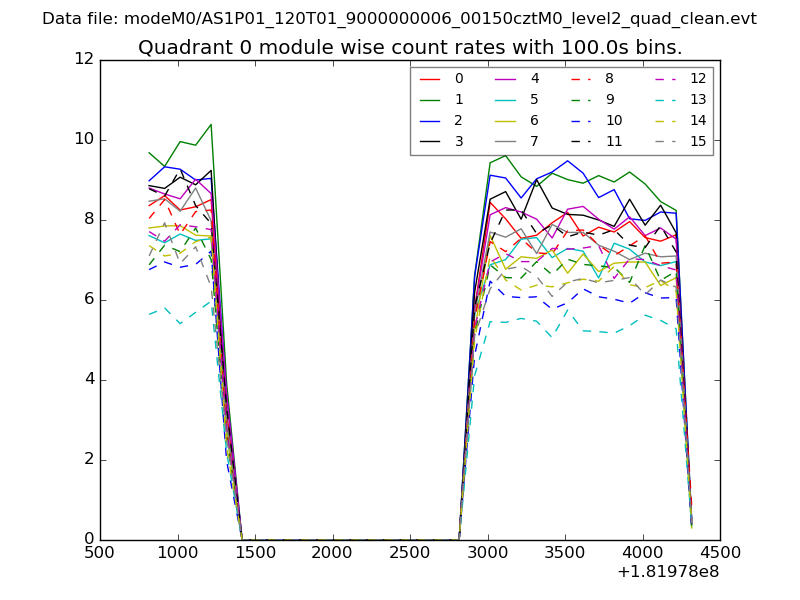
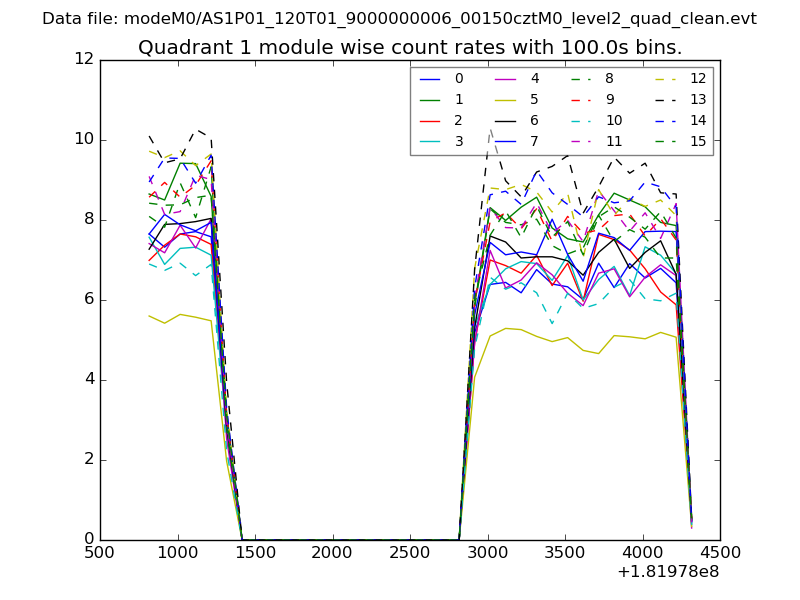
| Module-wise count rates for Quadrant A Data is divided into 100 sec bins |
 |
 |
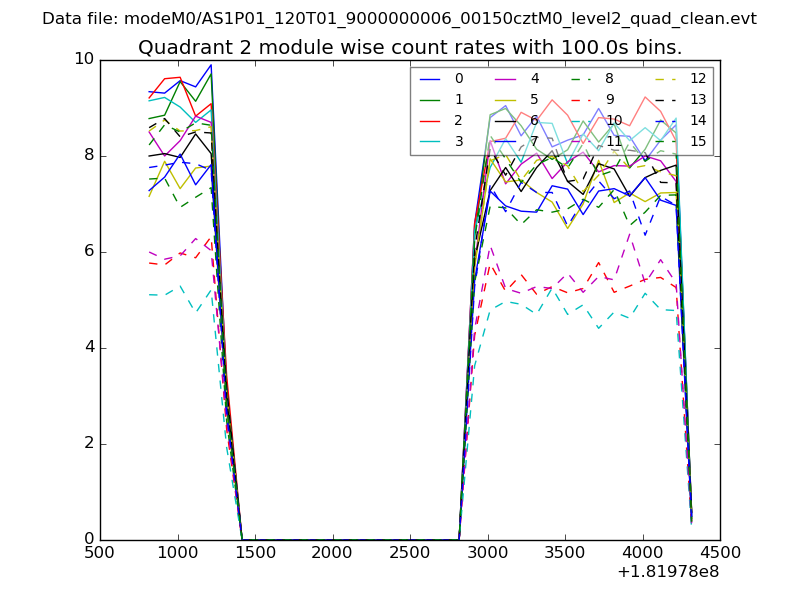
| Module-wise count rates for Quadrant B Data is divided into 100 sec bins |
 |
 |
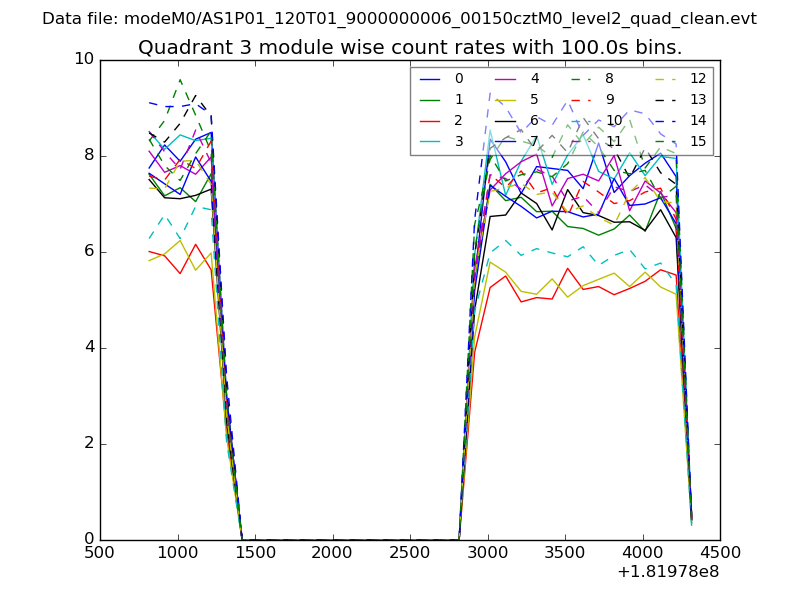
| Module-wise count rates for Quadrant C Data is divided into 100 sec bins |
 |
 |
| Module-wise count rates for Quadrant D Data is divided into 100 sec bins |
 |
 |
| Parameter | Plot |
|---|---|
| CZT HV Monitor | 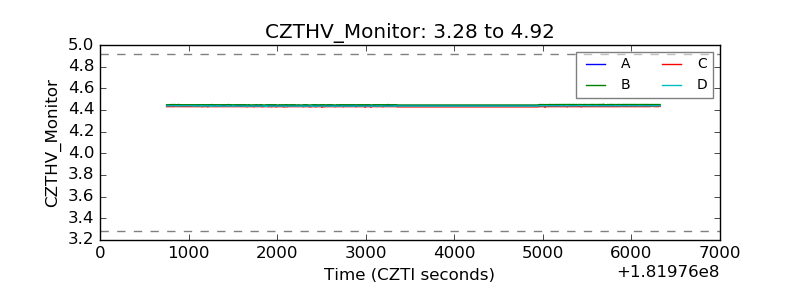 |
| D_VDD |  |
| Temperature 1 |  |
| Veto HV Monitor |  |
| Veto LLD |  |
| Alpha Counter | 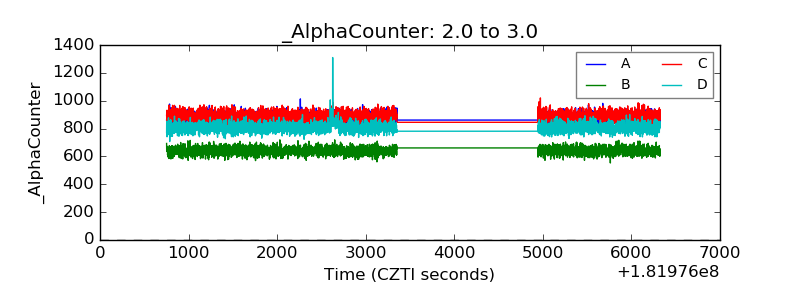 |
| _CPM_Rate | 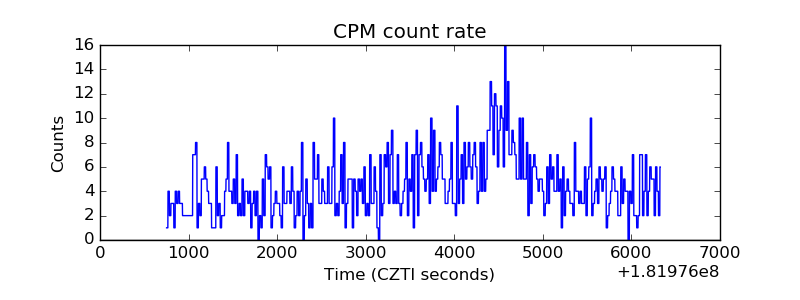 |
| CZT Counter |  |
| +2.5 Volts monitor |  |
| +5 Volts monitor |  |
| _ROLL_ROT |  |
| _Roll_DEC |  |
| _Roll_RA |  |
| Veto Counter | 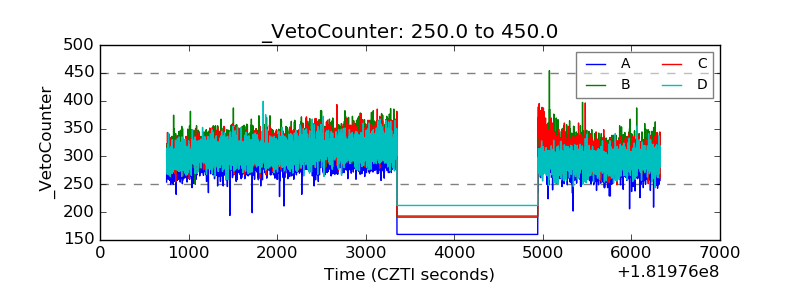 |