| Param | Original file | Final file |
|---|---|---|
| Filename | modeM0/AS1P01_120T01_9000000006_00151cztM0_level2.evt | modeM0/AS1P01_120T01_9000000006_00151cztM0_level2_quad_clean.evt |
| Size (bytes) | 935,516,160 | 55,699,200 |
| Size | 892.2 MB | 53.1 MB |
| Events in quadrant A | 7,002,830 | 325,814 |
| Events in quadrant B | 7,096,670 | 332,959 |
| Events in quadrant C | 6,088,804 | 331,257 |
| Events in quadrant D | 7,787,369 | 319,183 |
| Mode SS | |||
|---|---|---|---|
| Quadrant | BADHDUFLAG | Total packets | Discarded packets |
| A | 0 | 110 | 0 |
| B | 0 | 110 | 0 |
| C | 0 | 110 | 0 |
| D | 0 | 110 | 0 |
| Mode M9 | |||
|---|---|---|---|
| Quadrant | BADHDUFLAG | Total packets | Discarded packets |
| A | 0 | 16 | 0 |
| B | 0 | 16 | 0 |
| C | 0 | 16 | 0 |
| D | 0 | 16 | 0 |
| Mode M0 | |||
|---|---|---|---|
| Quadrant | BADHDUFLAG | Total packets | Discarded packets |
| A | 0 | 24650 | 2 |
| B | 0 | 24916 | 1 |
| C | 0 | 21910 | 1 |
| D | 0 | 26947 | 1 |
| Quadrant | Total seconds | Saturated seconds | Saturation percentage |
|---|---|---|---|
| A | 5382 | 8 | 0.148644% |
| B | 5382 | 69 | 1.282051% |
| C | 5382 | 1 | 0.018580% |
| D | 5382 | 94 | 1.746563% |
Noise dominated data is calculated using 1-second bins in cleaned event files. If a bin has >2000 counts, and if more than 50% of those come from <1% of pixels, then it is considered to be noise-dominated and hence unusable.
| Quadrant | # 1 sec bins | Bins with >0 counts | Bins with >2000 counts | High rate bins dominated by noise | Noise dominated (total time) | Noise dominated (detector-on time) | Marked lightcurve |
|---|---|---|---|---|---|---|---|
| A | 6975 | 5384 | 222 | 222 | 3.18% | 4.12% | 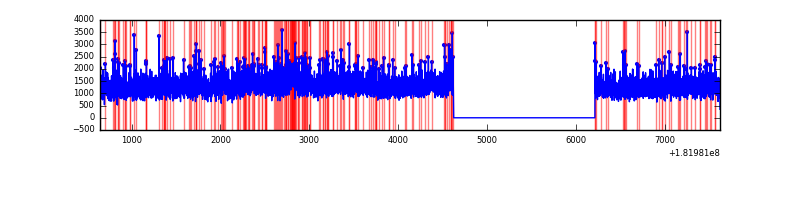 |
| B | 6975 | 5384 | 281 | 281 | 4.03% | 5.22% |  |
| C | 6975 | 5384 | 56 | 56 | 0.80% | 1.04% | 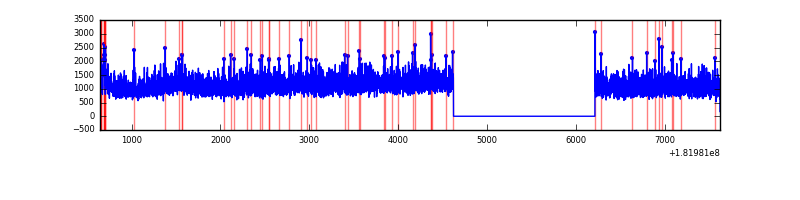 |
| D | 6975 | 5384 | 580 | 580 | 8.32% | 10.77% | 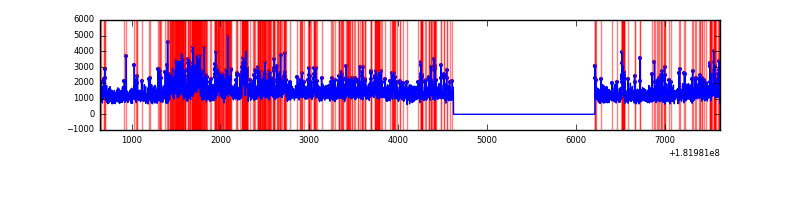 |
Top three noisy pixels from each quadrant. If the there are fewer than three noisy pixels in the level2.evt file, extra rows are filled as -1
| Pixel properties | Quadrant properties | ||||||
|---|---|---|---|---|---|---|---|
| Quadrant | DetID | PixID | Counts | Sigma | Mean | Median | Sigma |
| A | 14 | 10 | 234537 | 831.6 | 1717 | 1677 | 280.0 |
| A | 13 | 146 | 43361 | 148.86 | 1717 | 1677 | 280.0 |
| A | 13 | 9 | 15586 | 49.67 | 1717 | 1677 | 280.0 |
| B | 10 | 199 | 208318 | 553.97 | 1656 | 1657 | 373.1 |
| B | 10 | 48 | 131057 | 346.86 | 1656 | 1657 | 373.1 |
| B | 0 | 150 | 98589 | 259.83 | 1656 | 1657 | 373.1 |
| C | 0 | 218 | 79945 | 184.41 | 1507 | 1563 | 425.0 |
| C | 0 | 188 | 55691 | 127.35 | 1507 | 1563 | 425.0 |
| C | 9 | 54 | 8333 | 15.93 | 1507 | 1563 | 425.0 |
| D | 13 | 222 | 490499 | 1152.46 | 1609 | 1621 | 424.2 |
| D | 0 | 243 | 292718 | 686.22 | 1609 | 1621 | 424.2 |
| D | 2 | 70 | 247843 | 580.43 | 1609 | 1621 | 424.2 |
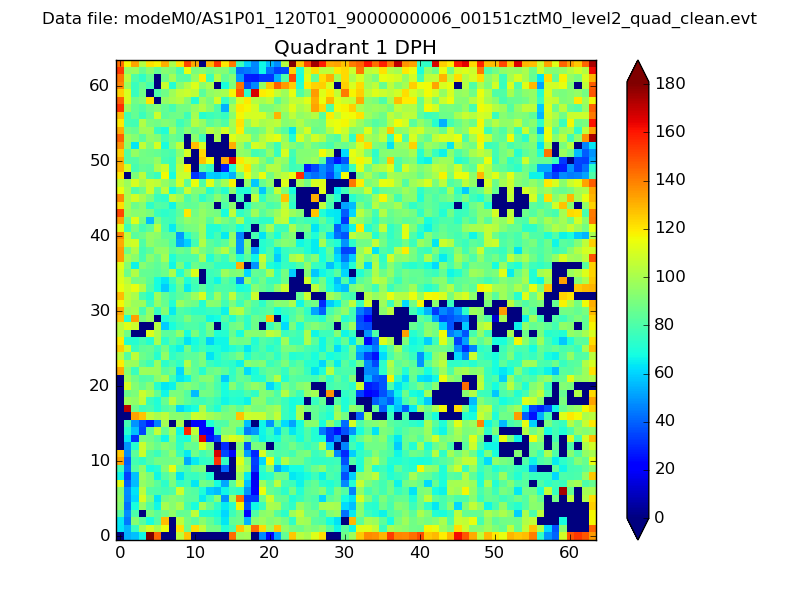
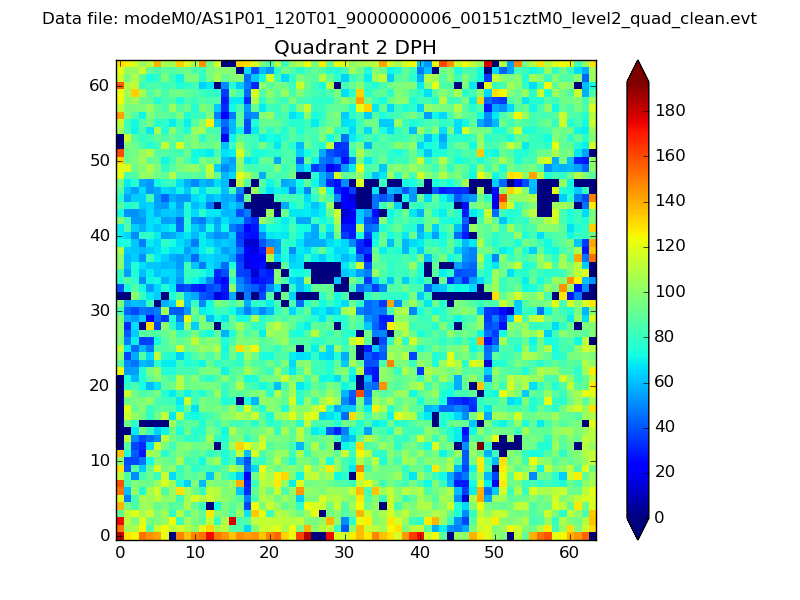
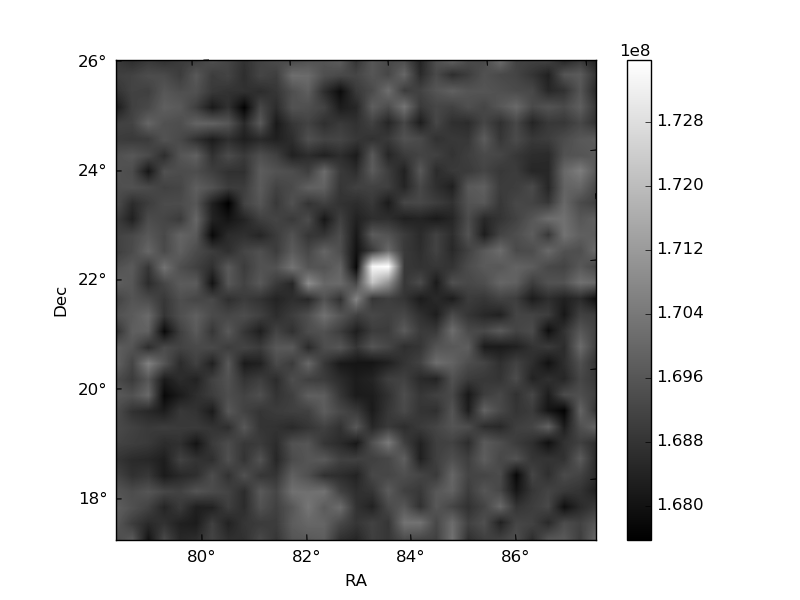
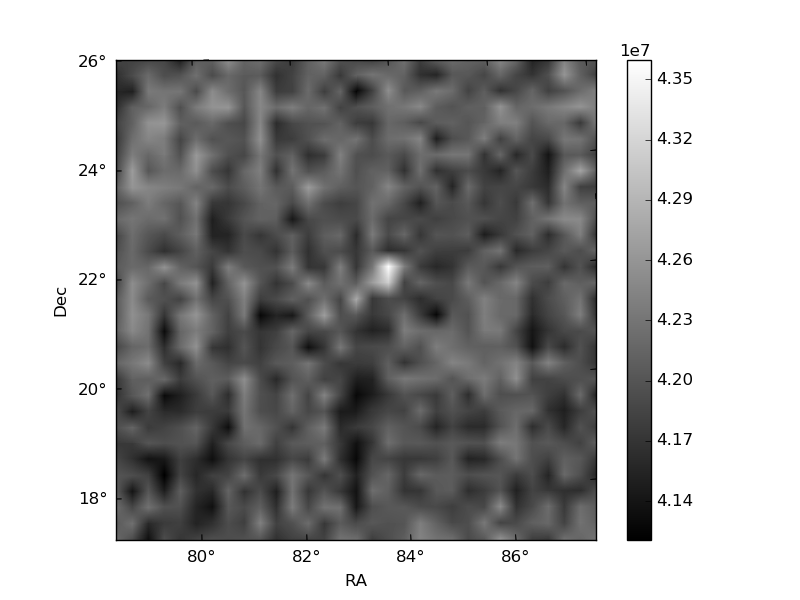
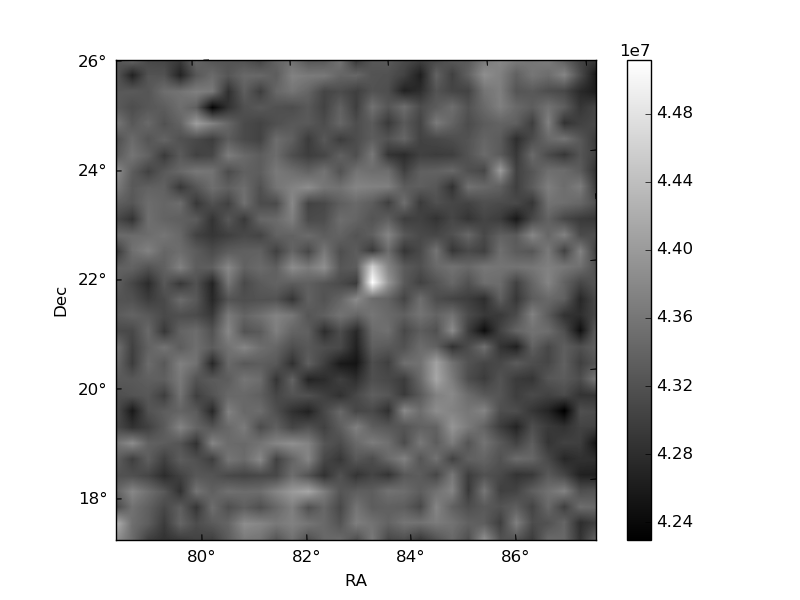
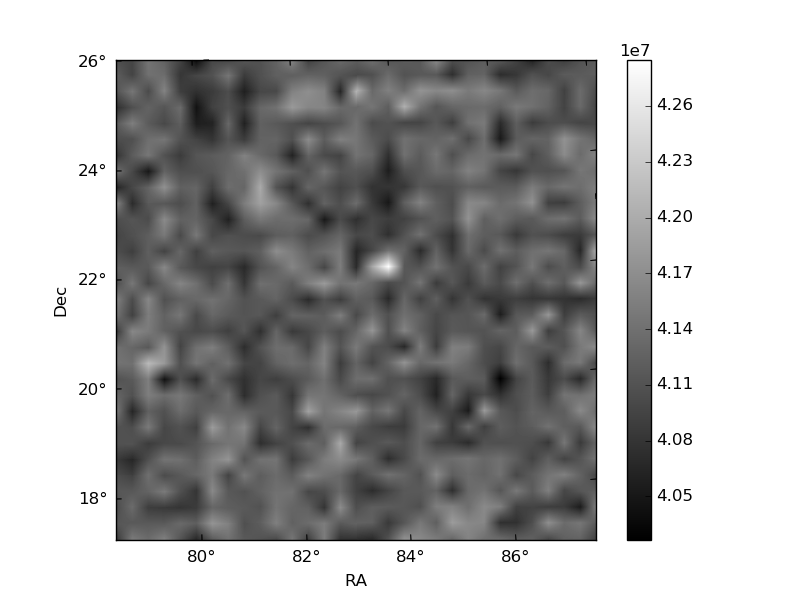
Histogram calculated using DETX and DETY for each event in the final _common_clean file
| Quadrant A | 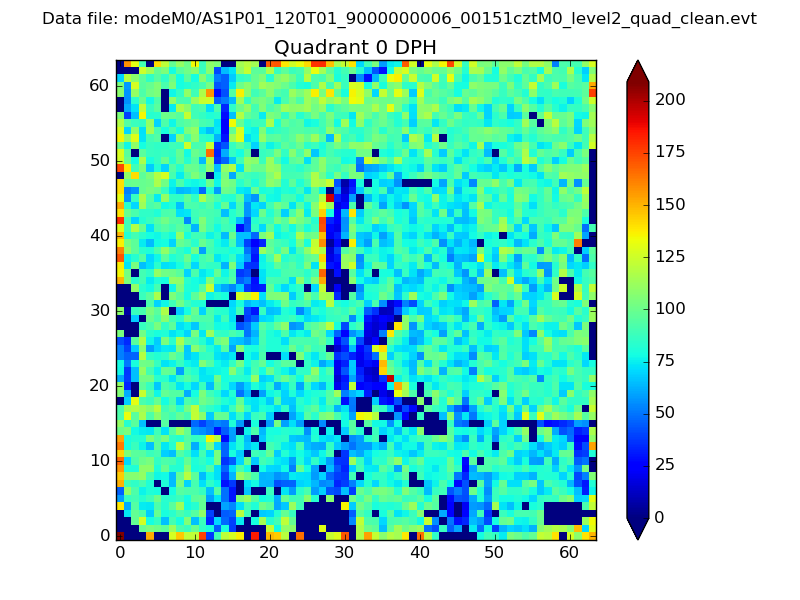 |
 |
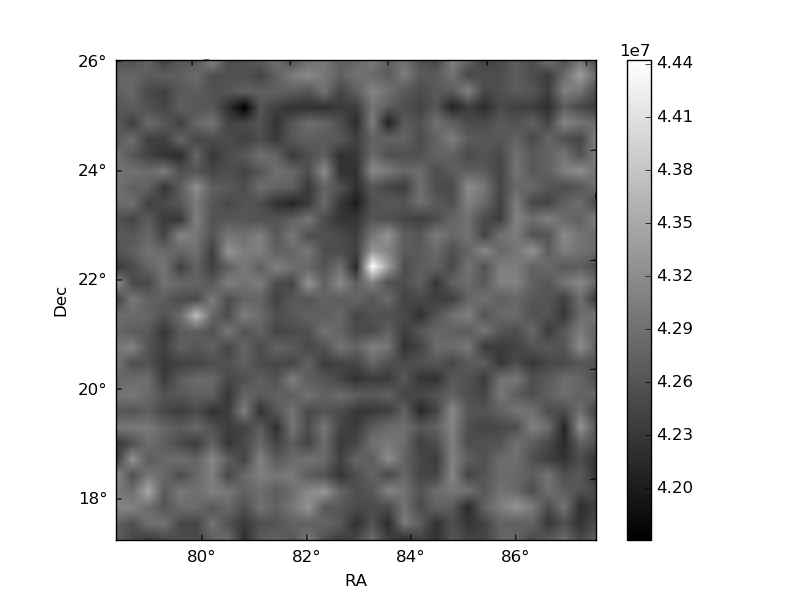
Quadrant B |
|---|---|---|---|
| Quadrant D | 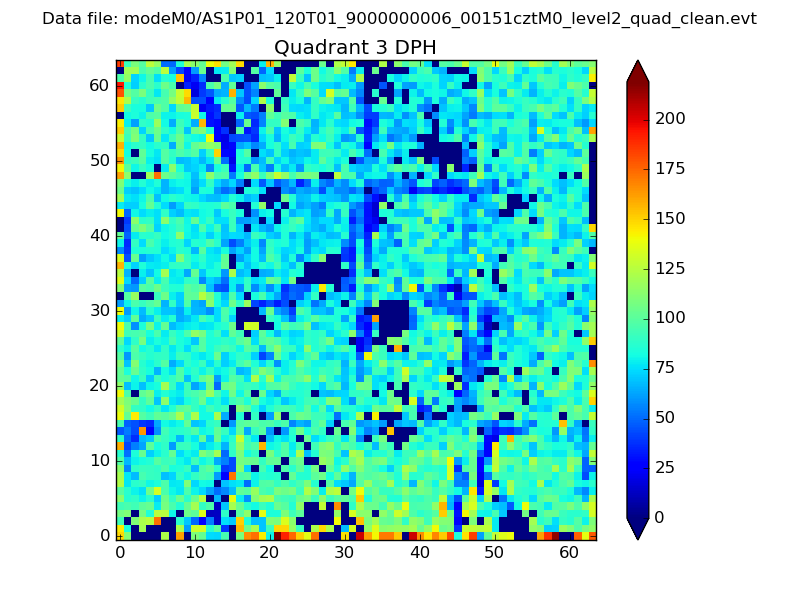 |
 |
Quadrant C |
| Plot type | Count rate plots | Images |
|---|---|---|
| Comparison with Poisson distribution Blue bars denote a histogram of data divided into 1 sec bins. Red curve is a Poisson curve with rate = median count rate of data. |
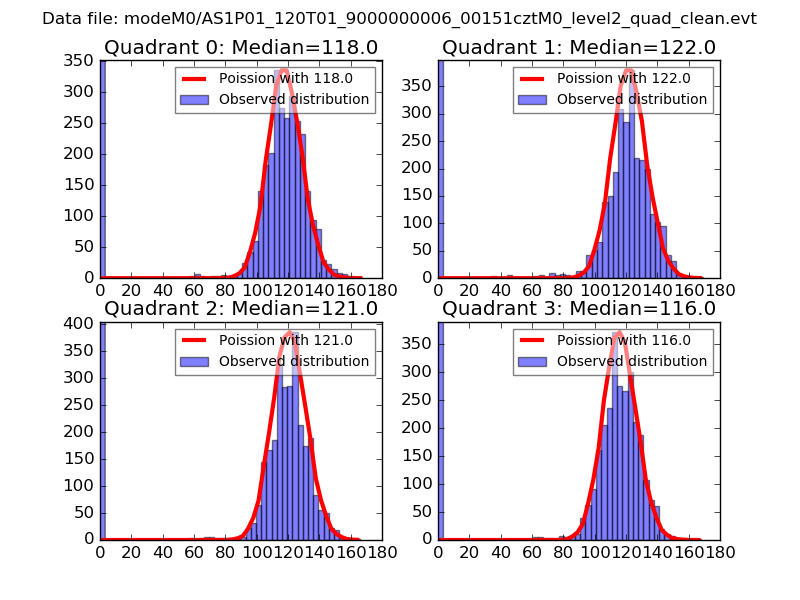 |
 |
| Quadrant-wise count rates Data is divided into 100 sec bins |
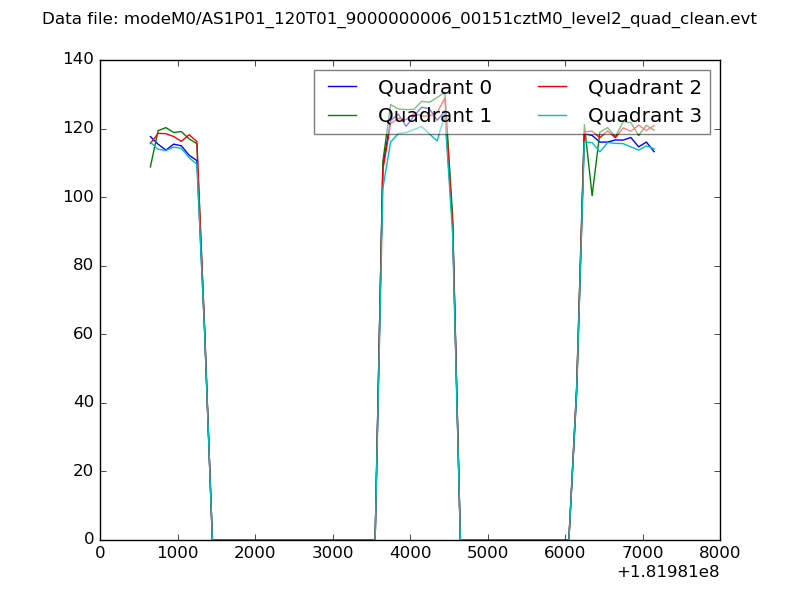 |
|
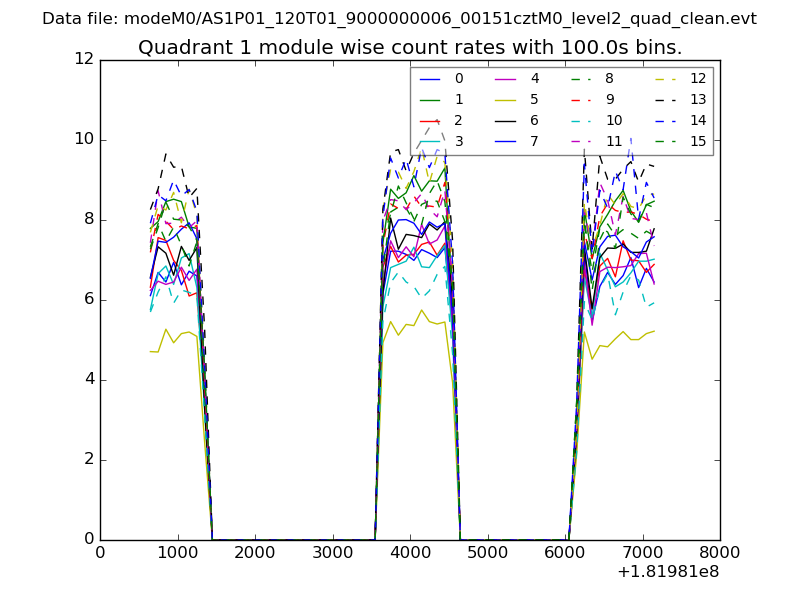
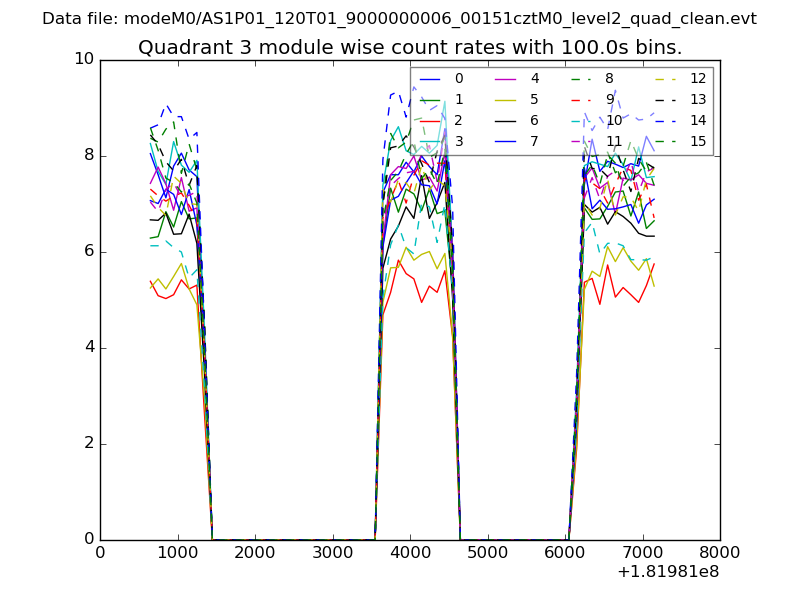
| Module-wise count rates for Quadrant A Data is divided into 100 sec bins |
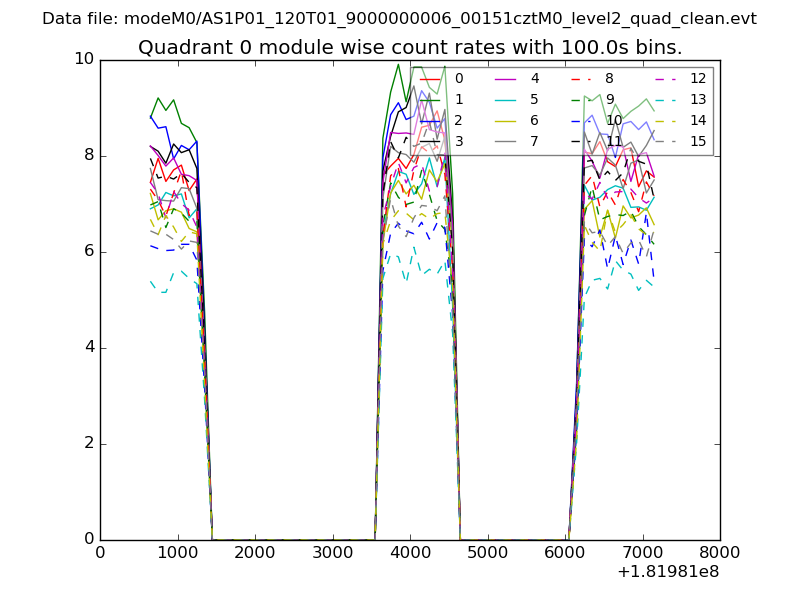 |
 |
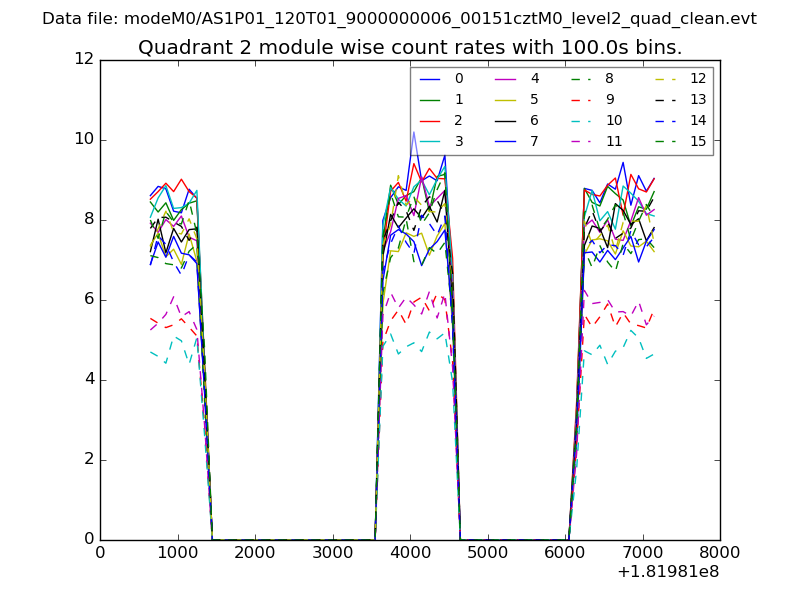
| Module-wise count rates for Quadrant B Data is divided into 100 sec bins |
 |
 |
| Module-wise count rates for Quadrant C Data is divided into 100 sec bins |
 |
 |
| Module-wise count rates for Quadrant D Data is divided into 100 sec bins |
 |
 |
| Parameter | Plot |
|---|---|
| CZT HV Monitor | 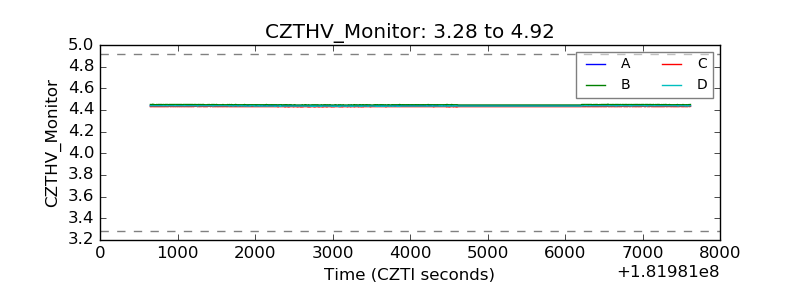 |
| D_VDD |  |
| Temperature 1 | 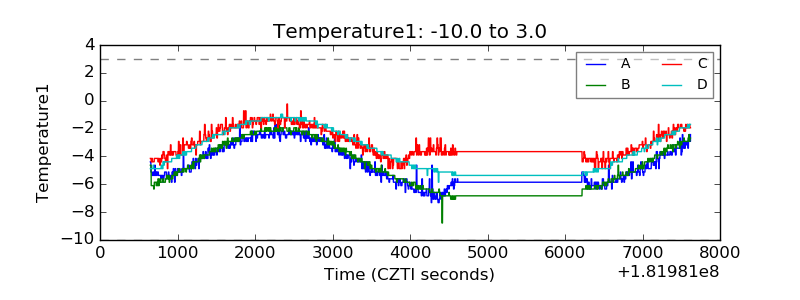 |
| Veto HV Monitor | 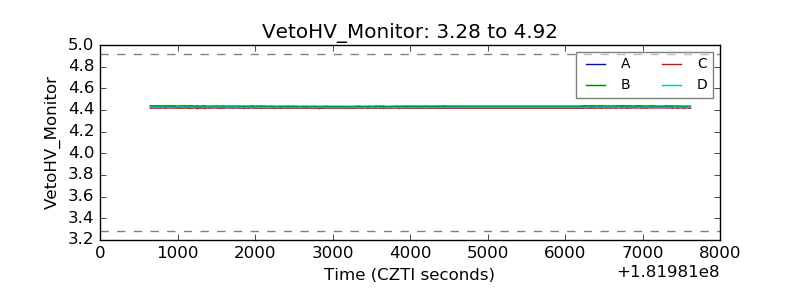 |
| Veto LLD |  |
| Alpha Counter | 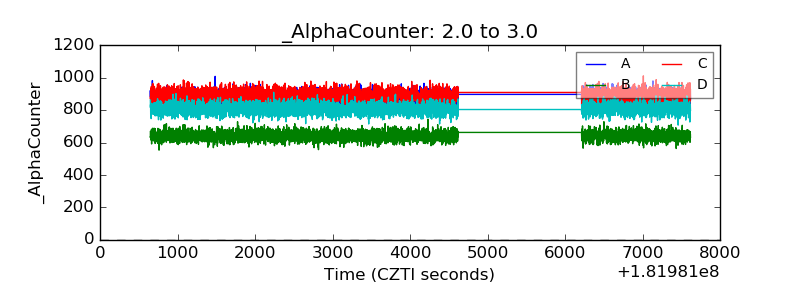 |
| _CPM_Rate | 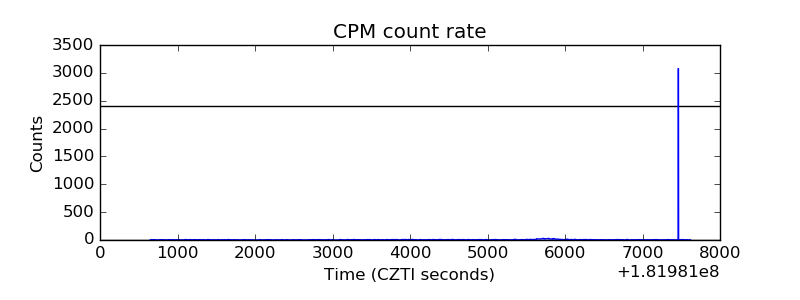 |
| CZT Counter | 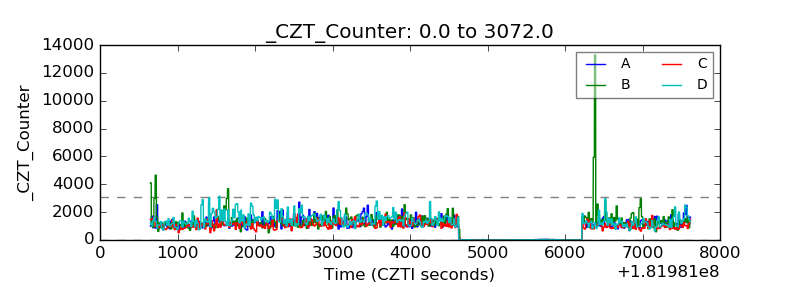 |
| +2.5 Volts monitor |  |
| +5 Volts monitor |  |
| _ROLL_ROT | 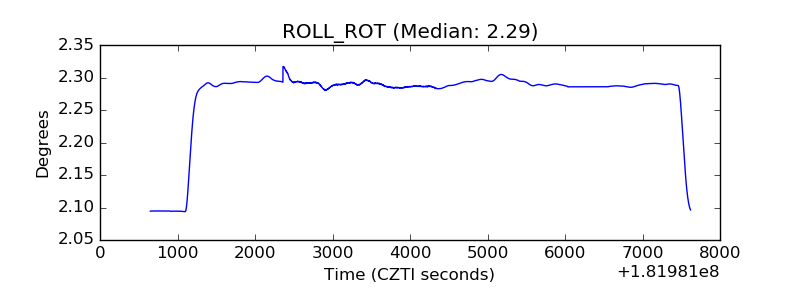 |
| _Roll_DEC | 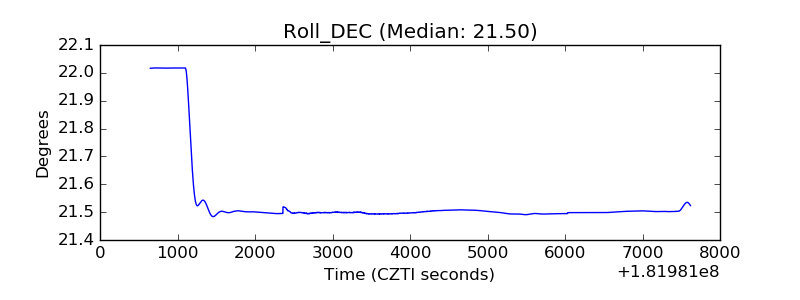 |
| _Roll_RA | 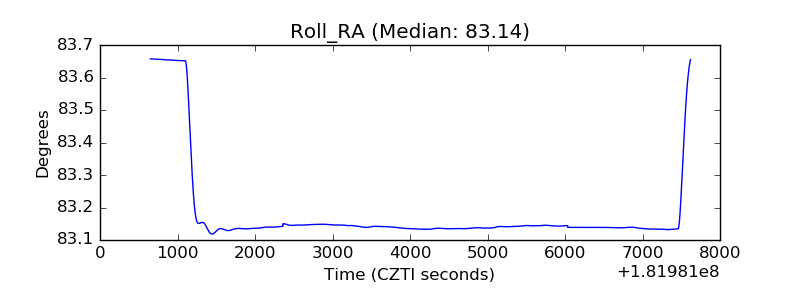 |
| Veto Counter | 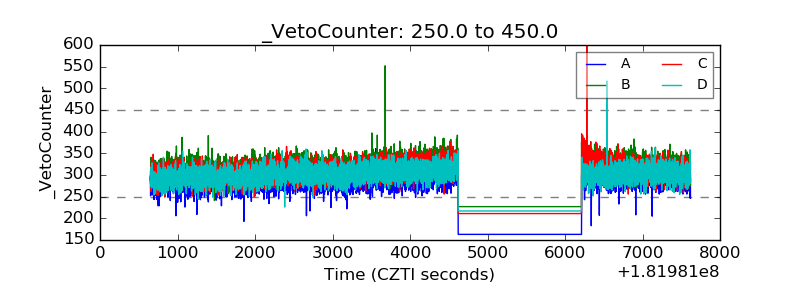 |